This article continues a series reviewing service quality on some of the TTC’s shorter routes.
Overview
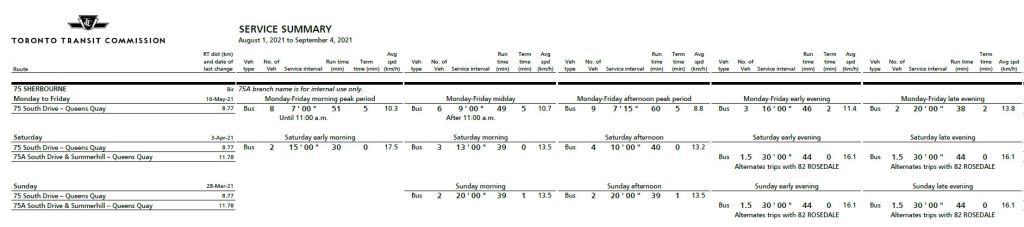
75 Sherbourne operates between Rosedale and Queens Quay. At the south end, it has an on street loop normally via Queens Quay, Jarvis and The Esplanade. At its north end, the loop reaches to the south end of the Glen Road bridge on South Drive.
For this analysis, the two screenlines used are located at:
Sherbourne just south of Bloor. This records the headways at the major subway connection point, Sherbourne Station.
Sherbourne just north of Front. This records headways north of the south-end loop.
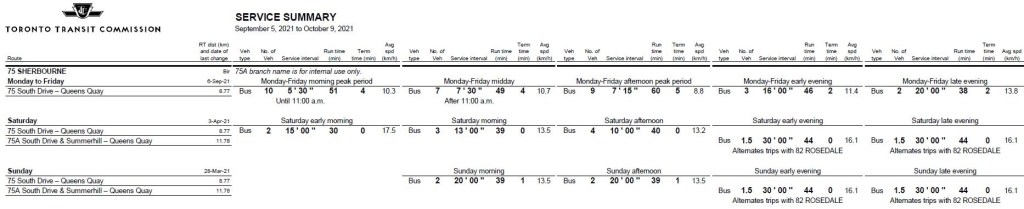
The service design during September 2021 is shown below. From September 1st to 3rd, the line operated on a summer schedule with less frequent service during the peaks and midday.
Weekend evenings the route is interlined with 82 Rosedale on a 30 minute headway using two buses over the combined route.
In these headway charts, the vertical scale is extended from the 0-30 minute range used in past articles to 0-60 minutes so that all data points will be visible.
75 Sherbourne shows all of the problems seen on other routes including missing vehicles and bunching, and, in some periods, a lack of sufficient running time to provide for recovery from minor incidents enroute. Service is often unreliable.
This article continues a series reviewing service quality on some of the TTC’s shorter routes that generally escape notice when buses like Dufferin and Finch come under fire for erratic operation.
Overview
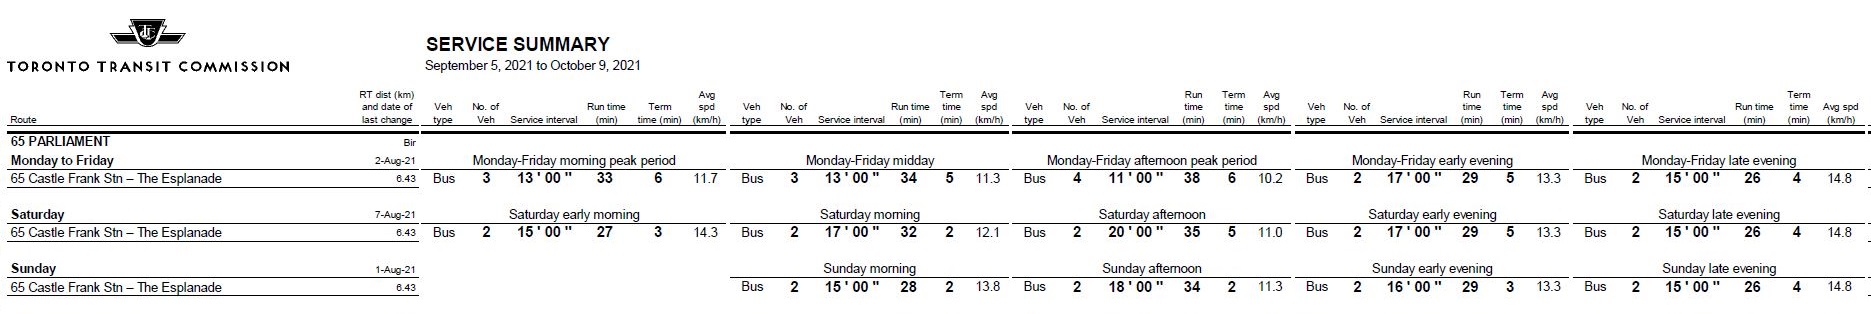
65 Parliament is a very short route operating from Castle Frank Station on Line 2 BD south to The Esplanade. The 2022 Service Plan proposes extending the route south to Queens Quay to the loop at Corus Quay serving George Brown College.
The service design during September 2021 is shown below:
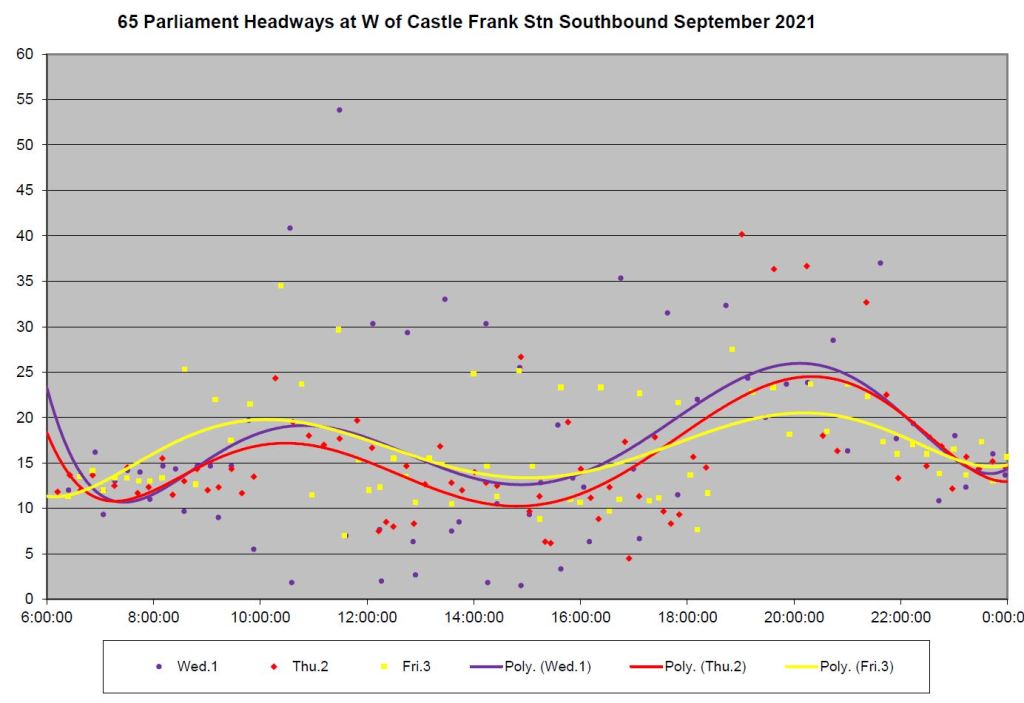
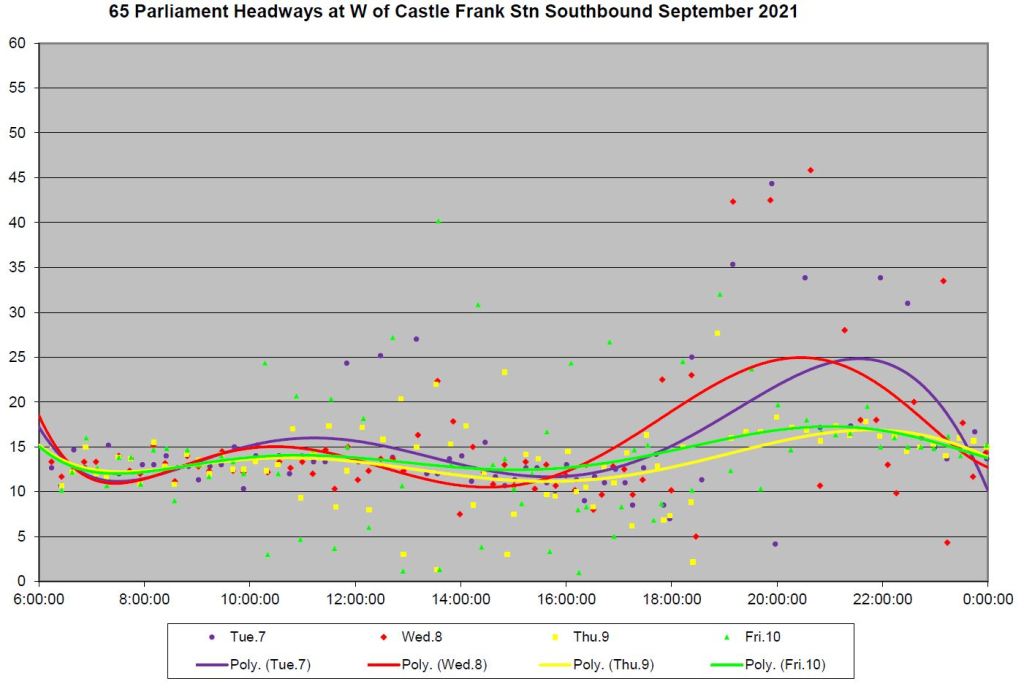
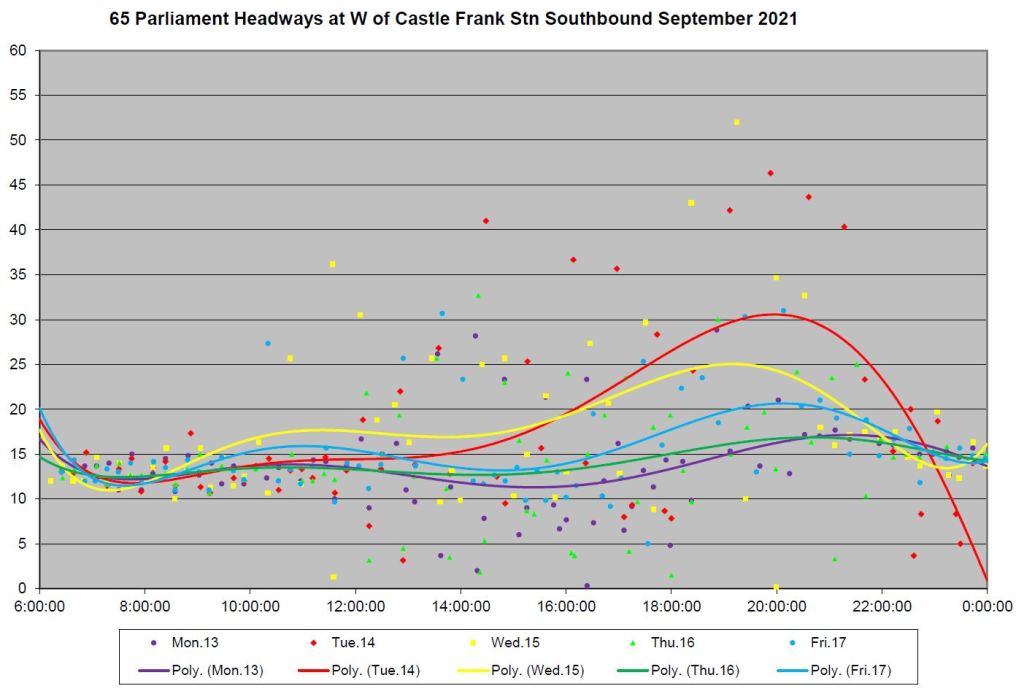
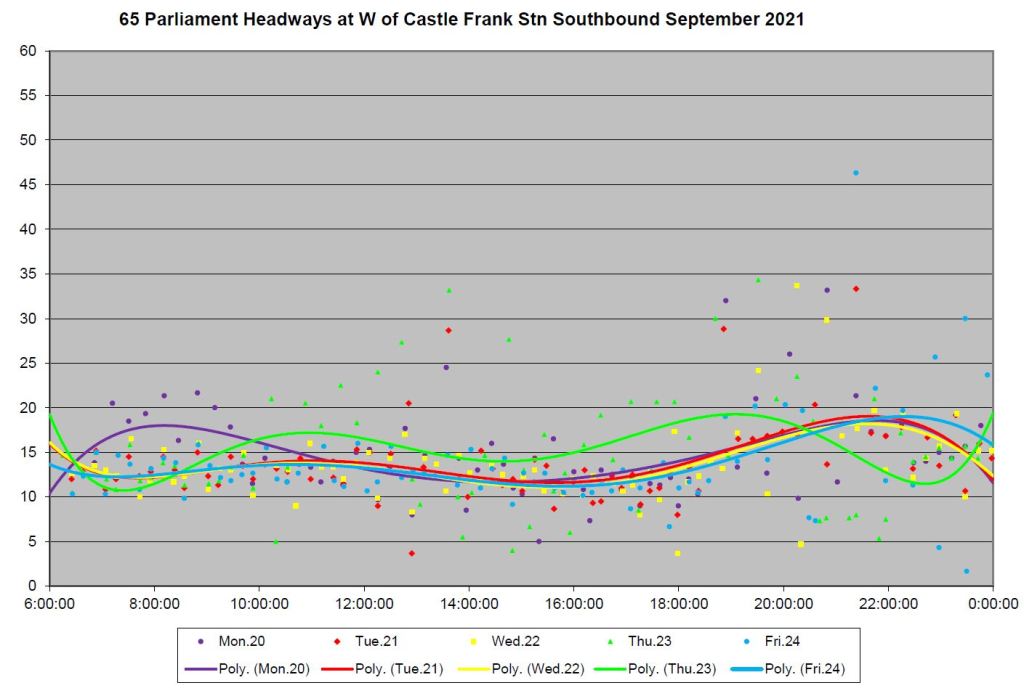
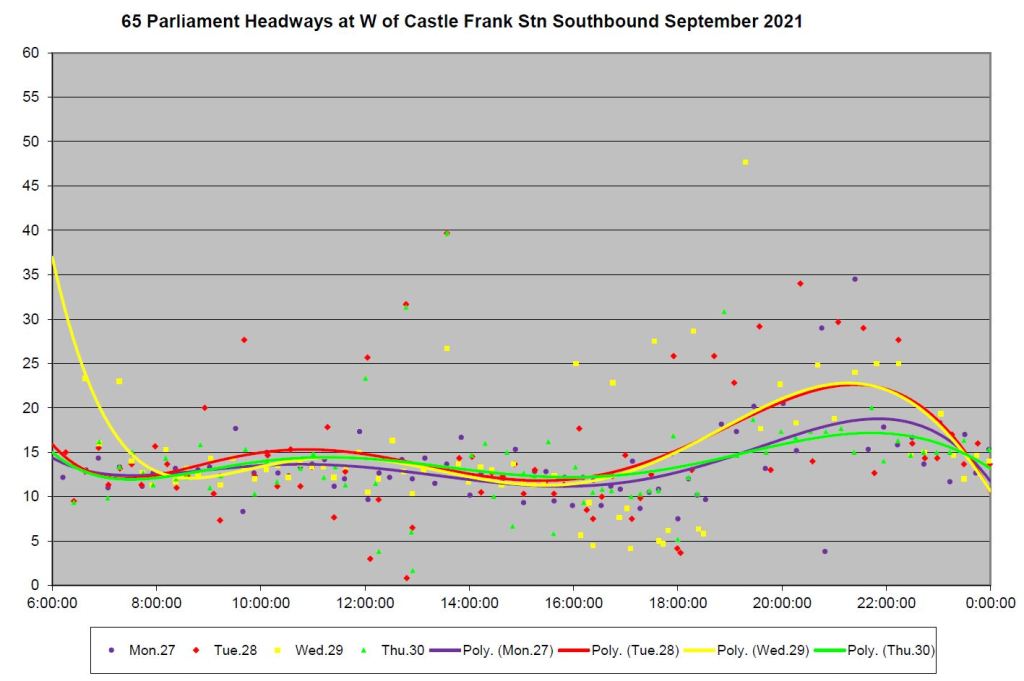
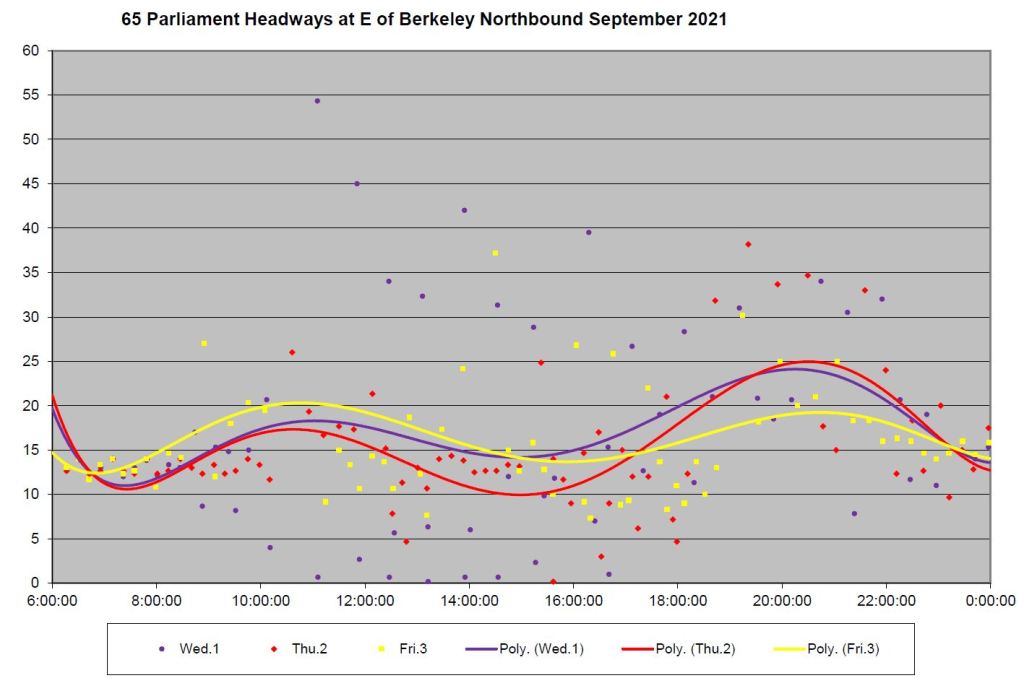
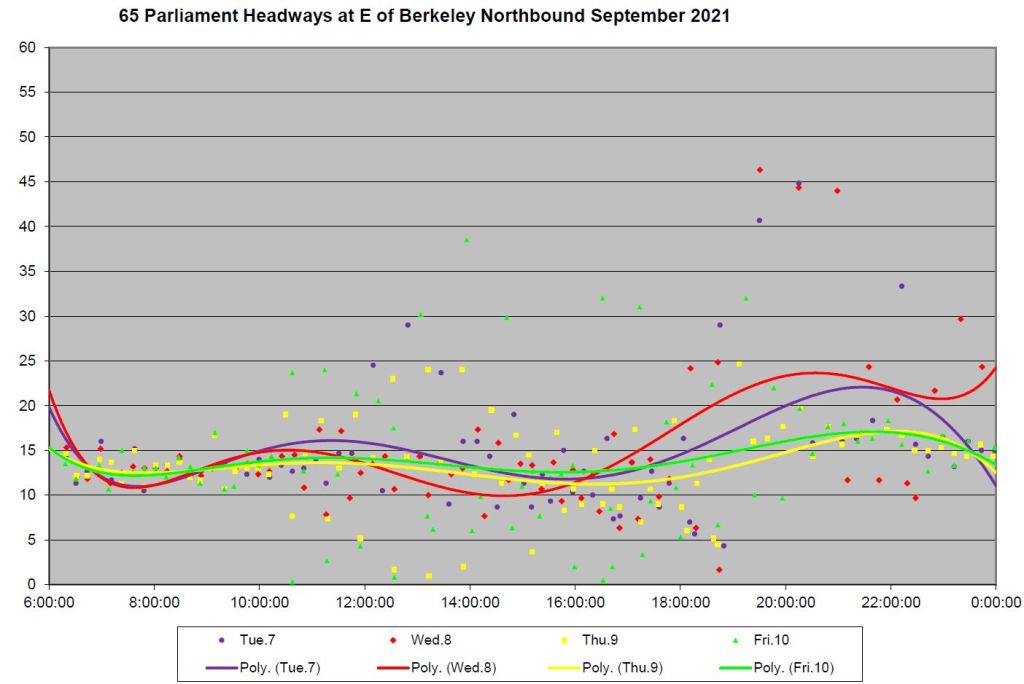
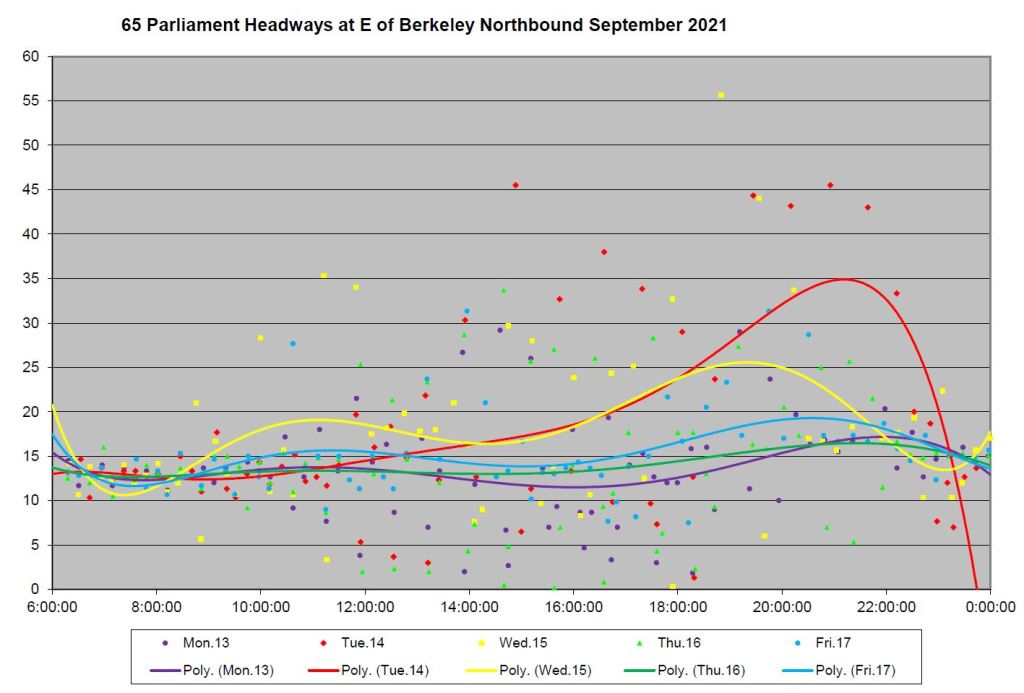
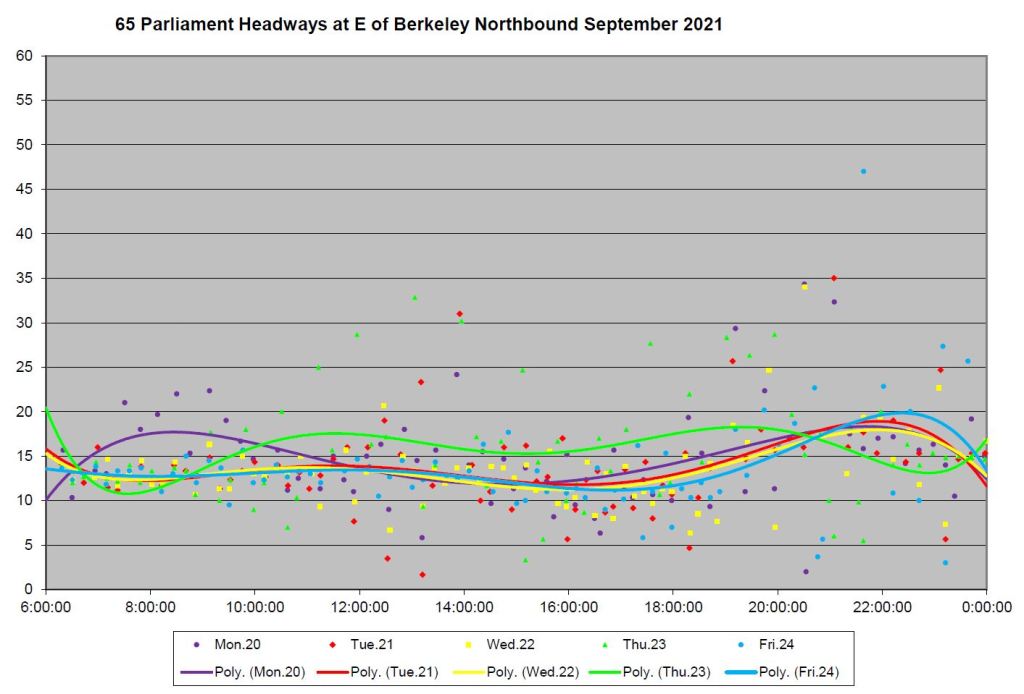
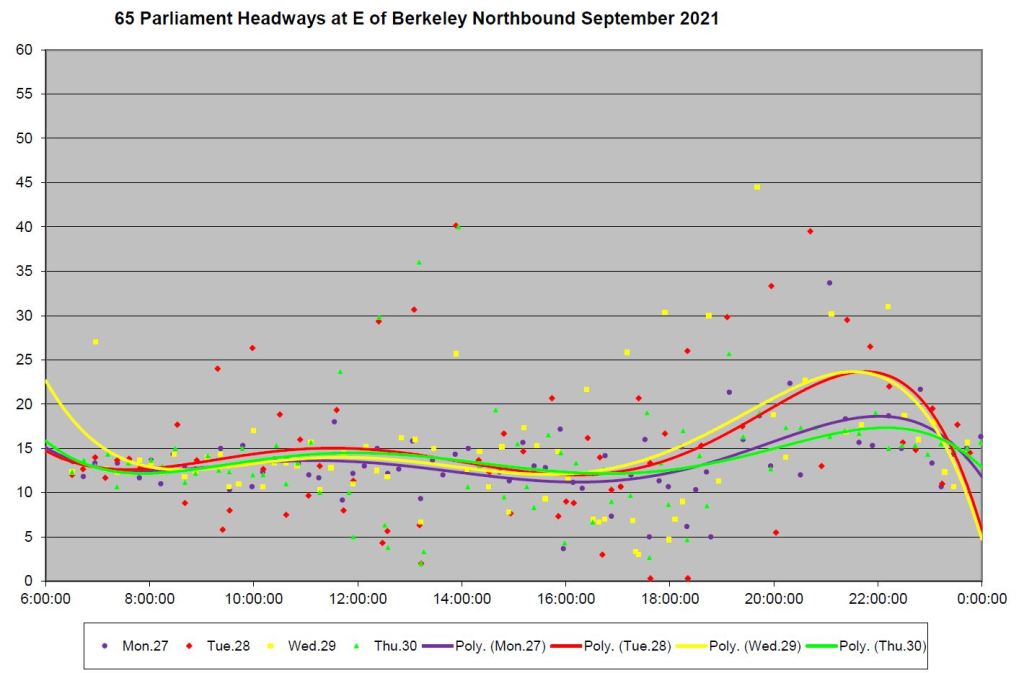
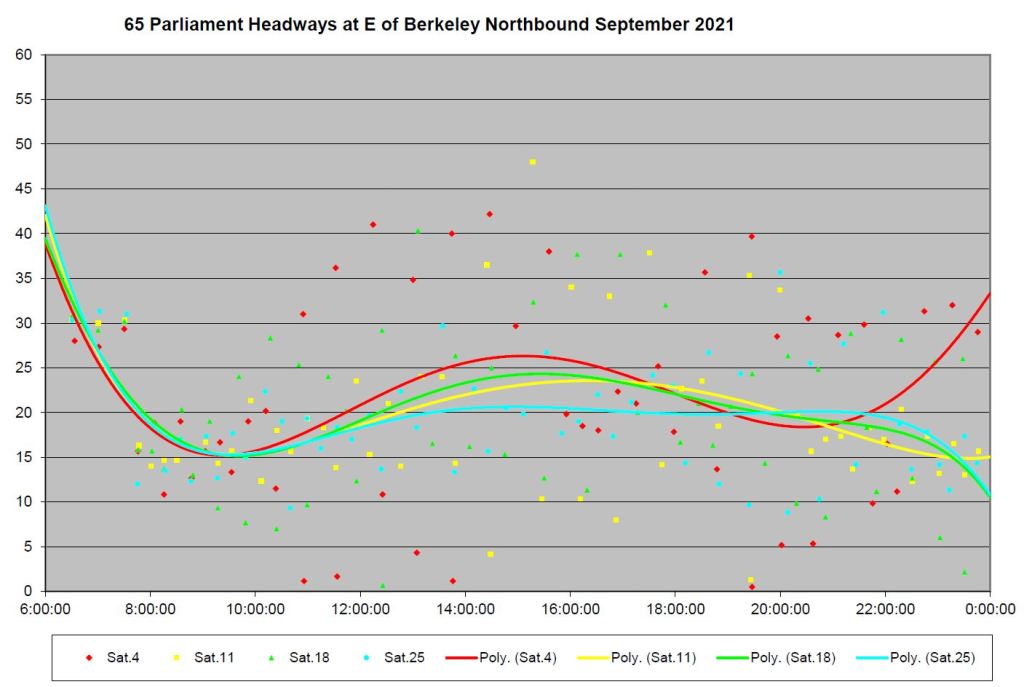
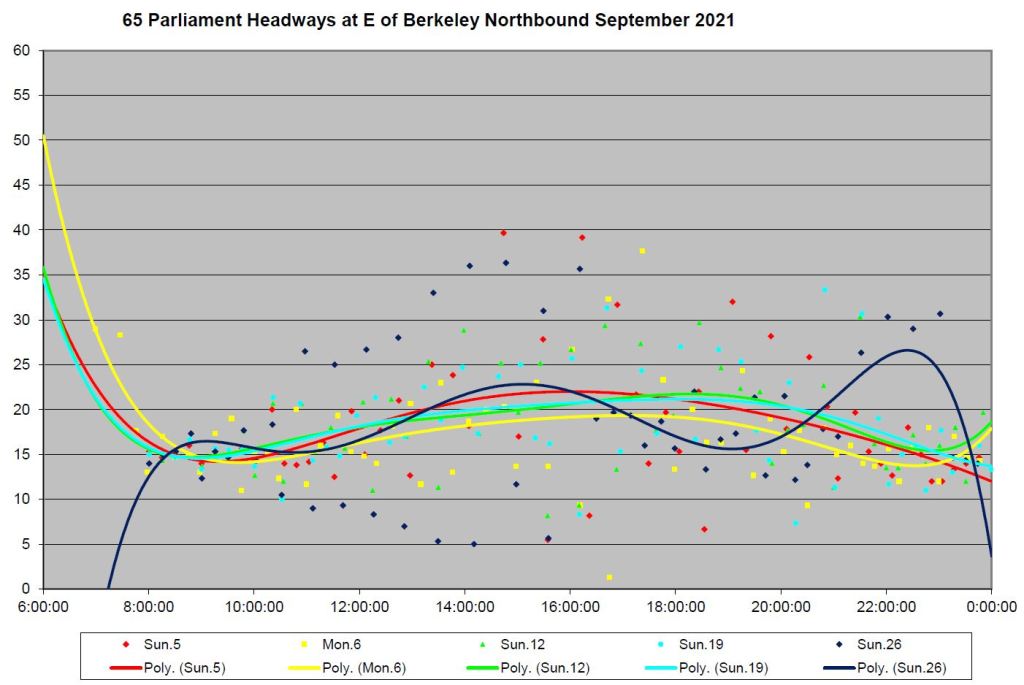
Although the scheduled headway varies from 11 to 20 minutes, the actual headway operated can at times be well over half an hour either because buses are missing from the route, or because the limited number of vehicles on the route are running in pairs.
In the headway charts below, I have extended the vertical scale from the 0-30 minute range used in past articles to 0-60 minutes so that the data points will be visible.
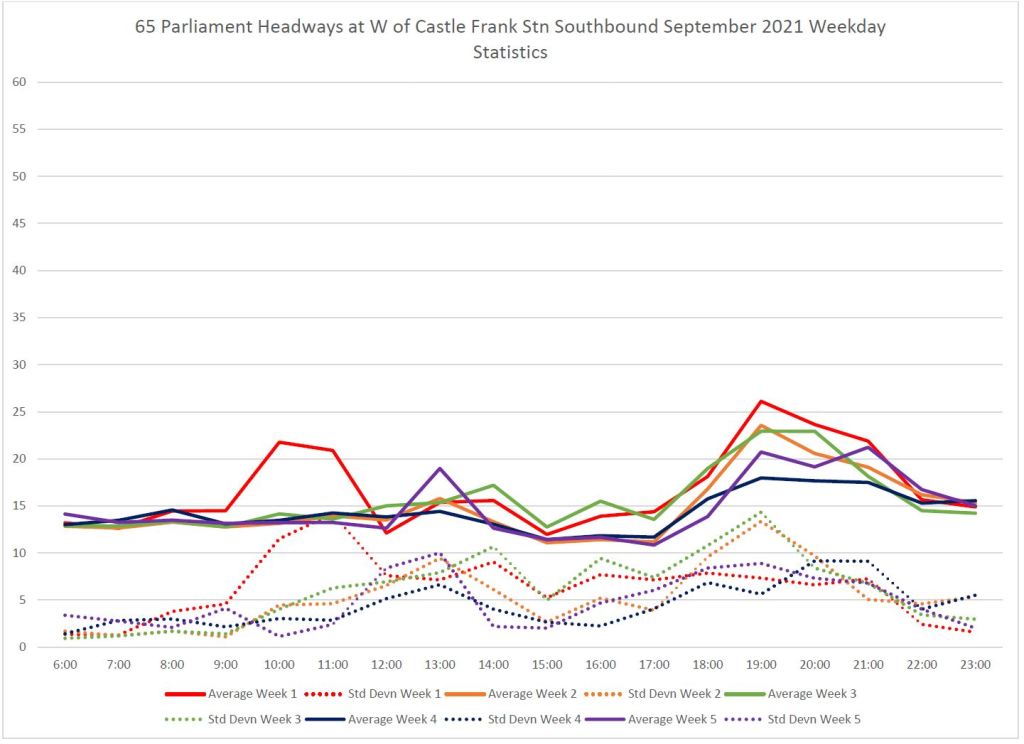
Southbound From Castle Frank Station
The screenline for the data here is on Bloor Street west of Castle Frank Station.
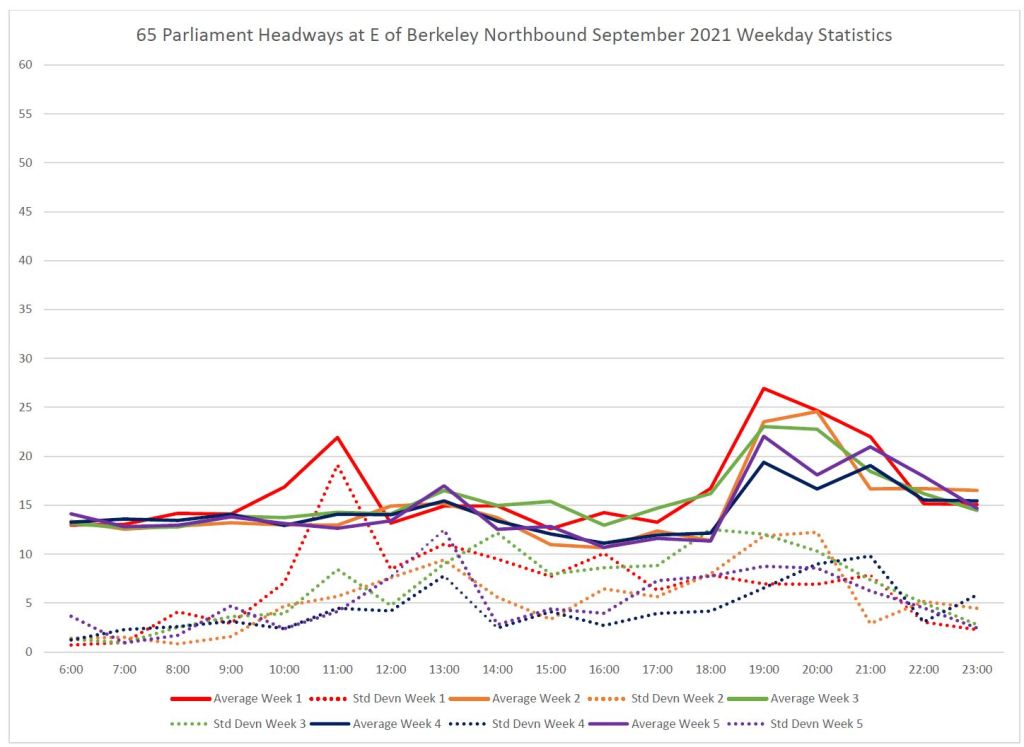
In spite of this route being short, there is a wide dispersion in headway values as the charts show. In a pattern seen on other routes, the standard deviation of the headways (dotted lines in the first chart) lie between 0 and 5 minutes for the first few hours of service, but rise substantially thereafter. This is a measure of the degree to which headways diverge from the mean value.
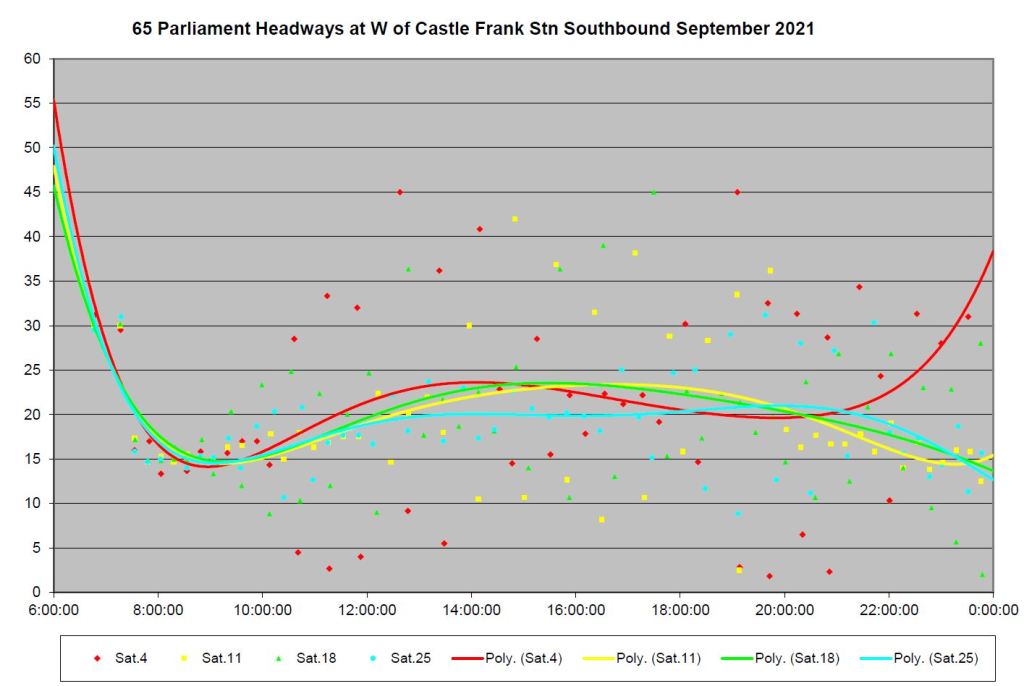
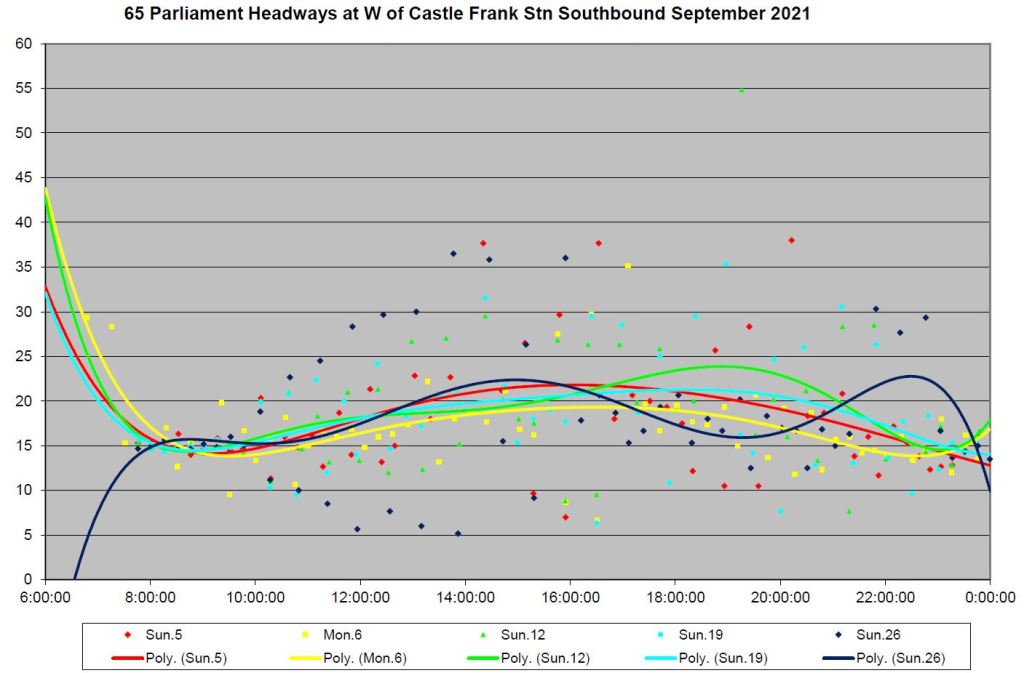
Those means show their own variation on a week-by-week basis indicating that the number of trips (and hence the average headway) was not consistent across the month. Day by day breakdowns are in the rest of the charts.
Days with very wide gaps and bunching are not rare oddities, but are a common situation on this route.
This article continues a series about service quality on some of the TTC’s shorter routes.
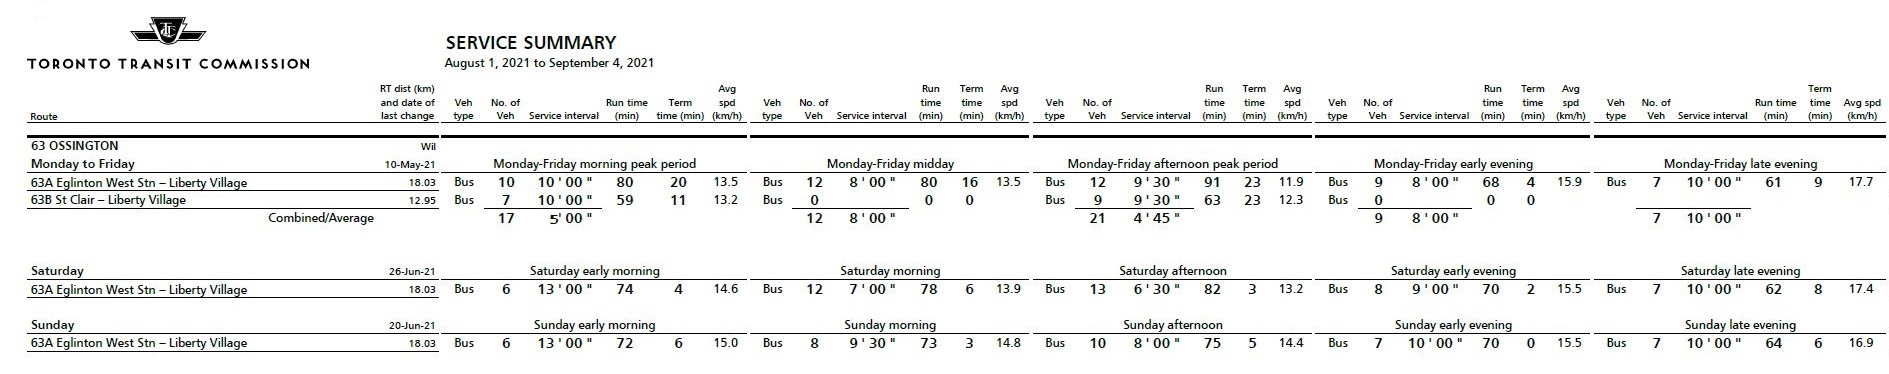
63 Ossington has a similar scale to the 47 Lansdowne reviewed in the previous article in this series. Although the service is far from ideal, this route is better behaved than its neighbour, even though it is subject to severe traffic congestion at certain times near its northern terminal due to Line 5 Crosstown construction.
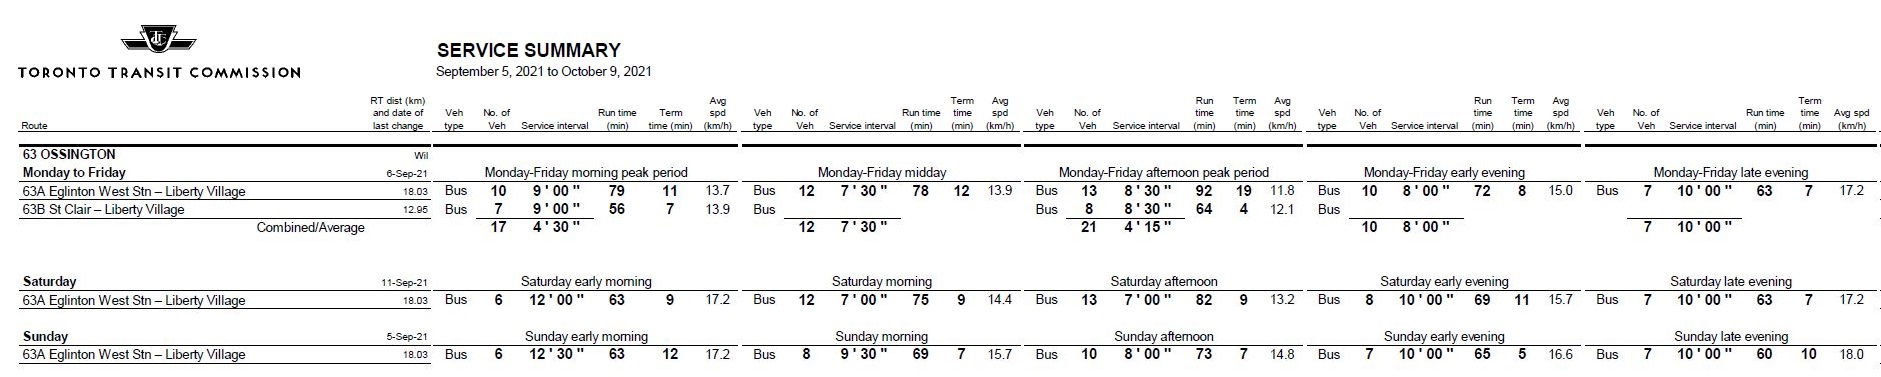
All service on 63 Ossington operates between Liberty Village and Eglinton West Station except during peak periods when half of the service turns back at St. Clair via Oakwood Loop.
The schedules were changed on Labour Day weekend, and so data shown here for the first week of September reflects the old schedule, while from Sunday, September 5 onward, the new schedules were in effect.
In most cases running times have been trimmed although in a few periods they have been lengthened. These changes allowed more frequent service to be scheduled without adding buses to the route. This is a reversal of past TTC practice which has seen headways widened as a way to provide more running time at no marginal cost.
The TTC’s goal for “on time performance” is a band six minutes wide (+1 to -5 minutes relative to schedule), and in some periods, much of the service lies within this band. Nonetheless, on headways ranging from 5 to 10 minutes, bunching is possible and shows up regularly with data points near the x-axis of these charts. Wide gaps, especially at evenings and weekends, are common.
Unlike Lansdowne, this route has no branching structure during most of its operation, particularly when headways are wider. Also, as we will see later in the daily analyses, the congestion at Eglinton West Station occurs mainly during the pm peak, and buses have enough running time that they can take layovers there even after being stuck in traffic approaching the station.
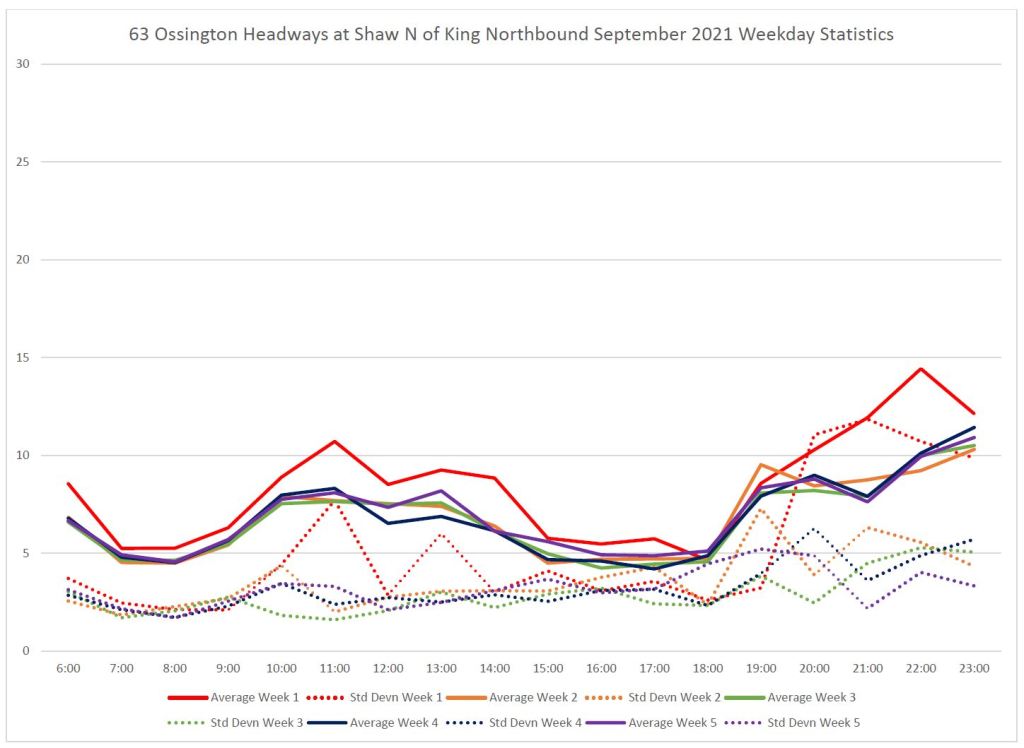
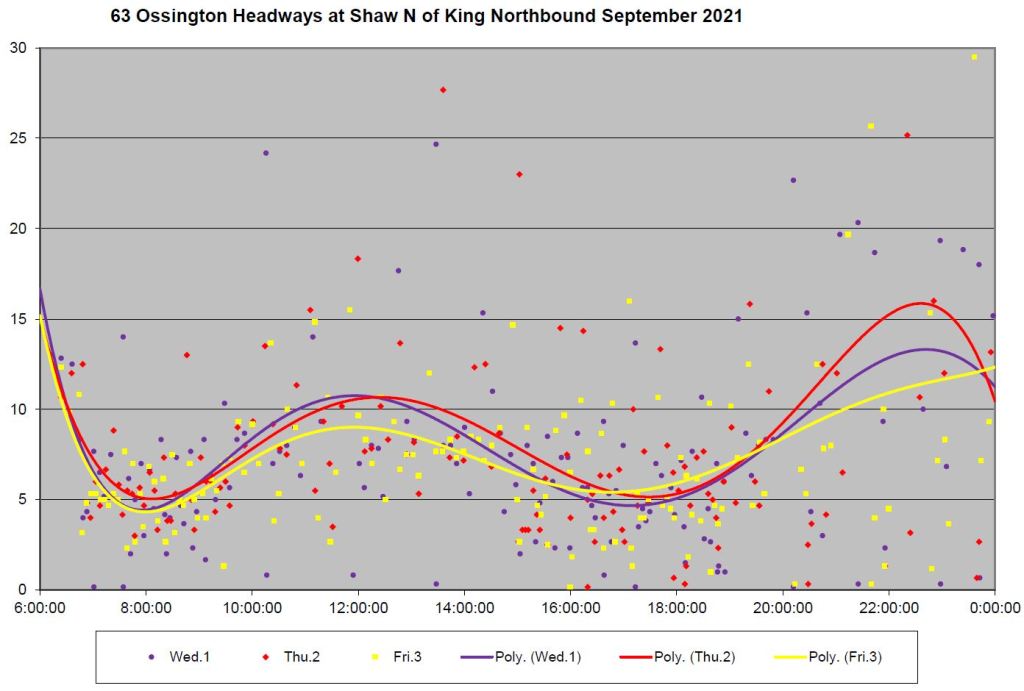
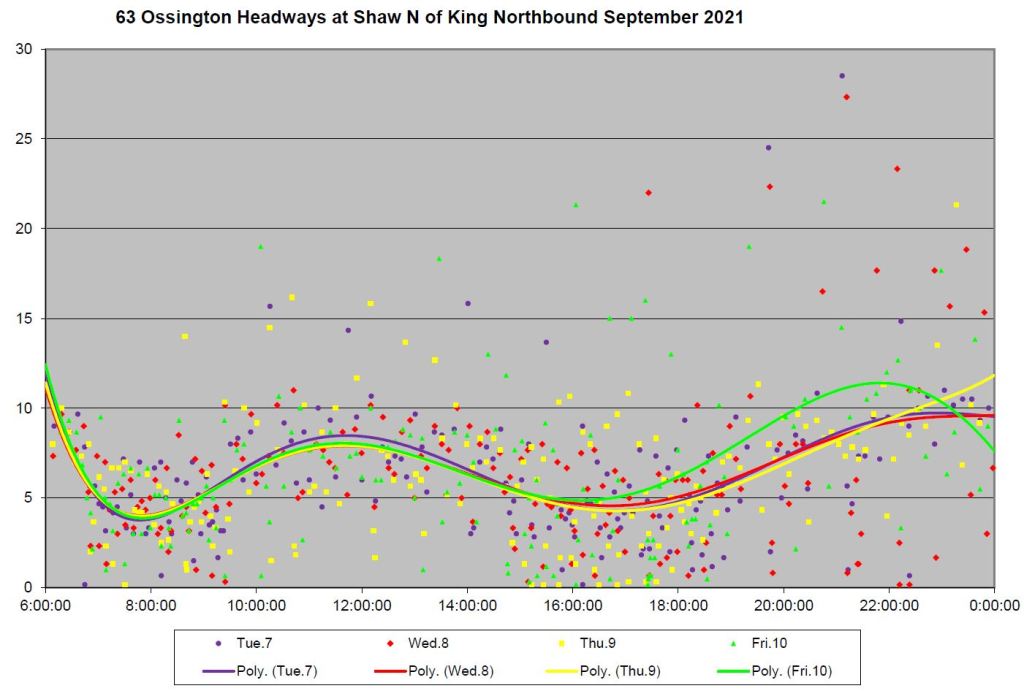
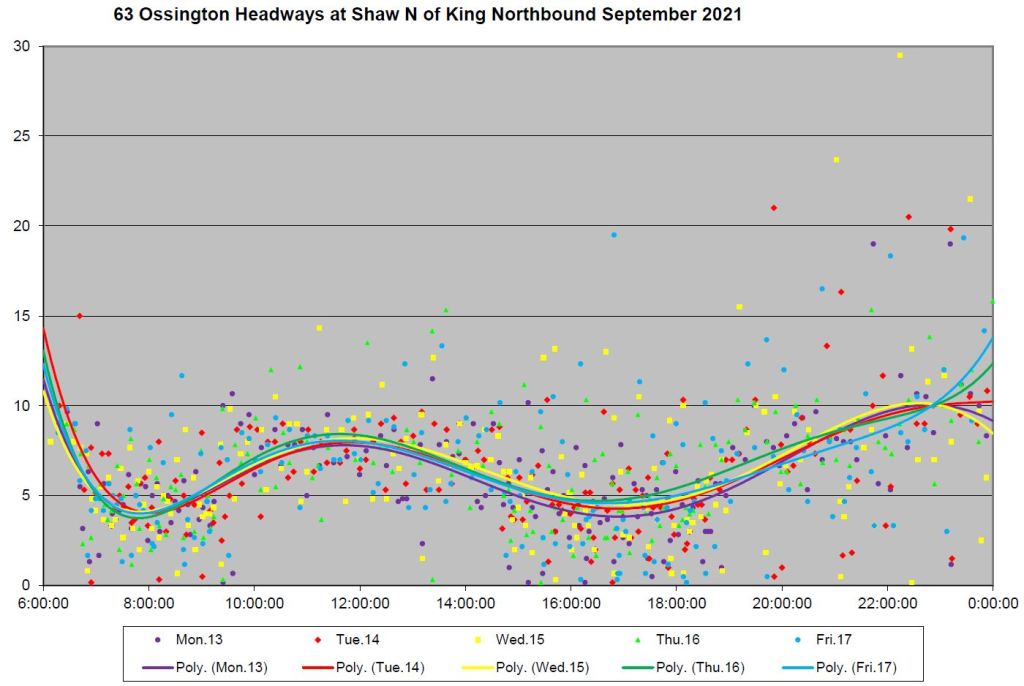
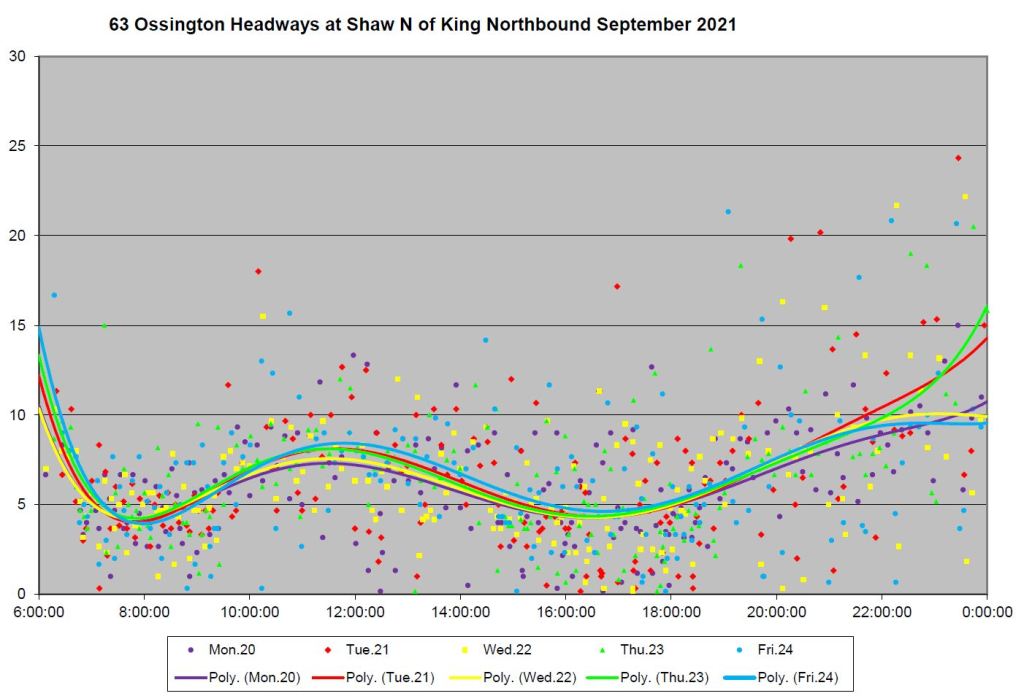
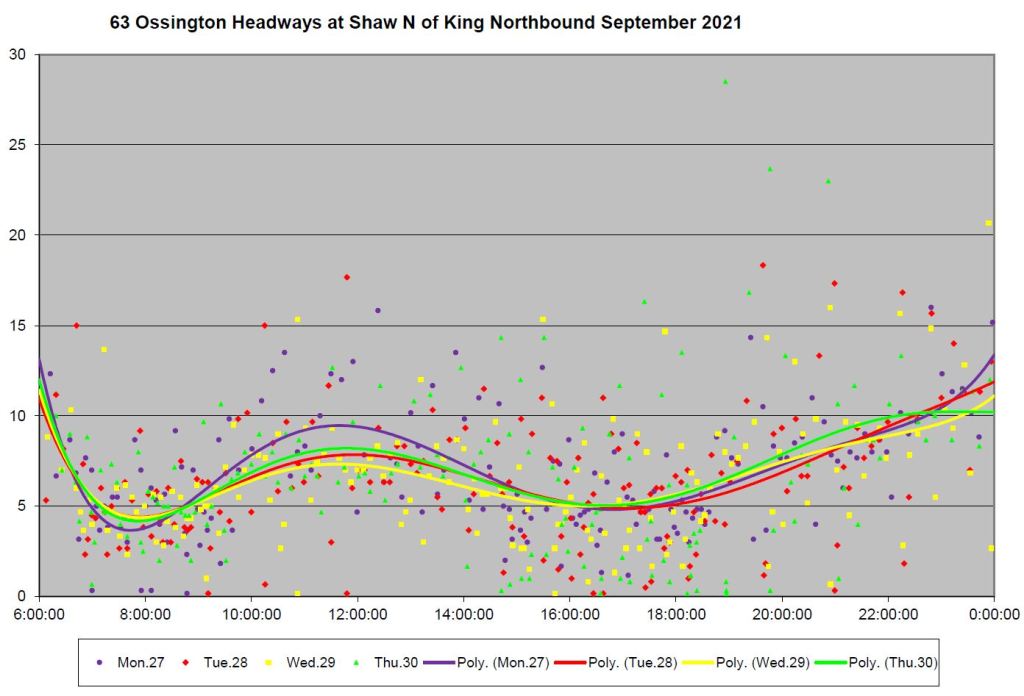
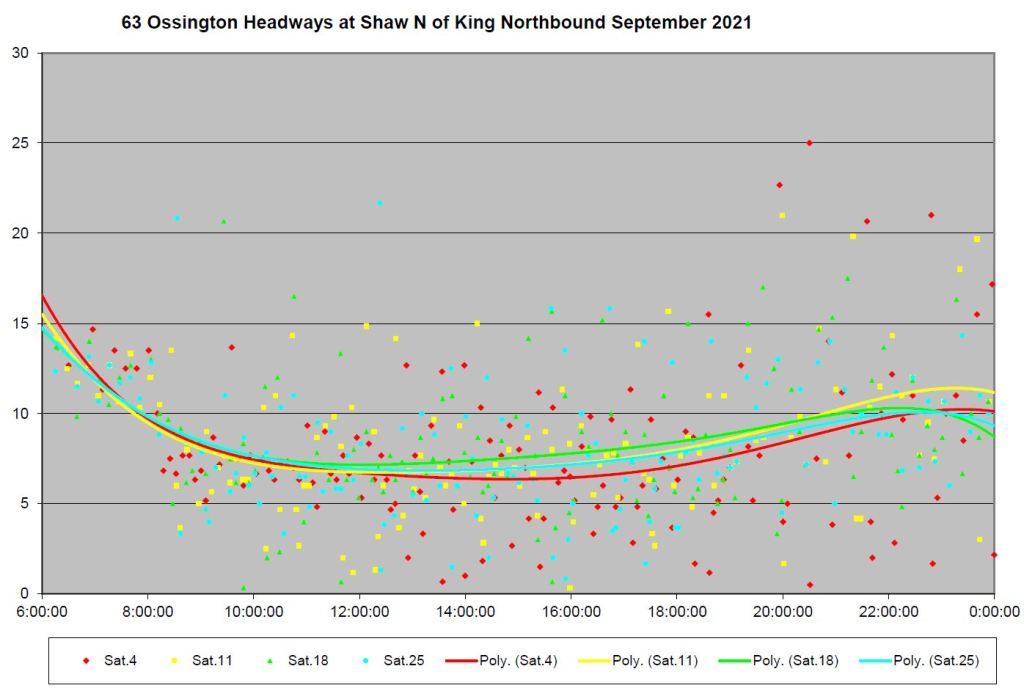
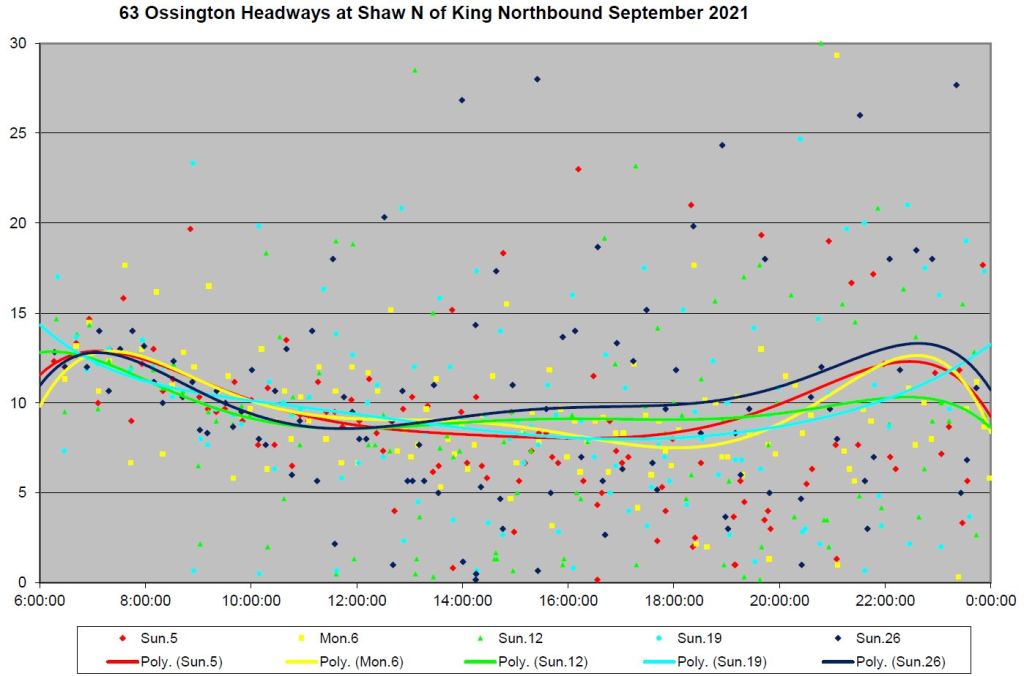
Northbound from King
At the south end of the route, buses operate around a long on-street loop through Liberty Village. Their typical layover point is on Atlantic Avenue northbound south of King Street. The screenline used for these analyses is on Shaw Street just north of King where the loop begins.
The weekly headway summary and the week-by-week charts show the schedule change with the shape of the weekly averages and daily trendlines.
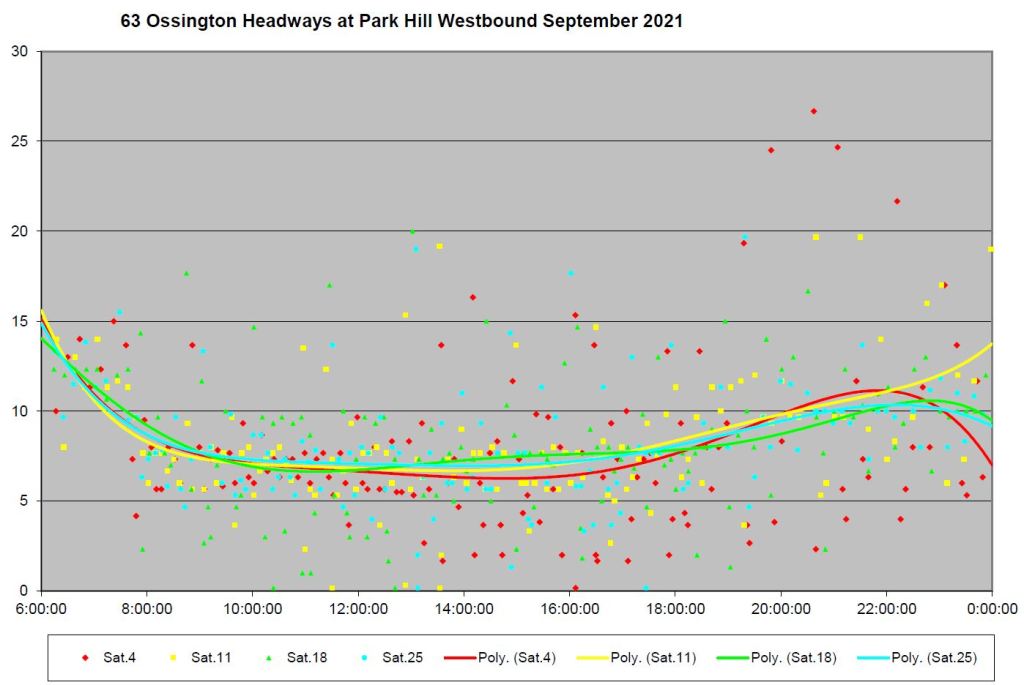
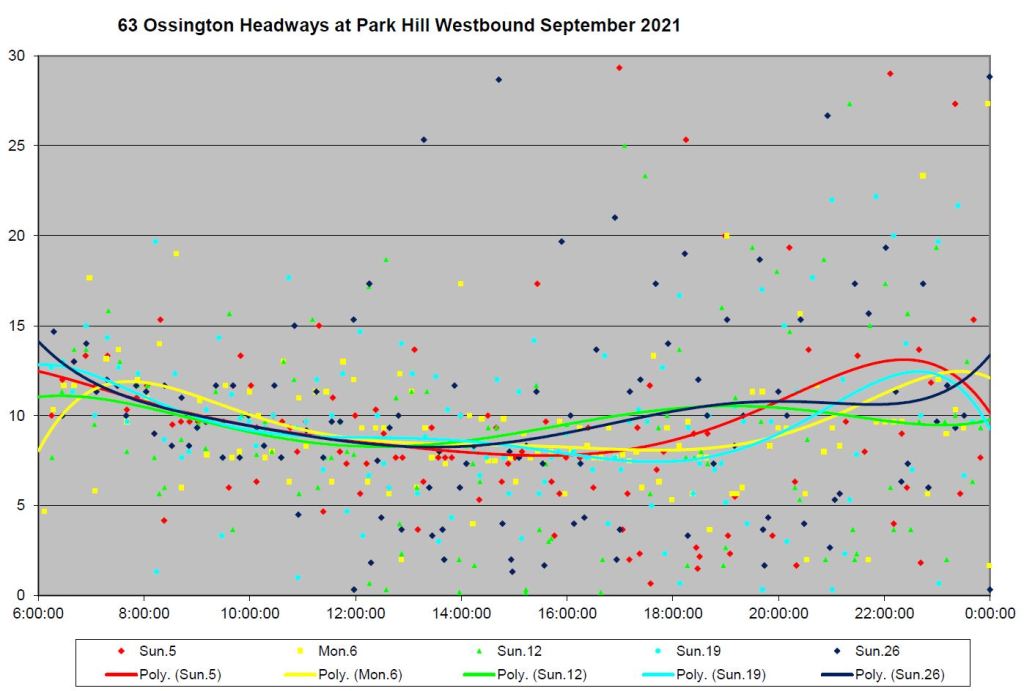
Weekend data points are far more spread out than weekdays showing a very different approach to service management (assuming that there is any) especially on Sundays.
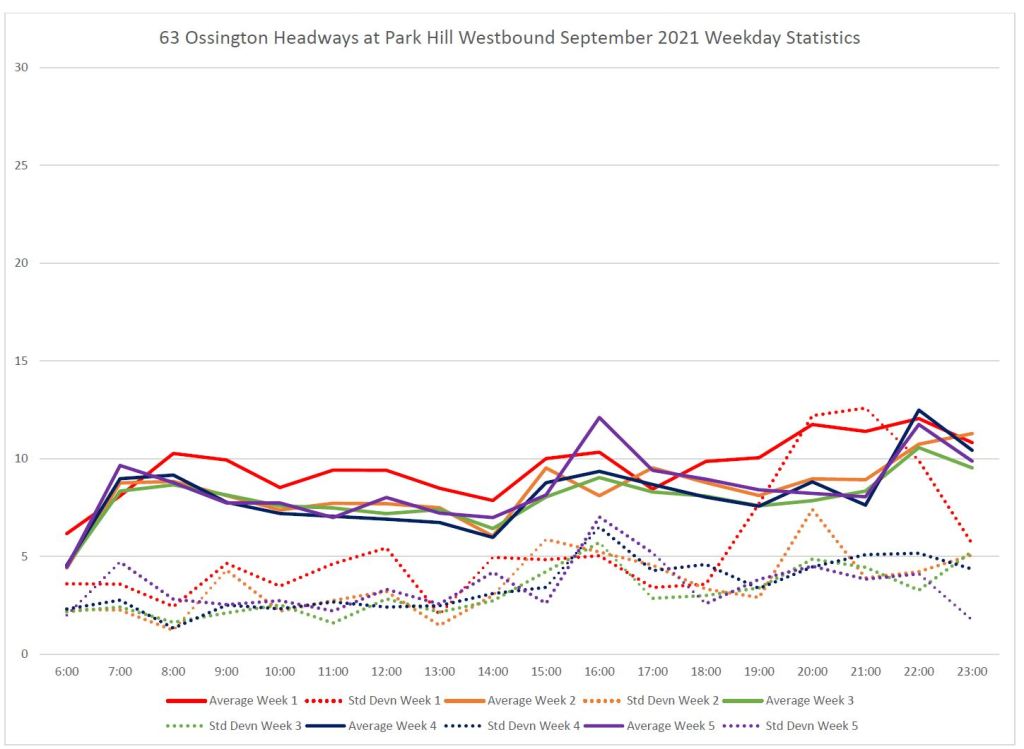
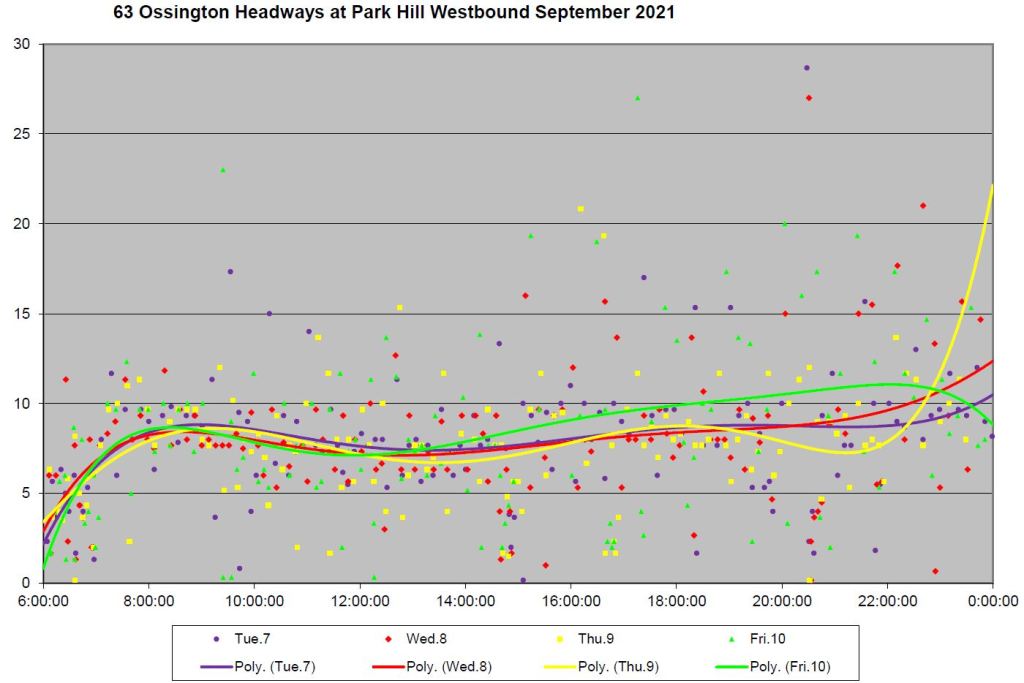
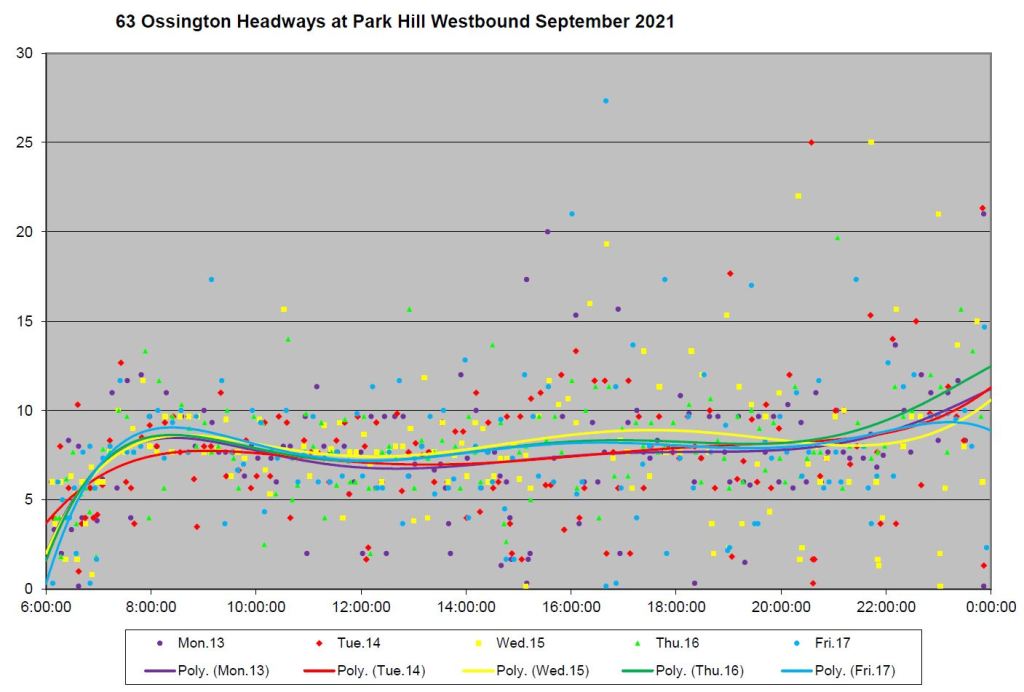
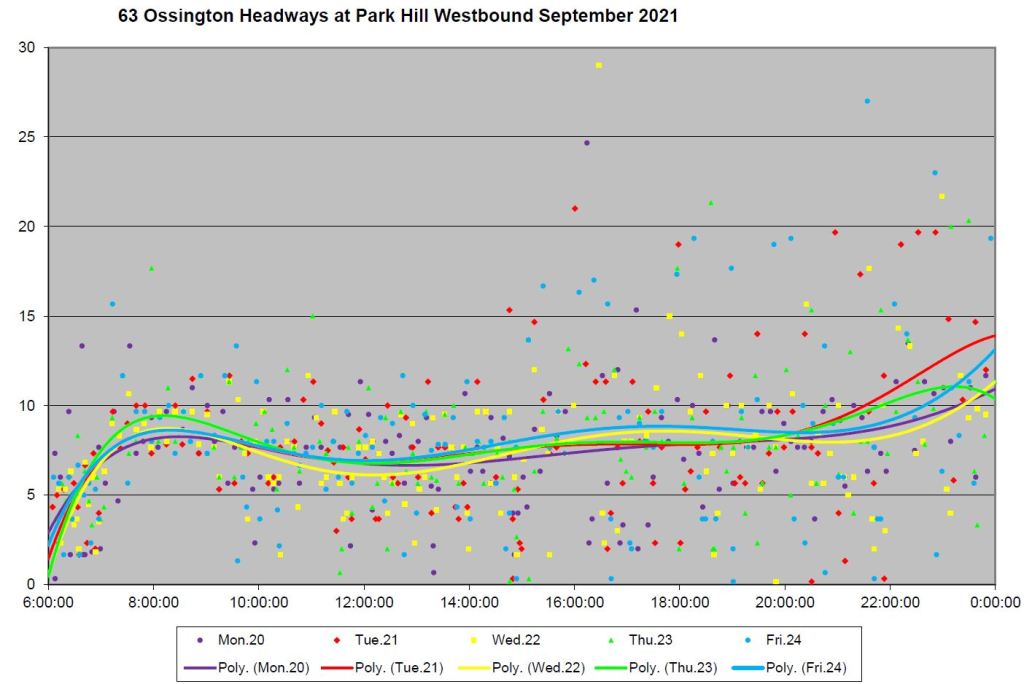
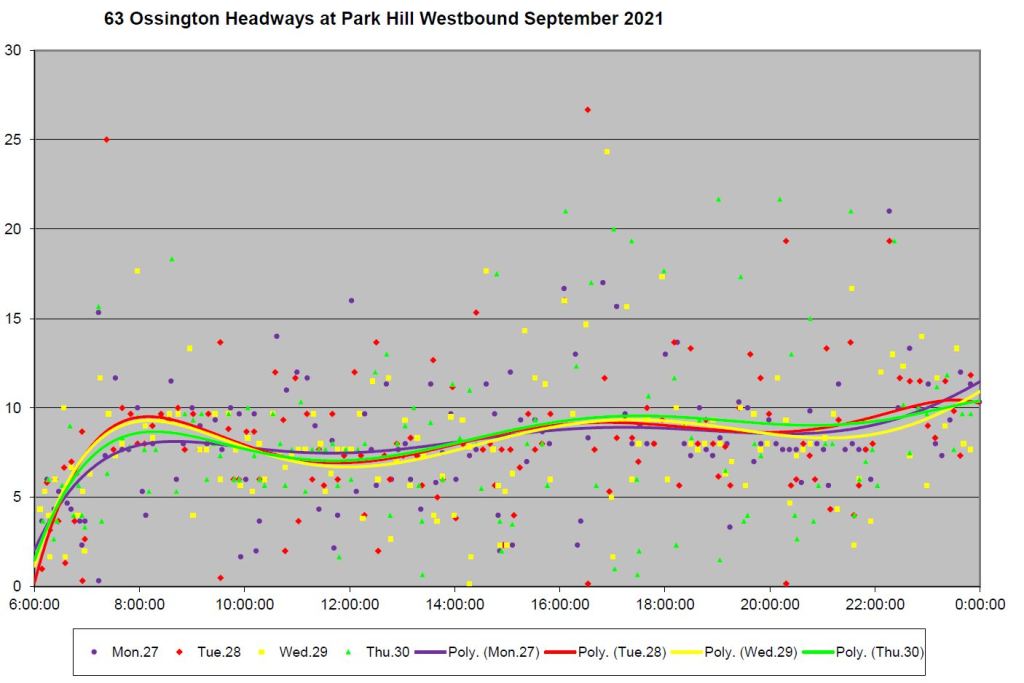
Southbound From Eglinton West Station
The screenline for these charts is at Eglinton & Park Hill Road, just west of the Allen Expressway. By contrast with the data at the south end of the route, weekday headways here are more scattered, especially in week 1. The standard deviation of headways begins the day in most weeks at about 3 minutes, but rises in the afternoon and evening as service reliability declines. The SD values at Eglinton West are generally higher than at King reflecting the wider scatter in headway values.
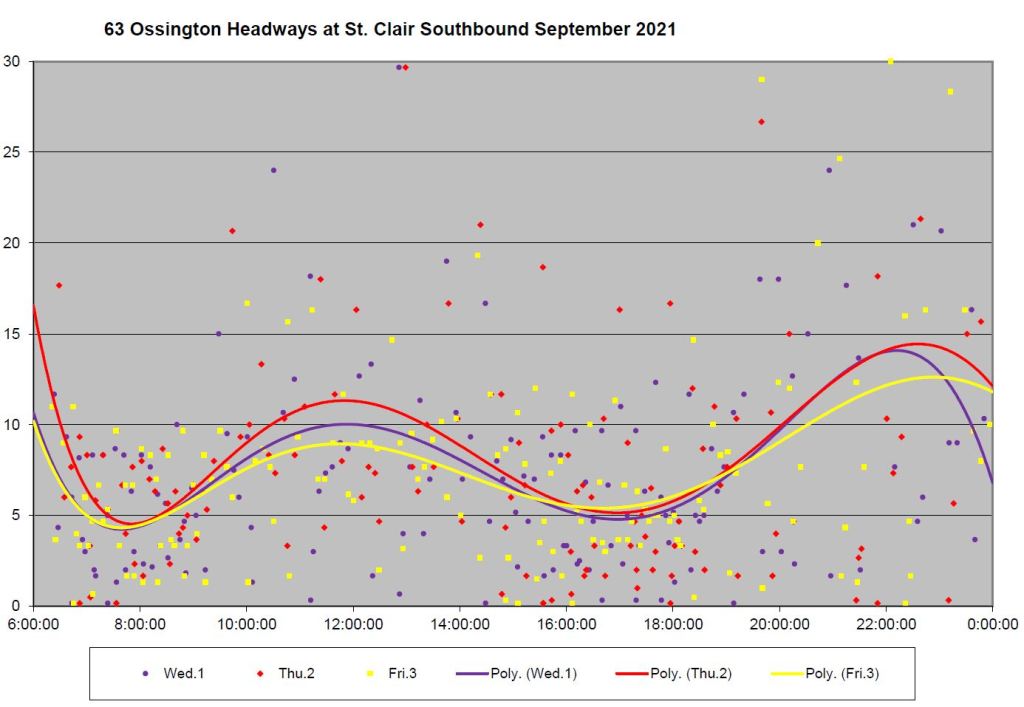
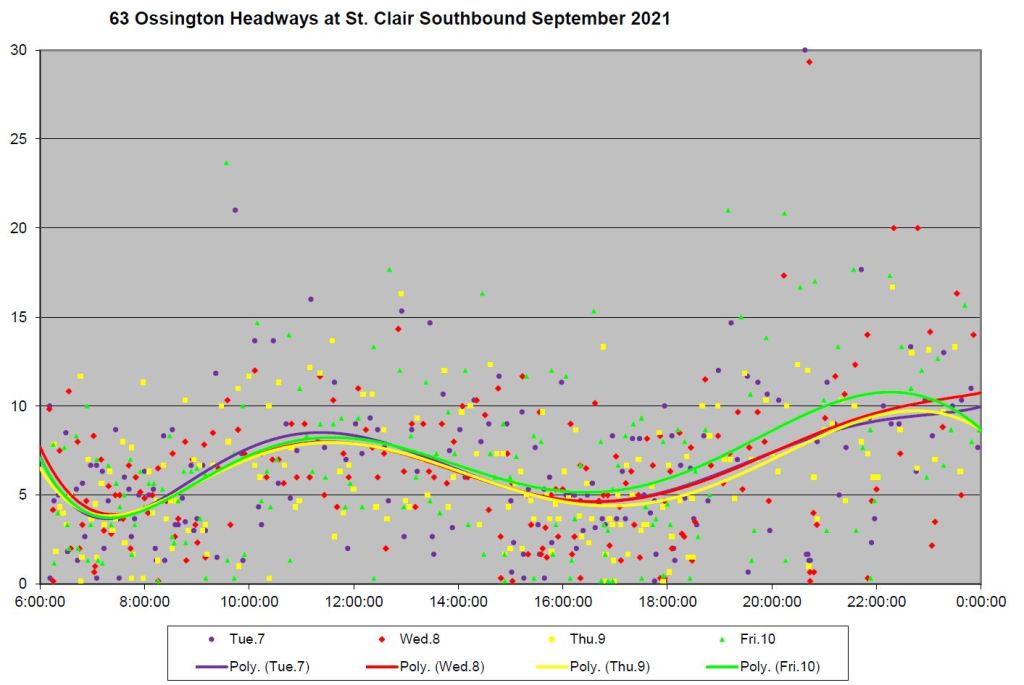
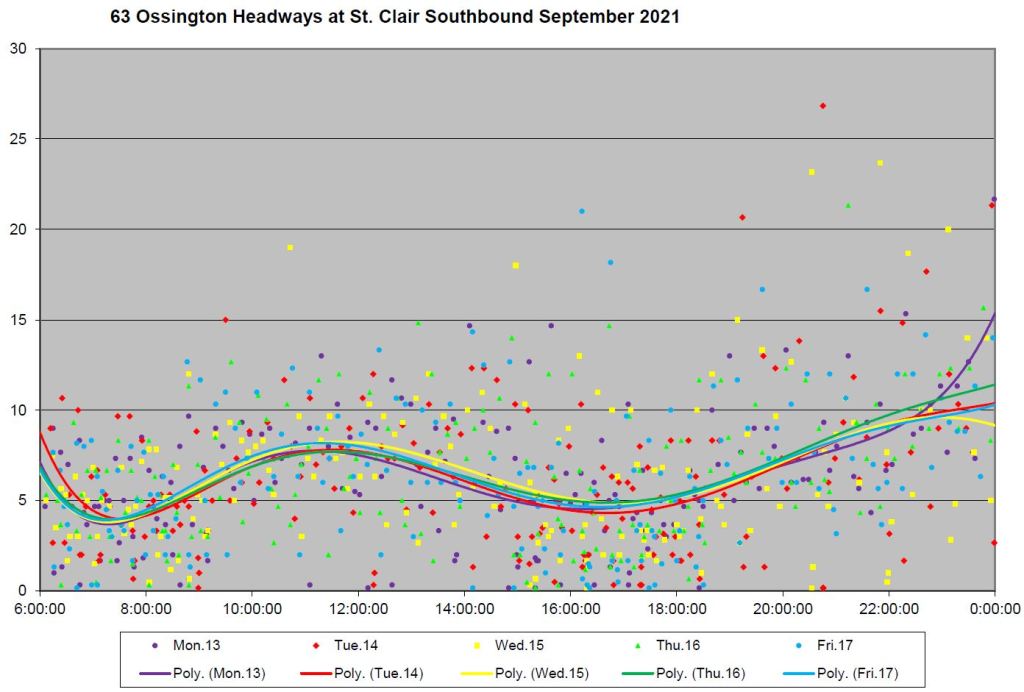
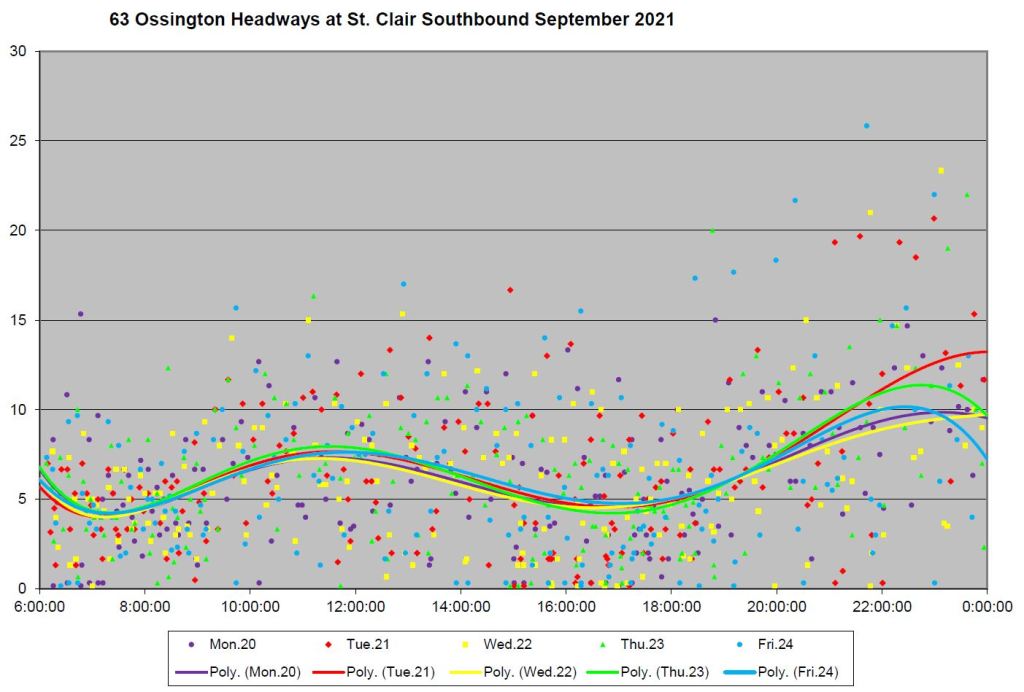
Southbound from St. Clair
These charts are included for weekdays to show the combined 63A and 63B peak service southbound from St. Clair. With all of the service present, the headways are shorter during peak periods, and far more of them are quite short indicating that buses from the two branches probably run in pairs a lot.
This article continues a series reviewing service on relatively short routes within the TTC network in areas where one might expect service reliability to be easily achieved.
Overview
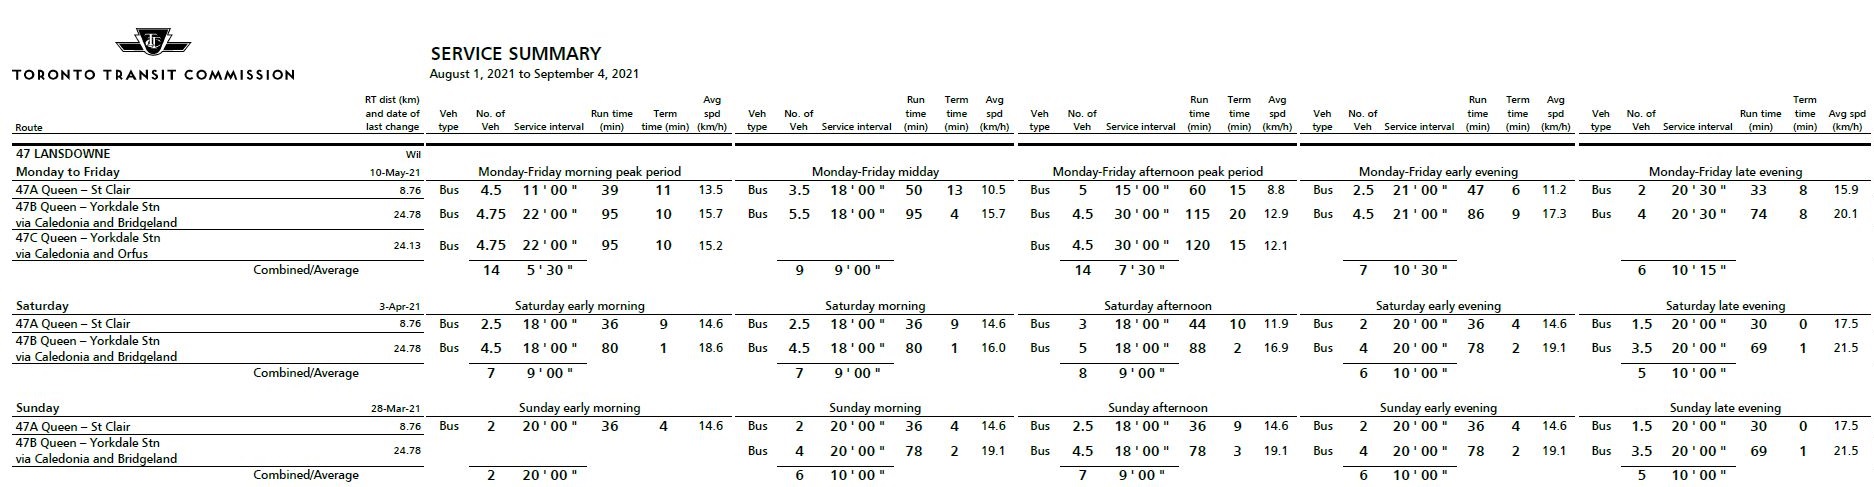
The southern part of the route lies between St. Clair and Queen Street. Every second bus continues north to Yorkdale Station on what was once a separate 18 Caledonia route. (These routes will be split apart at Caledonia Station in 2022 when Line 5 Crosstown opens.) During peak periods, the Yorkdale branch splits at the north end with an alternate route via Orfus to Yorkdale Station.
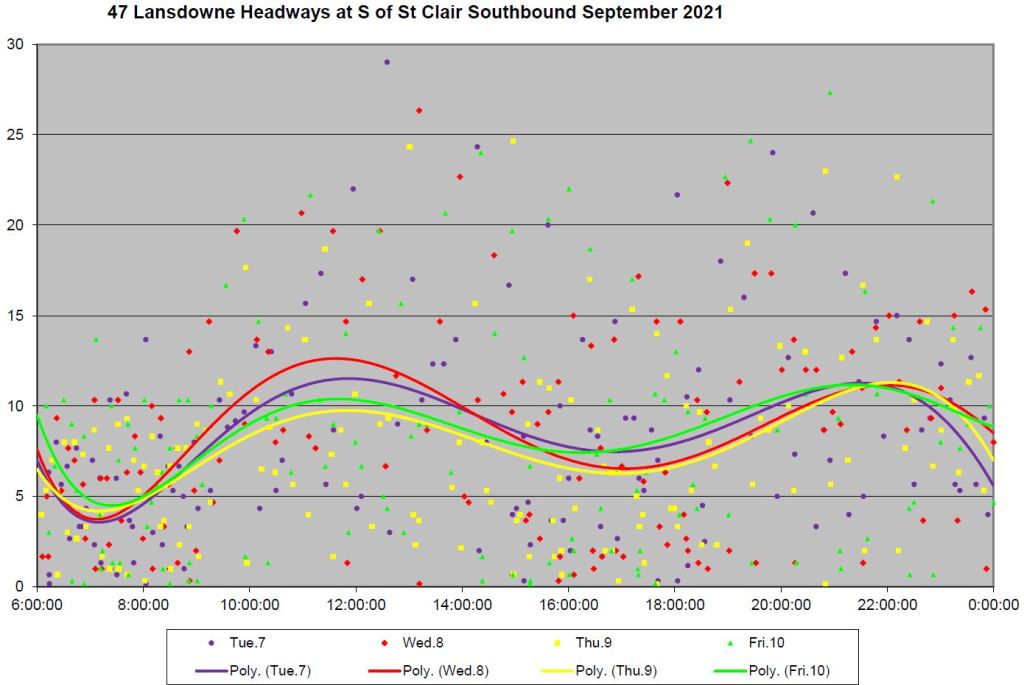
In addition to the type of problems shown in the previous articles on 22 Coxwell, 47 Lansdowne suffers from having what should be a blended frequent service on the common portion of the route. However, headways are not reliable either from the point where the branches merge at St. Clair southbound, nor at Queen northbound, the route’s southern terminus.
This schedule was in effect from September 1 to 4.
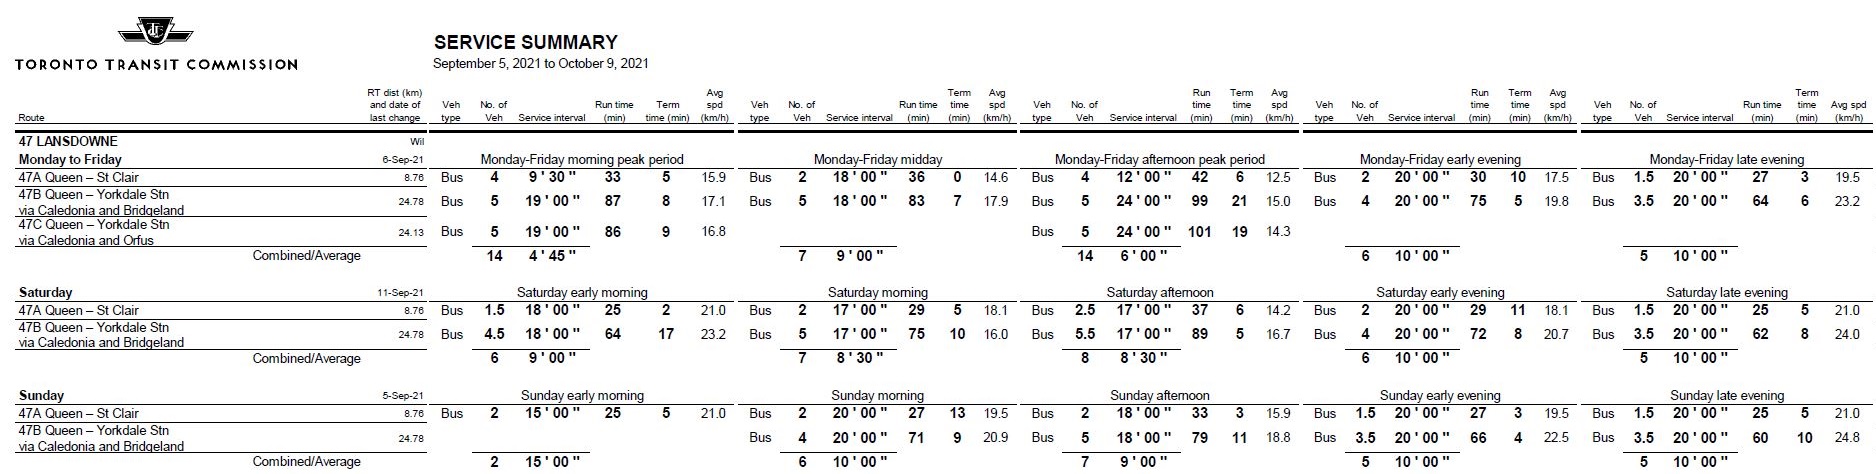
This is the schedule in effect from September 5 onward.
Change-offs, Breakdowns and Crew Changes
A common effect seen across the route is for a bus to disappear from service and, eventually, to be replaced by another in the same relative position.
In some cases, the same bus re-appears more or less where it disappeared indicating that it probably sat out of service awaiting a new operator.
In some cases, notably early in the day, a bus will remain in service for one trip or less, and then disappear. This implies that the bus was somehow faulty rather taken out of service because of a missed crew change.
In some cases, it is possible that a crew change is done by bringing a new bus into service from the garage replacing both the operator and the vehicle. This is not a scheduled event as can easily be seen by comparing operations on similar days (weekday to weekday, for example).
Where buses are missing for even a partial trip on a branch with a wide headway like the 47B Yorkdale service, the resulting gap can be very wide. These events are not reported as part of overall service quality and standards, just as bunching is not reported because it can often occur within the “approved standards” and their considerable margin for exceptions.
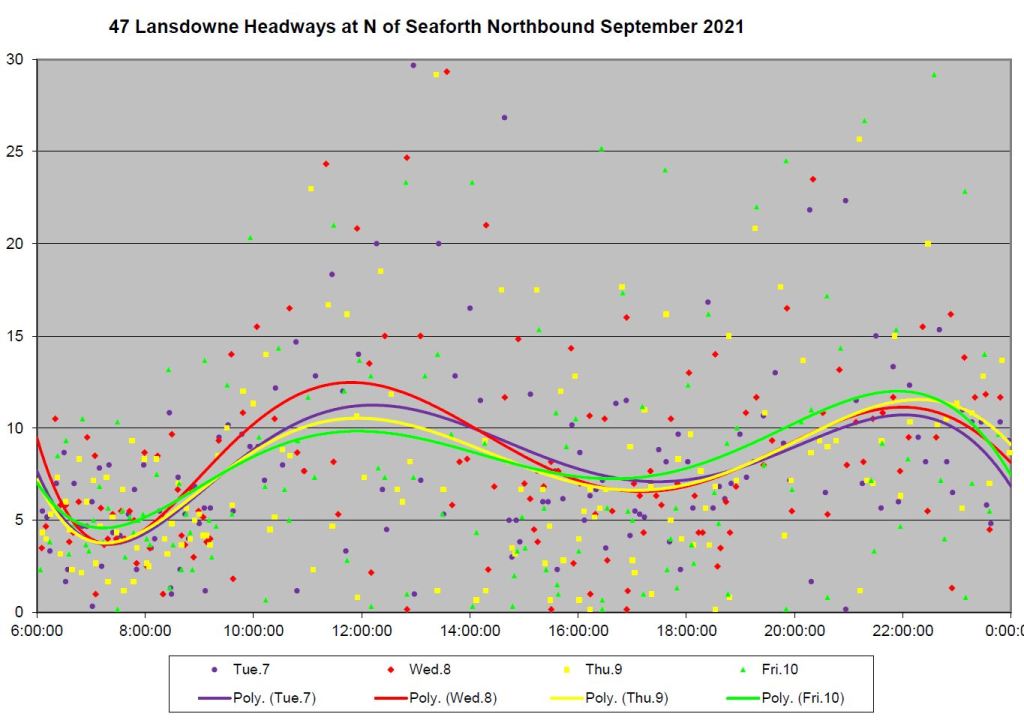
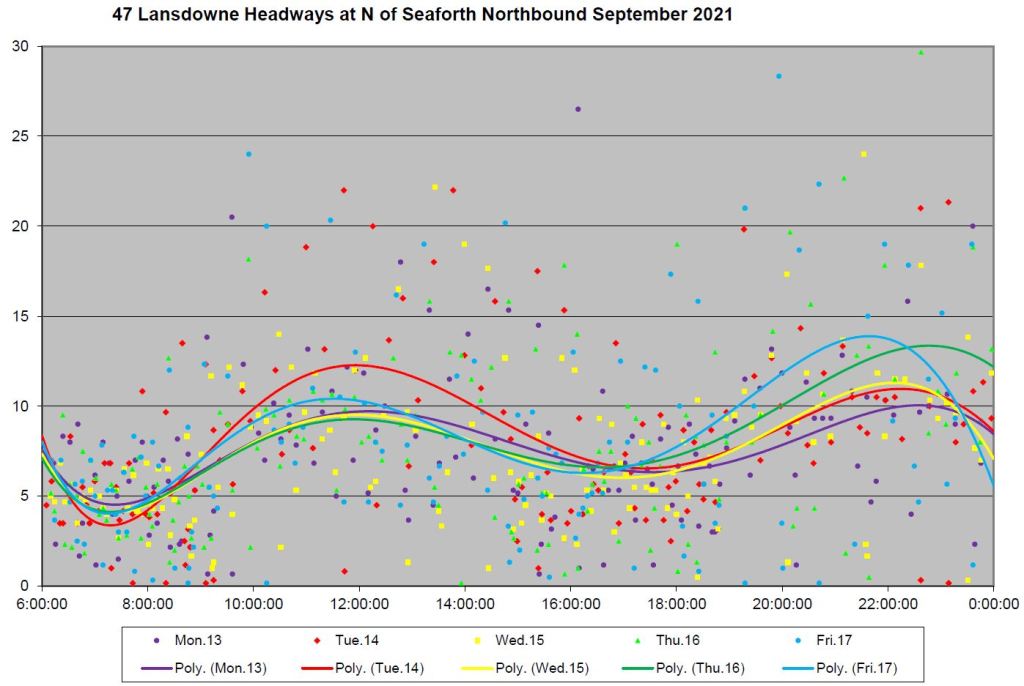
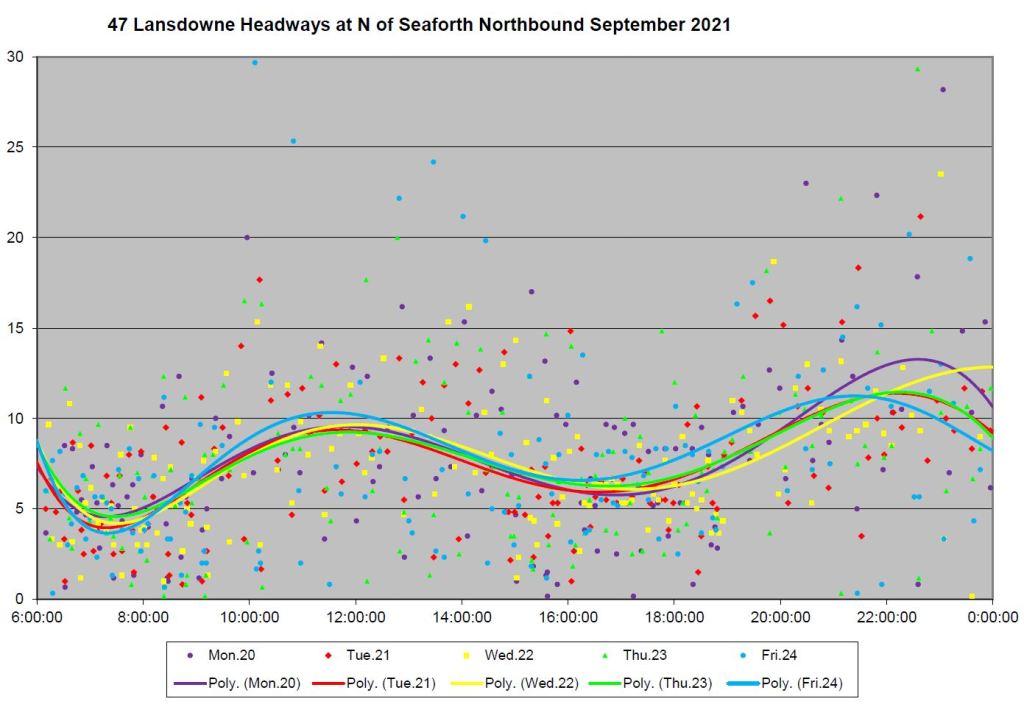
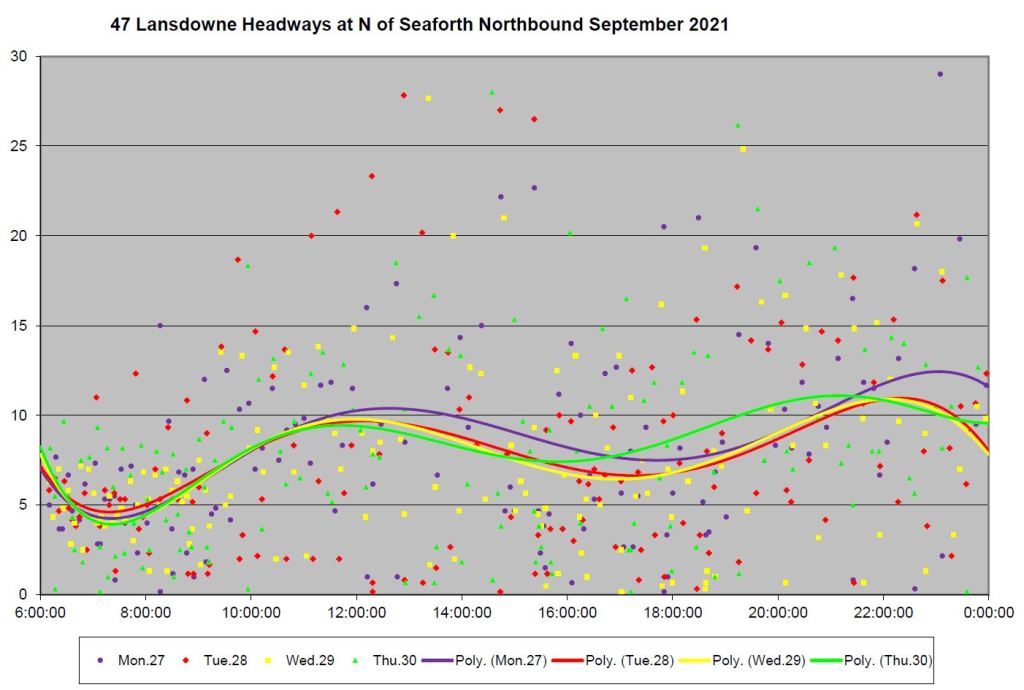
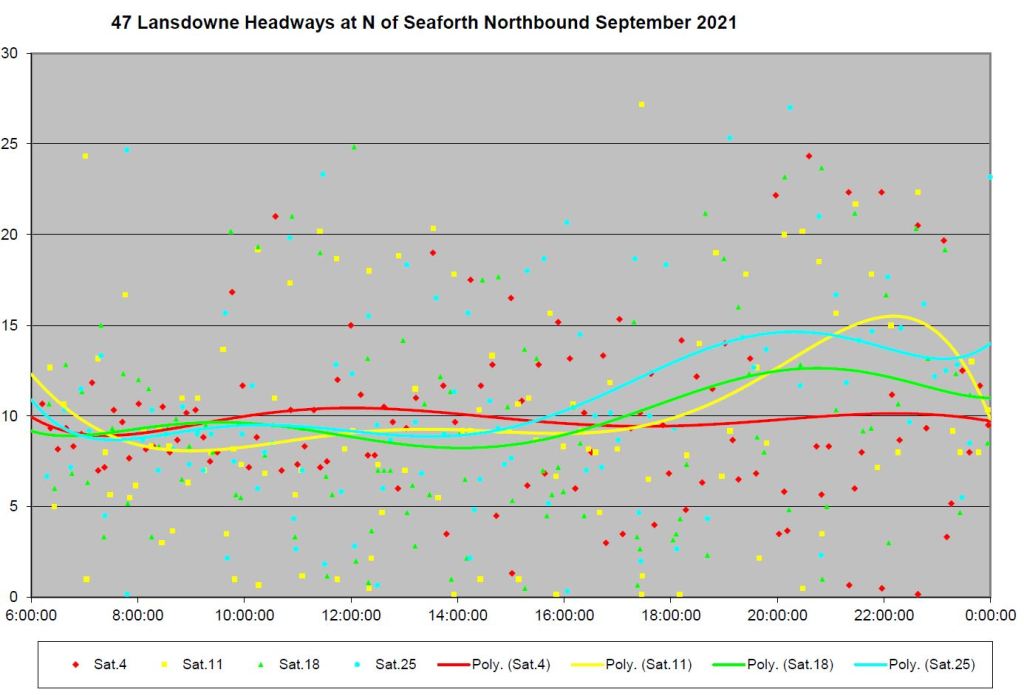
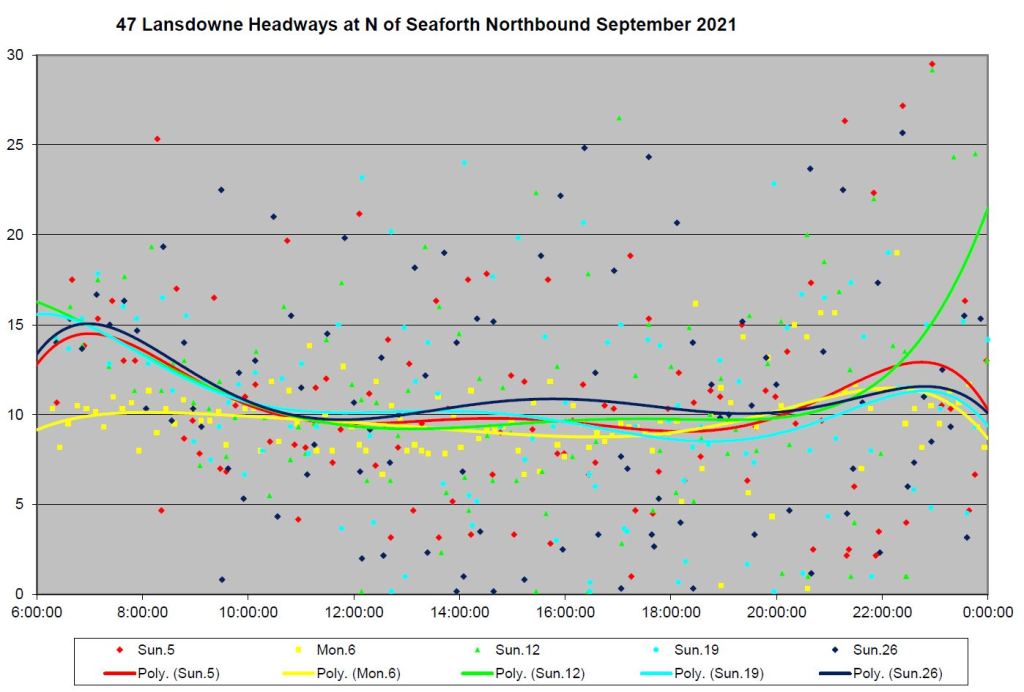
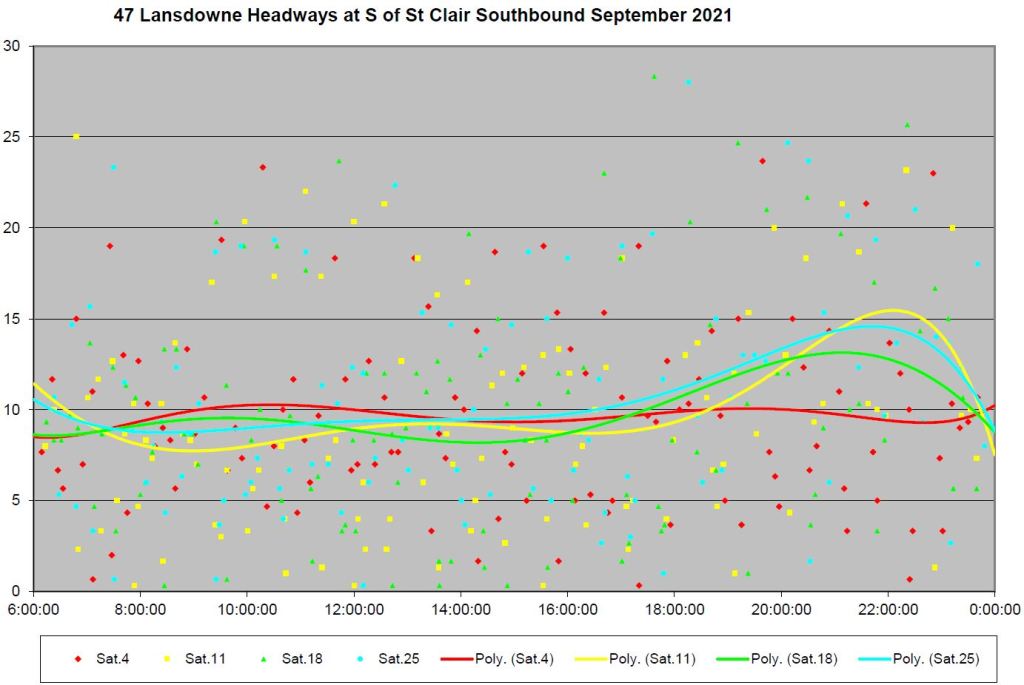
Northbound from Queen
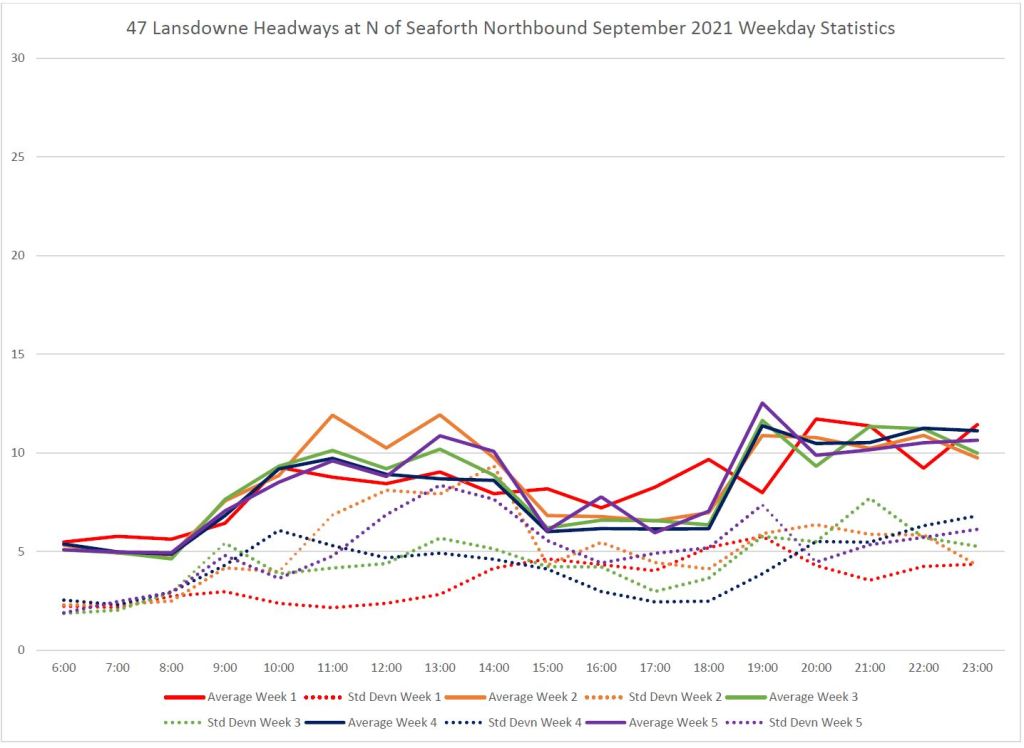
Headways from Queen are measured north of Seaforth, the north end of the on-street loop. The averages and standard deviations of headways are well-behaved only for the first few hours of the day, and they deteriorate from 9am onward. There is considerable difference in values from week to week.
Note that because of the schedule change on the Labour Day weekend, the shape of the trendlines in week 1 of these charts are different than in weeks 2 to 5.
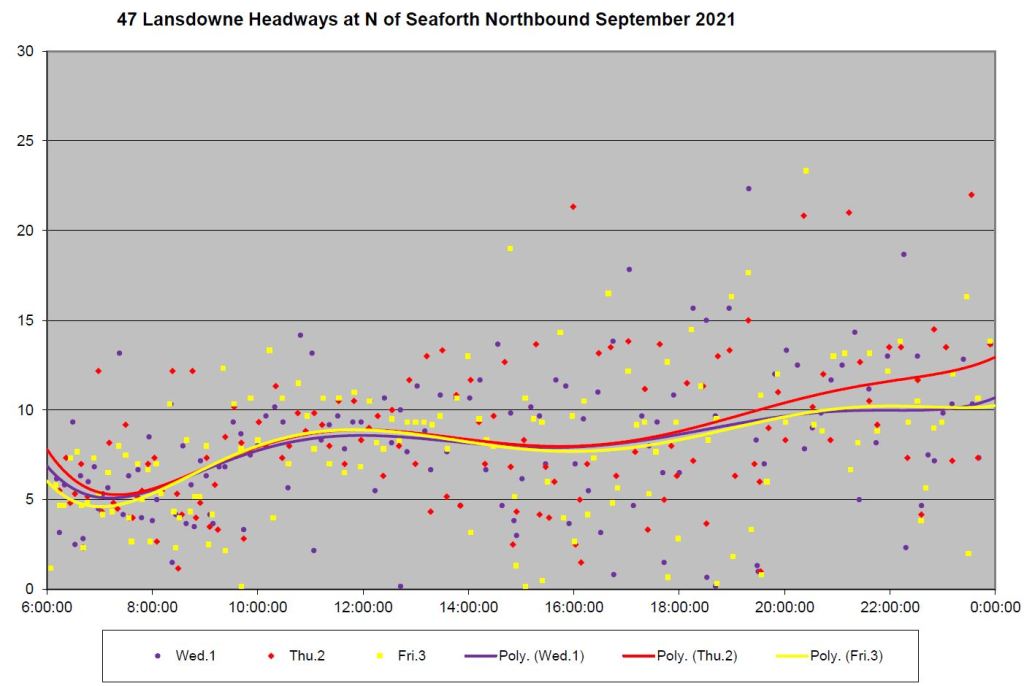
The clouds of data points span a range above 15 minutes for most of the day. This corresponds to the point where the standard deviation values rise after the am peak period. There are so many days with very short headways that I will not review each one in detail here, but give a sample. Days with very wide headways are of particular interest because this typically indicates either that buses are missing, or that bunching of more than two vehicles occurs.
This set of charts is particularly important because it shows the service at a terminal before the effects of passenger loads or congestion could disrupt service. This is also, as of September 5, a new set of schedules where any problems with the schedule itself should have been resolved. If anything, the service is worse in weeks 2 to 5 than in week 1, although this could be due to other factors.
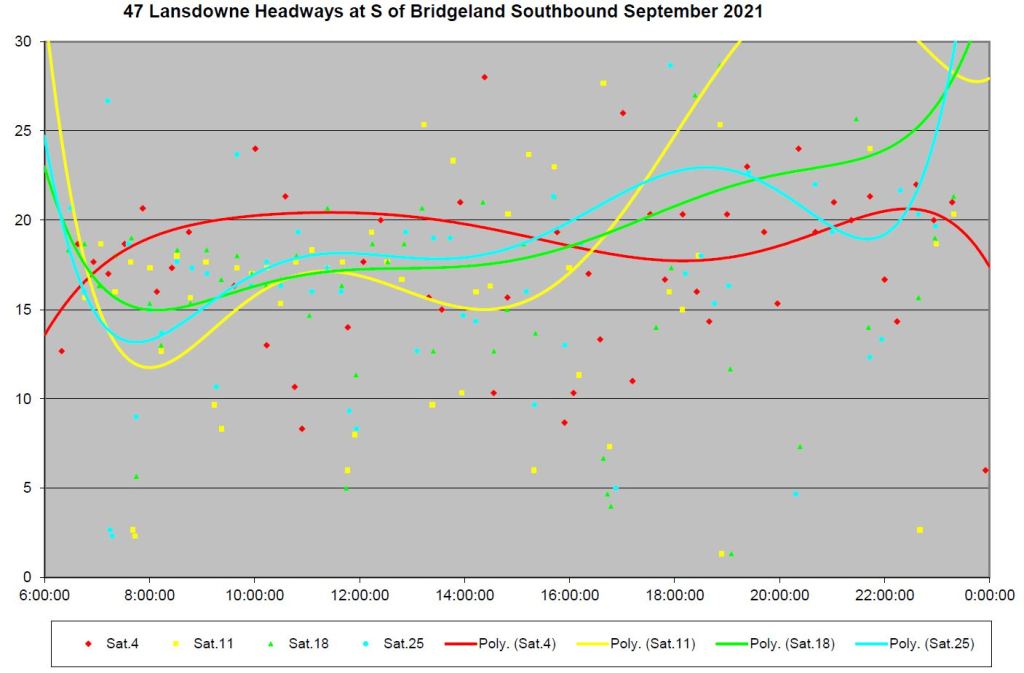
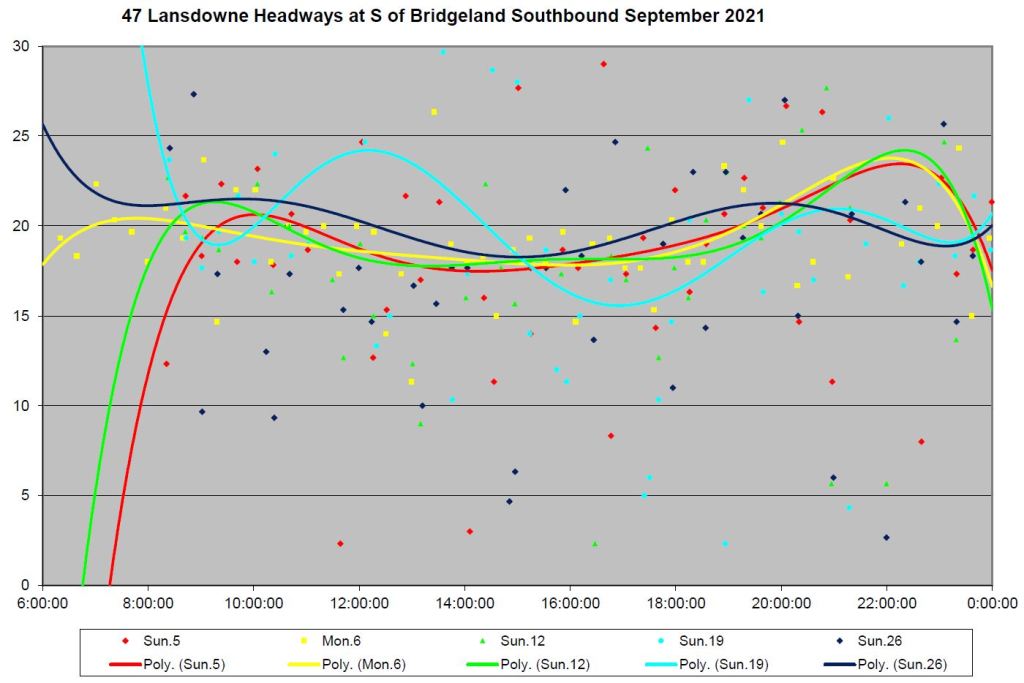
Saturdays show bad bunching and gapping throughout the month. Sundays also show very erratic service except, oddly enough, on Labour Day (an honourary Sunday for these charts) when headways lie much closer around the trend line.
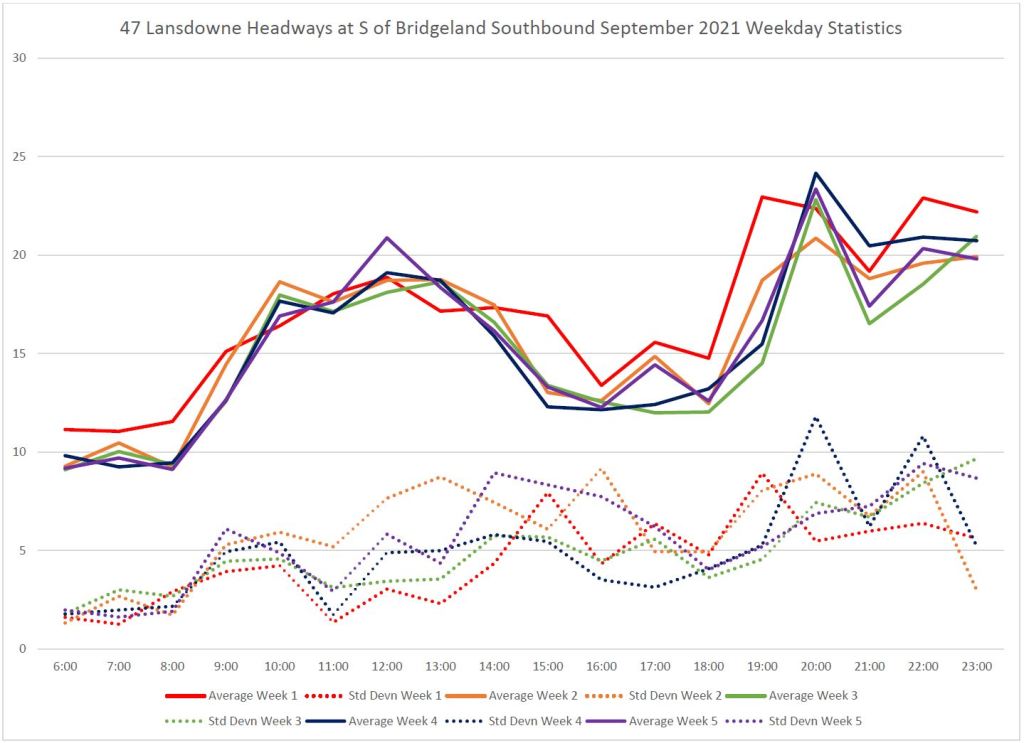
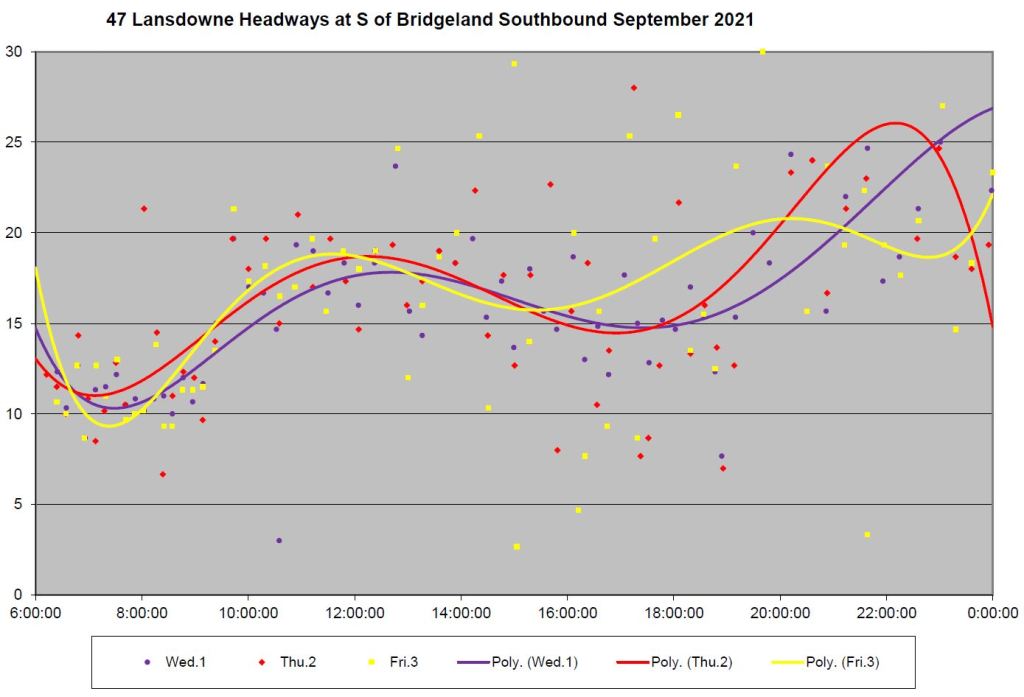
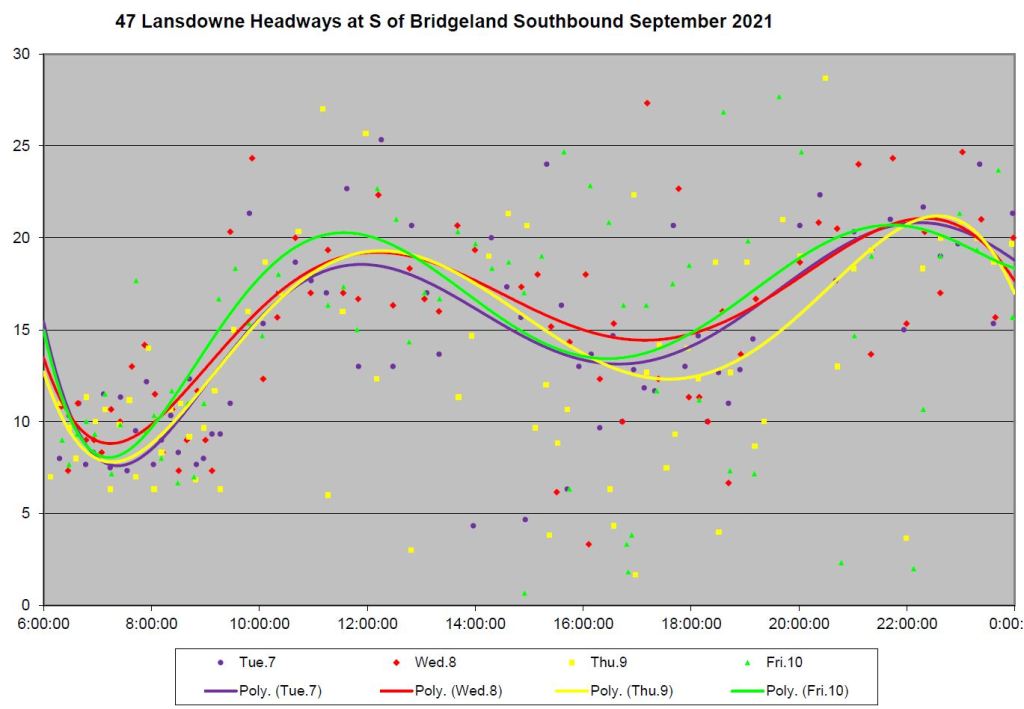
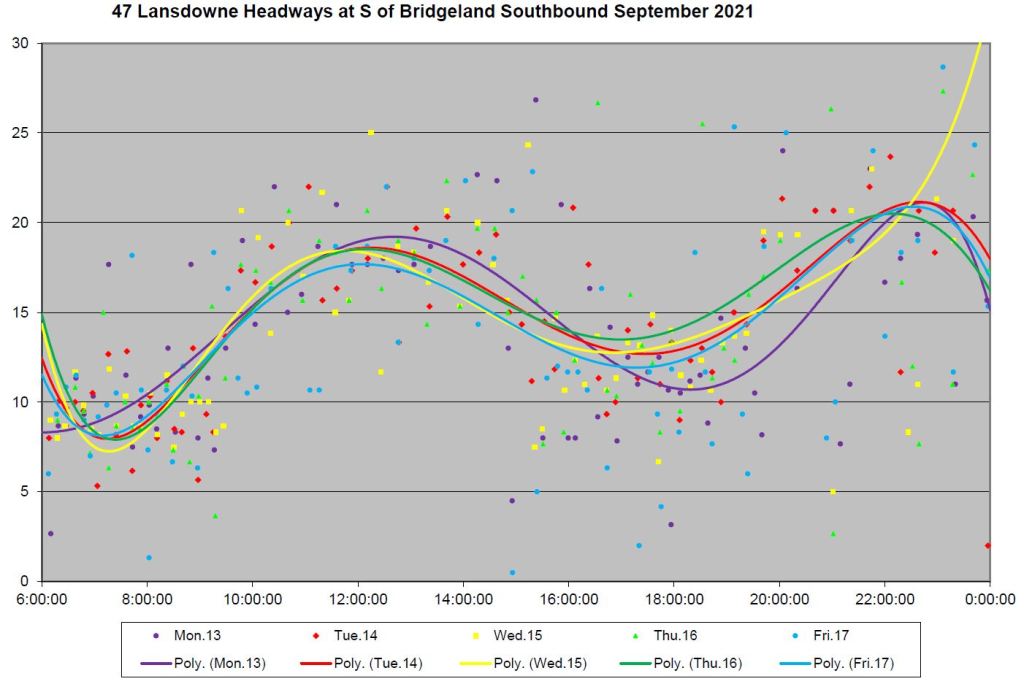
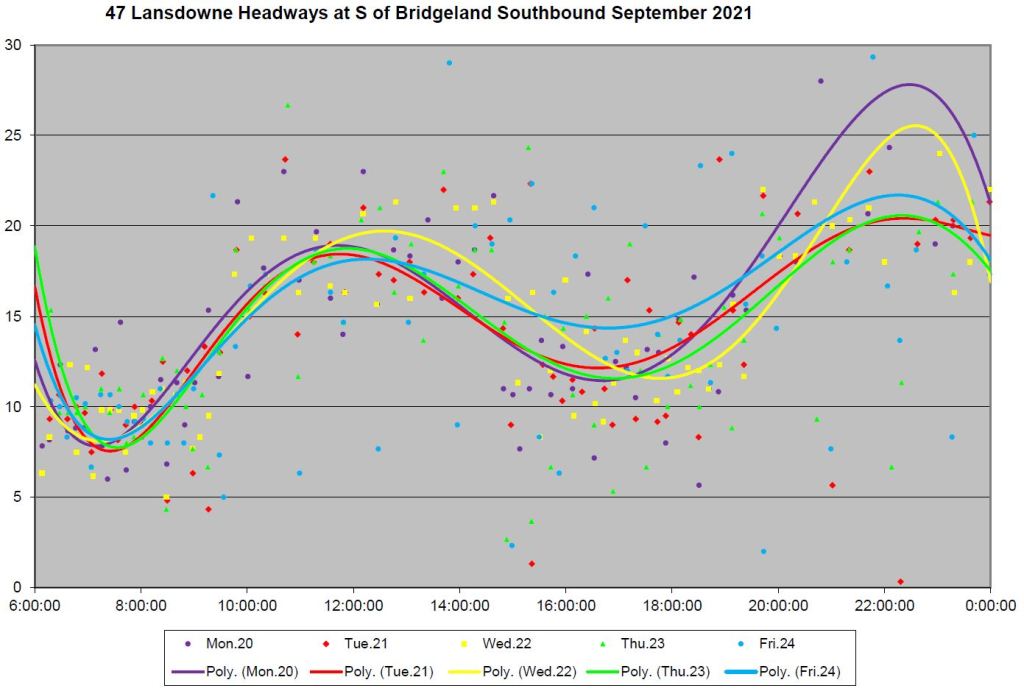
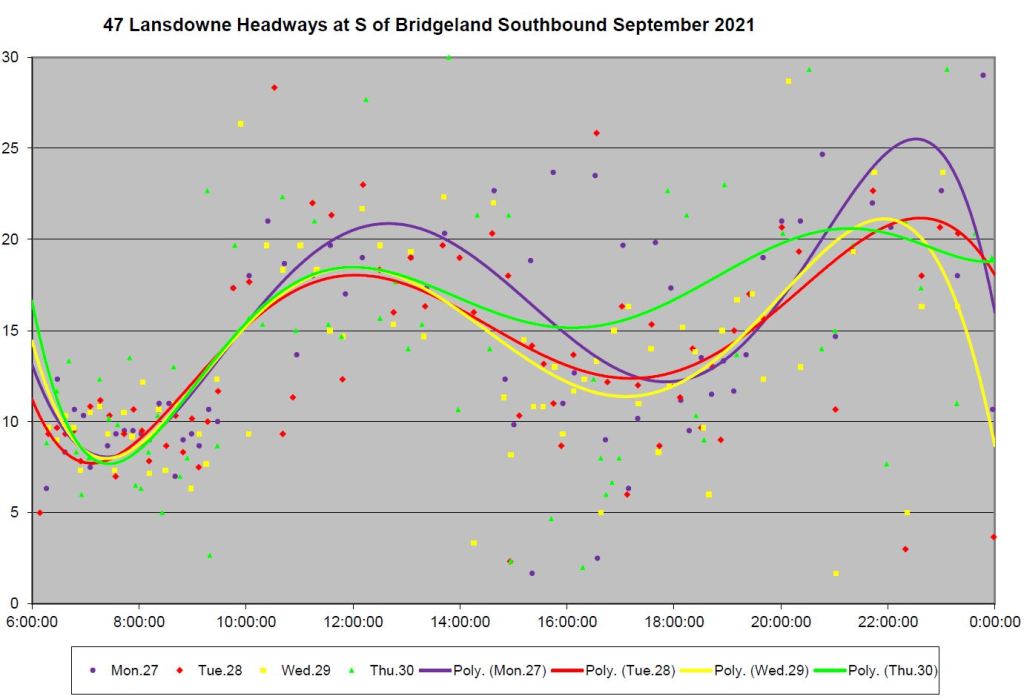
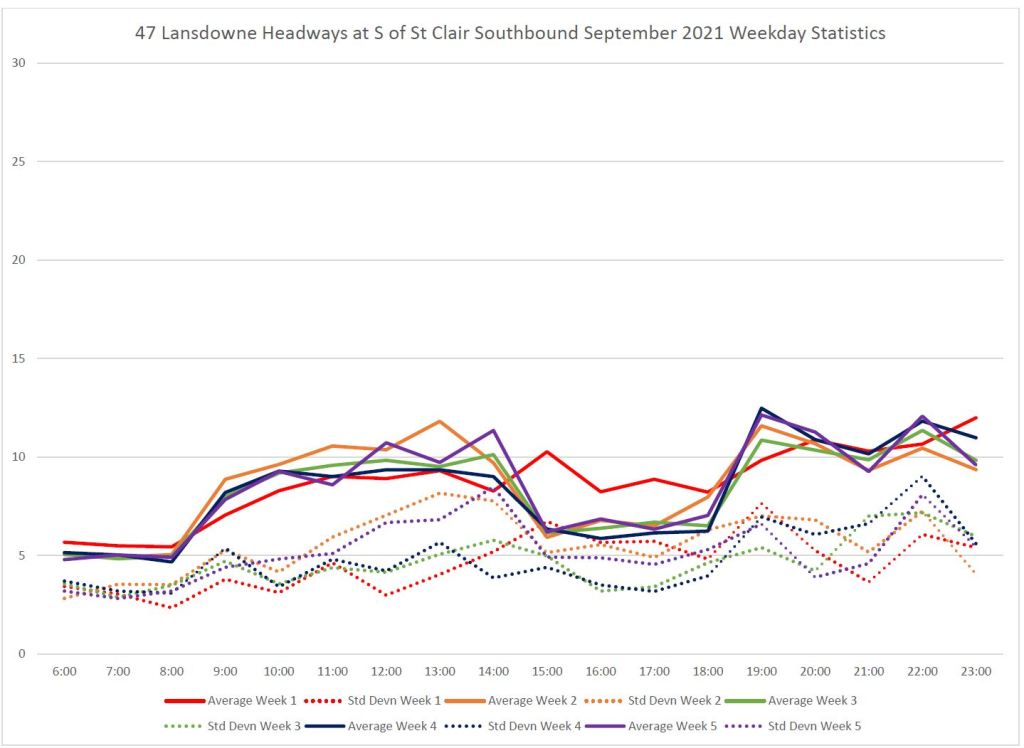
The screenline for these charts is on Caledonia south of Bridgeland where route turns east to serve Yorkdale Station. As above, the shape of the week 1 chart differs from other weeks because of the schedule change.
Only half of the service reaches this point because of the 47A scheduled turnback at St. Clair. As at other locations, the SD values are high, but they are particularly so thanks to the wide scheduled headways and greater dispersion of data values. Weekend service is particularly unreliable with headways ranging over a wide span.
Note that some values go above the Y-axis cutoff, that is to say above half an hour.
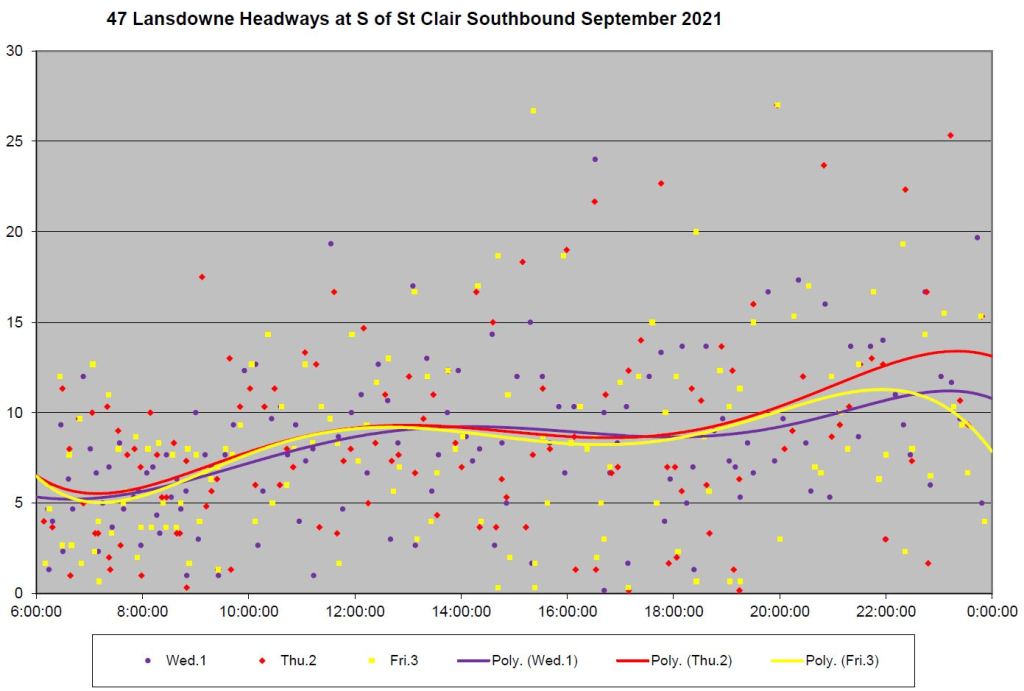
Service at St. Clair includes both the 47A buses originating at Earlscourt Loop and the 47B/C service from Yorkdale via Caledonia. The SD values are typical of a midroute location where branching services “merge” with little regard for each other. The clouds of headway values are spread over a wide range with values far from the average/scheduled service.
A common theme in these pages is the TTC’s constant problem with providing reliable service. Many problematic routes lie outside of the core on long east-west routes that must deal with varying traffic conditions, the difficulties of blending branched services, and a faster return of demand and post-pandemic traffic levels than in the central area.
These are not excuses for poor service, but at least represent some of the challenges faced. This is not true for short routes primarily in the old City. For these routes, a trip between Eglinton and Lake Ontario is comparatively long, and some reach only a few kilometres from Line 2 Bloor-Danforth south.
They should be routes that run like a clock, but they suffer many problems seen on their longer cousins outside of the core. If the TTC cannot operate these reliably, how can we expect them to fare with behemoths like east-west routes on Lawrence or Finch, or routes from Line 2 north to Steeles and beyond?
This article is an introduction to a series that will examine service on:
A factor among many of these routes is that service is not particularly frequent. If there is a bus missing, or pack of buses running together (effectively the same thing), the gap is wide. The added waiting time (assuming a rider bothers) can be greater than the time they will spend riding from point “A” to “B” on the route. Waiting times hurt transit because riders see them as unproductive, and this can be compounded by uncertainty about the next bus’s arrival and capacity.
Here is an overview of service frequencies on these routes during selected periods. Some of these have 10 minute or better service during some periods, but many do not.
In some cases, pairs of buses run together over the course of two or more trips indicating that there is no effort made to evenly space service.
For branching services, buses on each branch do not blend evenly where the branches combine.
In the worst case situations, all of the vehicles on the route are running as a pack.
Buses missing from service, with the remaining buses not spaced to account for the gap. In some cases, a route is served by only one bus when there should be two or three.
Missing buses are most common during evening and weekend periods when spare operators are harder to come by, in part because many of the “run as directed” operators are used for subway replacement services. Because TTC has fewer operators than crews in some cases, there are open crews that are only filled if there is a spare operator available.
Although the TTC has standards defining what constitutes acceptable service, almost none of these address the problems listed above. That is because:
Buses can be running close together but still be “on time” according to the service standard.
There is no standard that addresses gaps and bunching explicitly.
There is a standard related to missed trips, but no statistics have ever been reported for it.
The standards accept a wide range of exceptions with a goal of achieving targets only 60% of the time. There is no reporting of the proportion of service lying outside the standard even if it would be within the target.
There is no co-relation of vehicle crowding with service reliability.
To put it quite bluntly, these so-called standards allow management to claim to operate the system to “Board approved” targets, even though the TTC Board members probably have no idea of just how lax these standards actually are.
In turn, when riders complain, they are often told that the service is operating within standards, and that where there are problems, “run as directed” buses are dispatched to fill the gaps. This is simply not possible because there are not enough RAD buses to fill all of the holes in the service. Moreover, the TTC does not track or report on the usage of these buses to establish that they really do provide the benefits claimed for them.
TTC management hopes to lure riders back to buses, but the single most common complaint is that more service is needed. Part of “more” service involves simply running what is already there better. There is no point in advertising frequent service if what is actually on the street is anything but.
When they were approved, there was a staff presentation that set out the standards but did not actually explain what they might allow. The Board nodded in approval of something technical that looked impressive, but was clearly beyond their ken. The old Razzle-Dazzle works every time.
This article continues a review of the 22 Coxwell bus with data from September 2021.
All of the problems seen in the analysis of August 2021 data are here: gaps and bunching, missing buses, and an overall lack of service quality for extended periods.
This is the first of a series of articles reviewing service quality on short routes. A fundamental problem across the TTC network is that service is unreliable with bunching, gaps, missing vehicles and crowding all contributing to making transit less attractive than it could be.
Many routes that get a lot of attention are quite long, and there is a raft of standard explanations for their problems. Traffic congestion and construction are chief among these, along with road accidents, ill passengers and “security” incidents. However, there are severe problems with service reliability on short routes where most of the standard explanations simply do not apply, and where the TTC should be able to maintain service like clockwork.
These routes are short enough that the source of problems is easily spotted in the tracking data for TTC buses. The two most common problems are:
Buses are missing from service probably because no operator is available to drive the vehicle, and a near-embargo on overtime leaves scheduled work unfilled.
Where buses are missing, service is not always adjusted on the fly by Transit Control to space out the remaining vehicles and the result is large gaps where missing vehicles should be.
Some operators simply prefer to drive in packs even though they are reasonably close to their schedules. At times, pairs (or worse) of vehicles will make multiple trips close together showing that there was no attempt to space service.
There is a distinctive difference between missing and bunched buses in the data.
Where a bus is missing, headways will widen either where that bus should have been, or overall if the remaining service is spaced out. Where buses are bunched, there will be corresponding short and long headways where two or three buses arrive together followed by gap much wider than the average headway.
In worst-case situations, which happen too often for comfort, most or all of the route’s buses run together in a convoy. These are eventually broken apart, but the convoy should not have been allowed to develop in the first place.
In brief, there are times when nobody is minding the store and riders suffer. In the two months of data reviewed here and in Part II to follow, these problems are not one-off instances, but repeated events.
On 22 Coxwell, the service on the weekday shuttle between Danforth and Queen is usually well-behaved, but come evenings and weekends when the route extends east via Kingston Road to Bingham Loop at Victoria Park, the service can be very erratic.
In this article, service will be shown at three locations:
Coxwell south of Danforth, southbound. This is the service shortly after it departs from Coxwell Station.
Coxwell north of Queen, northbound. This is the daytime service shortly after it departs Eastern Avenue for the trip north. On weekends and evenings, this is a mid-point of the route.
Kingston Road west of Bingham, westbound. This is the evening and weekend service after it leaves the eastern terminal.
To save space, the charts are presented as galleries which readers can open at any page and scroll back-and-forth to make comparisons. Full sets of charts, including illustrations not included in the body of the article, are linked as PDFs after each gallery.
In the text describing the charts tracking vehicle movements, I refer to buses by the colour of the line rather than the run number because this saves readers from having to translate via a legend. Each day’s colour allocations are independent of the others, and they occur in order of vehicle numbers in the underlying data. For example, the “pink” bus is a different run number each day depending on the vehicles assigned to the route.
For those who have not encountered these charts before, there is an introductory primer. For those who want to know how the underlying machinery to produce these analyses works, there is a detailed article about methodology.
From time to time, someone will tweet a complaint to @TTCHelps about a very long wait for a bus and copy me into the thread. This can set off an exchange which, to be diplomatic, can involve varying claims about what is actually happening.
For as long as anyone can remember, the TTC has a standard response to such complaints: that traffic congestion or some other transient event beyond their control is responsible. More recently a few new lines have been added to their repertoire including:
Due to inadequacies in the schedule, buses cannot stay on time, but this will all be fixed in a coming revision.
There are “run as directed” buses which are used to fill gaps in service and respond to problems of overcrowding. These buses are far less numerous than some at the TTC have claimed, and they are completely invisible to service tracking apps.
Riders concerned about crowding can refer to transit monitoring apps to see if an uncrowded bus is coming down the route. Of course if you’re on a streetcar, they don’t have passenger counters and there is no online crowding info for them, in spite of ads for this service up and down Spadina Avenue.
On top of this, the TTC produces monthly on time performance stats that purport to show that, overall, things are not too bad. They have “service standards” about what constitutes an appropriate quality of service, and they hit them to some degree some of the time, on average.
This is a long-standing response of “not our problem”, backed up by “we will fix the schedule eventually”, “we are meeting our standards most of the time”, and “riders can find uncrowded buses, so what’s the problem anyhow”.
This is cold comfort to riders waiting for service.
Problems of irregular service and crowding on the TTC predate the pandemic, and were starting to attract attention by the politicians who claim to set policy and could not square complaints from riders and constituents with management reports. Then the world changed.
But the world is trying to change back, and with it the desire for transit service to actually attract riders. The time is overdue for attention to quality of service as a basic marketing tool. A shop window does not attract customers with a photos of products that might arrive soon, maybe.
Bathurst Bus Scheduled Service
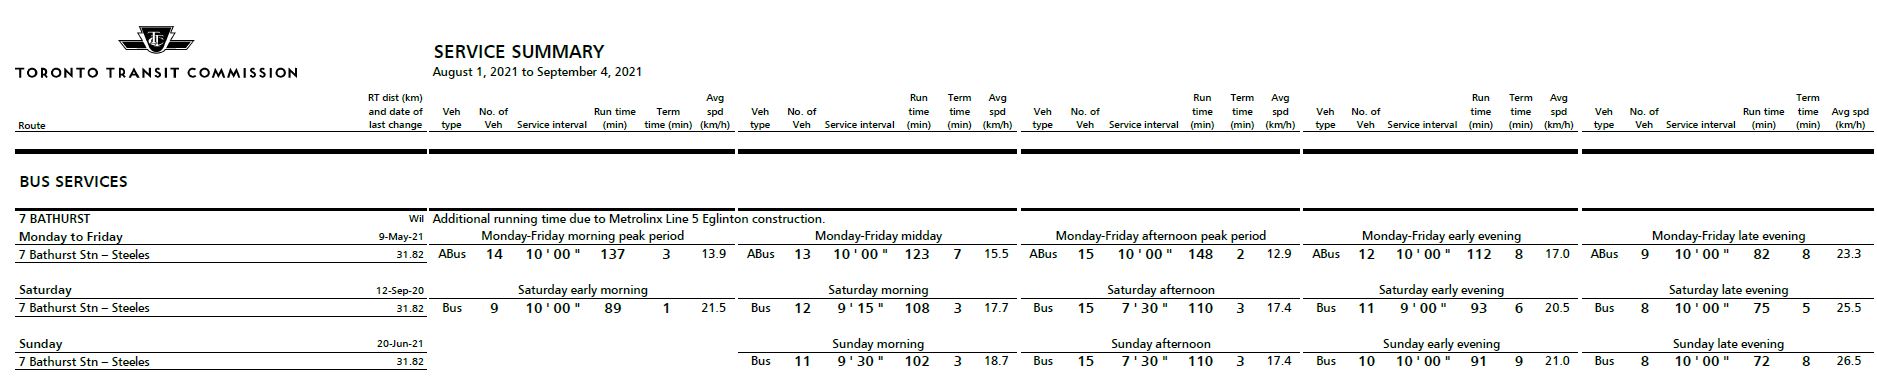
In January 2021, weekday service on 7 Bathurst changed from regular-sized to articulated buses (12m to 18m), and the January 2019 schedule was restored. As we will see later, there are still several 12m buses running on Bathurst, but on schedules that assume 18m capacity.
In May 2021, peak period service was trimmed in response to actual demand, and the service in effect until Friday, September 3, was to operate every 10 minutes throughout the day (see table below). Note that the schedule includes an allowance for construction of Forest Hill Station on Line 5, but actual operating data charted later in this article shows that this is no longer a source of delay.
The January schedule with slightly more frequent service will return on Tuesday, September 7 as part of the TTC’s overall restoration of service.
On Friday afternoon, September 3, 2021, a tweet popped up asking the perennial question “where’s my bus” from a rider waiting at Glencairn and Bathurst. The 7 Bathurst is a notoriously unreliable service even though, irony of ironies, it serves the TTC’s Hillcrest complex.
This article completes my analysis of corridors where RapidTO “red lanes” have been installed or proposed to speed bus operations. Previous articles in the series are:
This article reviews travel times and headway reliability (the intervals between buses) primarily through the pandemic era to July 2021 with April 2018 data as a pre-pandemic reference.
The High Points
The reduction in travel times on Lawrence East from mid-March onward was smaller than on some other routes, and this was confined to certain areas and directions. This implies that red lanes would not offer much change during many periods over the route from Don Mills to Starspray as proposed.
A further problem lies in the infrequent service particularly east of the 54B Orton Park scheduled turnback beyond which only half of the scheduled service (plus peak-only express buses) operates. A fully reserved lane is hard to justify if it will not substantially affect travel times and if only a few buses per hour actually use it.
The segment west of Victoria Park includes the DVP interchange where integration of red lanes would be difficult. The time saving from March 2020 onward is small or nil for most of the day.
By far the worst problem on the 54/954 Lawrence East service is headway reliability, and unpredictable gaps in service can contribute far more to journey times than any saving that might arise from reserved lanes. Service leaving Lawrence East Station both ways is very erratic even though this would be a logical place to space service.
The route is subject to congestion and construction delays along Eglinton from Leslie to Yonge, although the schedule is supposed to include extra time to compensate.
Headways inbound from eastern Scarborough are disorganized both at the very outer end, and west of the point where the 54B service merges in. The express service operates on wide-ranging headways to the extent that waiting for the next one to show up could add more to a trip than the time saved by “express” operation.
Average headways on a daily and weekly basis generally follow scheduled values indicating that most or all service is present, and the wide gaps cannot be explained by missing or untracked vehicles.
This article continues my analysis of corridors where RapidTO “red lanes” have been installed or proposed to speed bus operations. Previous articles in the series are:
This article reviews travel times and headway reliability (the intervals between buses) primarily through the pandemic era to July 2021 with April 2018 data as a pre-pandemic reference.
The High Points
Finch Avenue East is a corridor with a considerable amount of service through the combination of several express and local branches. Service will improve on weekends starting in September with the reintroduction of express service, but that is beyond the scope of this analysis.
As on many routes, travel times fell in March 2020 with the onset of the pandemic shutdown, the drop in road traffic and a big drop in transit demand. Through March, the travel time pattern changed from a pre-pandemic character with traditional peaks to an almost flat travel time value all day long. This drop, corresponding to a condition with little interference from traffic, probably represents a “best case” of the improvement that a transit priority lane can bring to Finch Avenue East.
This effect was primarily on weekdays on Finch with a smaller drop on weekends. The AM peak completely disappeared, and the PM peak has only re-emerged in recent months.
Travel times are climbing through 2021 and are in some cases back to pre-pandemic values, although not during peak periods.
Speed profiles for the local and express services based on the second and third weeks of July 2021 differ somewhat, but not as much as on other routes. However, a speed profile indicates how fast buses are moving when they are moving, and a stopped bus only counts as a “zero” once regardless of how long it sits serving passengers or waiting for a traffic signal.
Average speeds for buses at some times and locations on Finch exceed the posted 50 kph speed limit. This is no surprise to anyone familiar with suburban traffic patterns. Whether this will persist as traffic volumes build remains to be seen.
As in many of these route analyses, the weak point is headway reliability. All the speed in the world is of little benefit if a bus does not show up reliably and regularly. This can be compounded by vehicle crowding when buses are running in packs rather than on an even spacing.
The article includes charts of headways (the time between buses) in the first week of July 2021, a period when conditions were about as favourable as we will see for weather and the level of demand. At several points on the route, both the local and express service headways can vary quite widely with large gaps and groups of buses travelling together.
The average headways are close to the scheduled values indicating that all of the scheduled trips were operated. The problem simply was that they were not reliably spaced. This problem exists during all operating periods and on weekends, not just weekdays.