
Updated December 9, 2021 at 6:20 am: A reader noted that of the range of articulated buses used as a comparison sample, one vehicle (9003), has been retired. The stats have been updated by adding 9025 to the range so that both the hybrid and artic samples contain the same number of active vehicles. Charts in the article have been updated as well as the linked PDF versions.
January 9, 2022: The follow-up article containing data for January to December has been updated with charts containing all of December 2021. The charts in this article contain only data for December 1-7.
The TTC is about to award one or more contracts for buses in the coming months including 300 conventional hybrids and 300 battery eBuses.
Although they have been conducting a head-to-head comparison of vehicles from three vendors for some time, they have not published results for each of them separately. Moreover, it is not clear the extent to which this comparison will inform the purchase for two reasons:
- Vendors may claim that their newer buses are better than the ones the TTC is testing.
- Some vendors’ products were not in the trial because they did not have a vehicle meeting TTC requirements at the time of the request for proposals.
The TTC eBus fleet consists of 25 buses from each of New Flyer and Proterra, and 10 from BYD. The original plan was for this order to be split equally among the three vendors, but BYD could not deliver their buses on a timely basis, and part of their “share” was divided between the other two vendors.
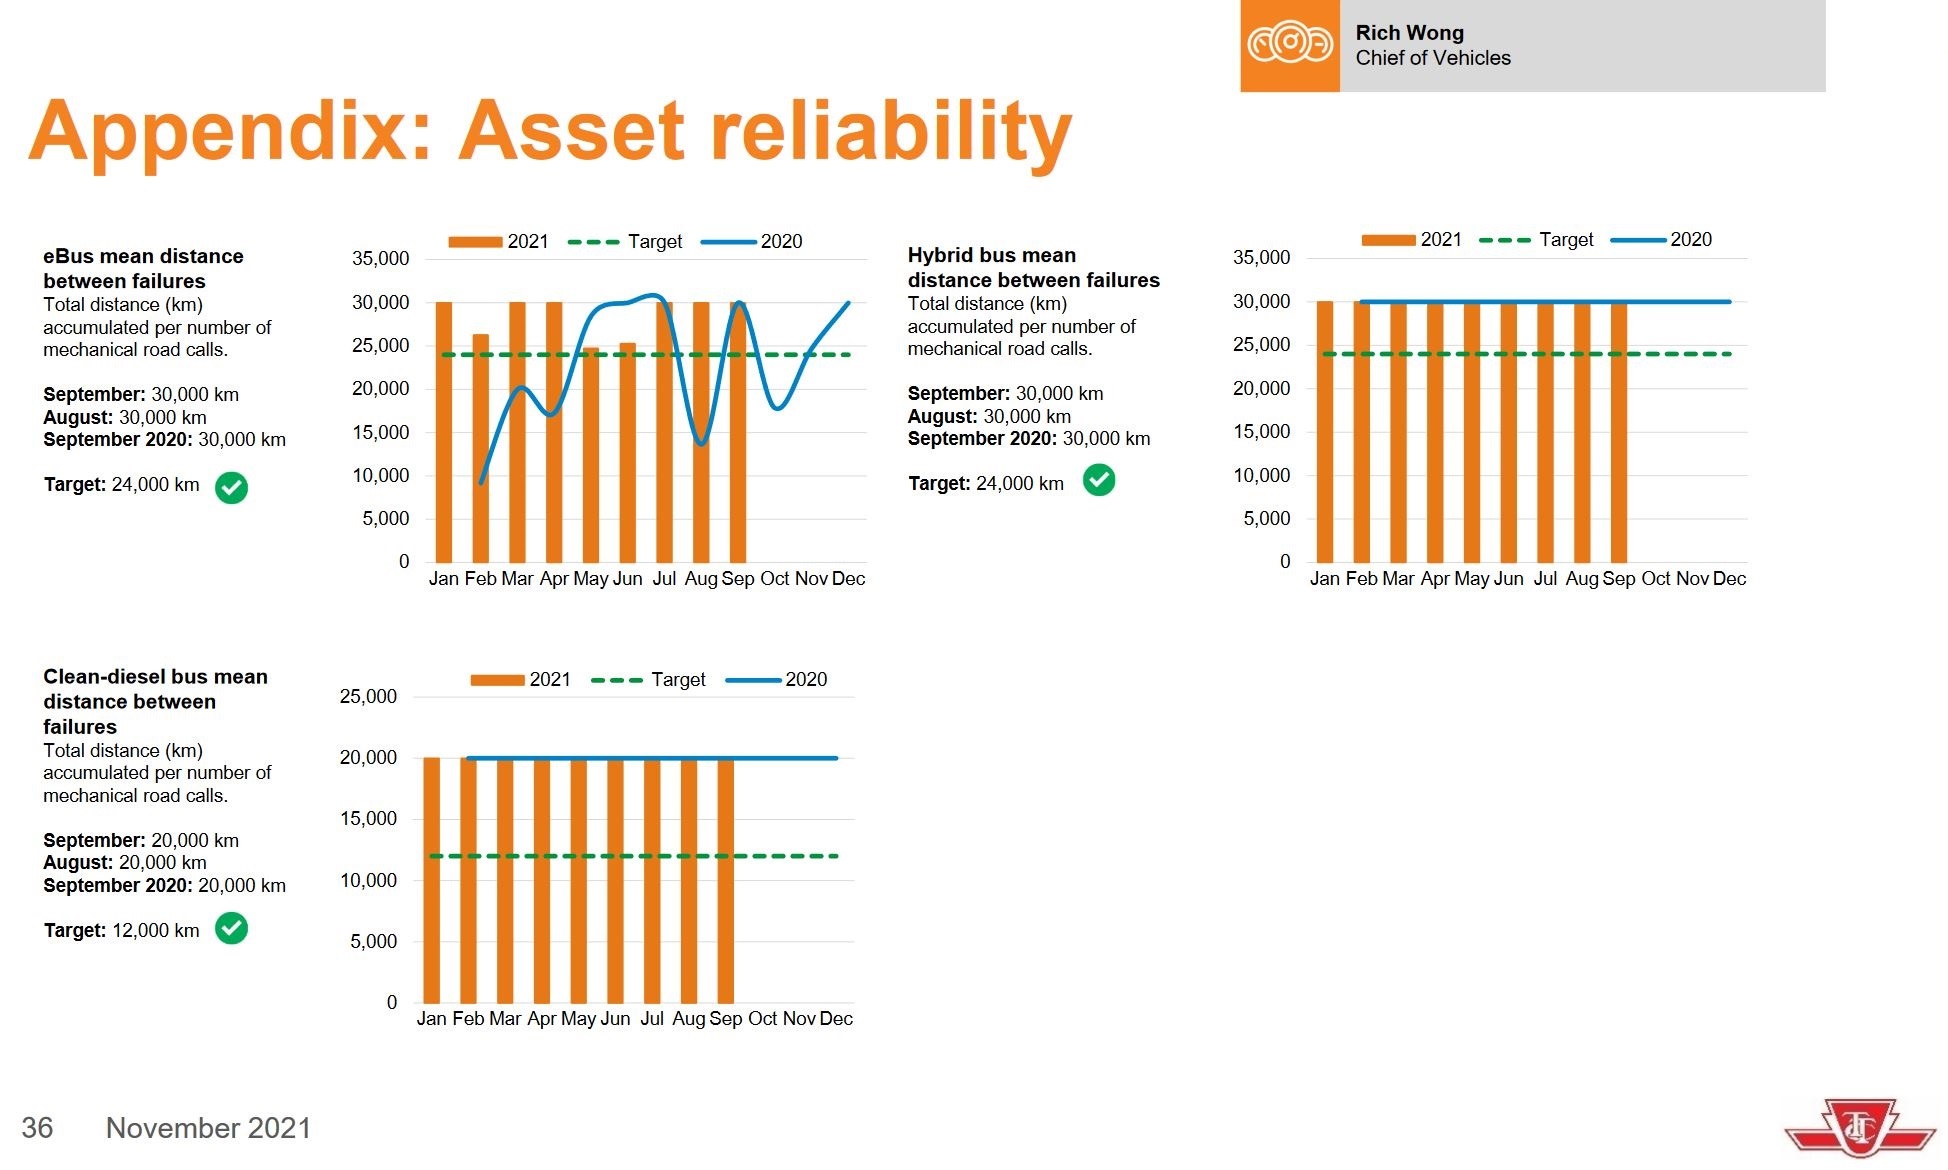
The TTC CEO’s Report includes stats on bus reliability measured as the mean distance between failures.
There are two major problems with these charts:
- The values reported are capped, and we have no idea how far above the target lines the month-to-month values actually reach. If one class of buses is substantially more reliable, but this is not shown due to capping, then it is impossible to make a valid comparison.
- Buses that never leave the garage do not contribute either to accumulated distance nor to breakdown counts. “Problem” buses could be sidelined because the TTC has lots of spares, and the stats for the working buses would make the group as a whole look better than it really is.
Methodology
In an attempt to get a handle on the actual use of the eBus fleet, I turned to vehicle tracking data. If a bus is regularly in service, it will appear in the tracking data, and it will not be simply sitting in a garage.
For this purpose, I used the trip tracking function on Darwin O’Connor’s TransSee website to find out where the eBuses spent their time for the past six months.
For comparison, I also pulled data for the month of September for 25 hybrid and 25 articulated buses. These buses date from 2018 and 2013 respectively.
From the trip reports, I extracted the vehicle number, date and time of the observation, and recorded the hours in which each bus was “seen”. Although this is vulnerable to missing tracking data (such as during the recent TTC cyber outage), any such effect is across the board and does not affect comparisons between vehicle types.
On a summary basis, each vehicle could be seen in 24 hour every day over the period. The number of observations is a broad indication of how much the bus is used. Also, the total number of buses used within a specific hour, broken down by type, shows the patterns of each fleet’s usage and the proportion of the fleet that was active during each hour.
July 2021
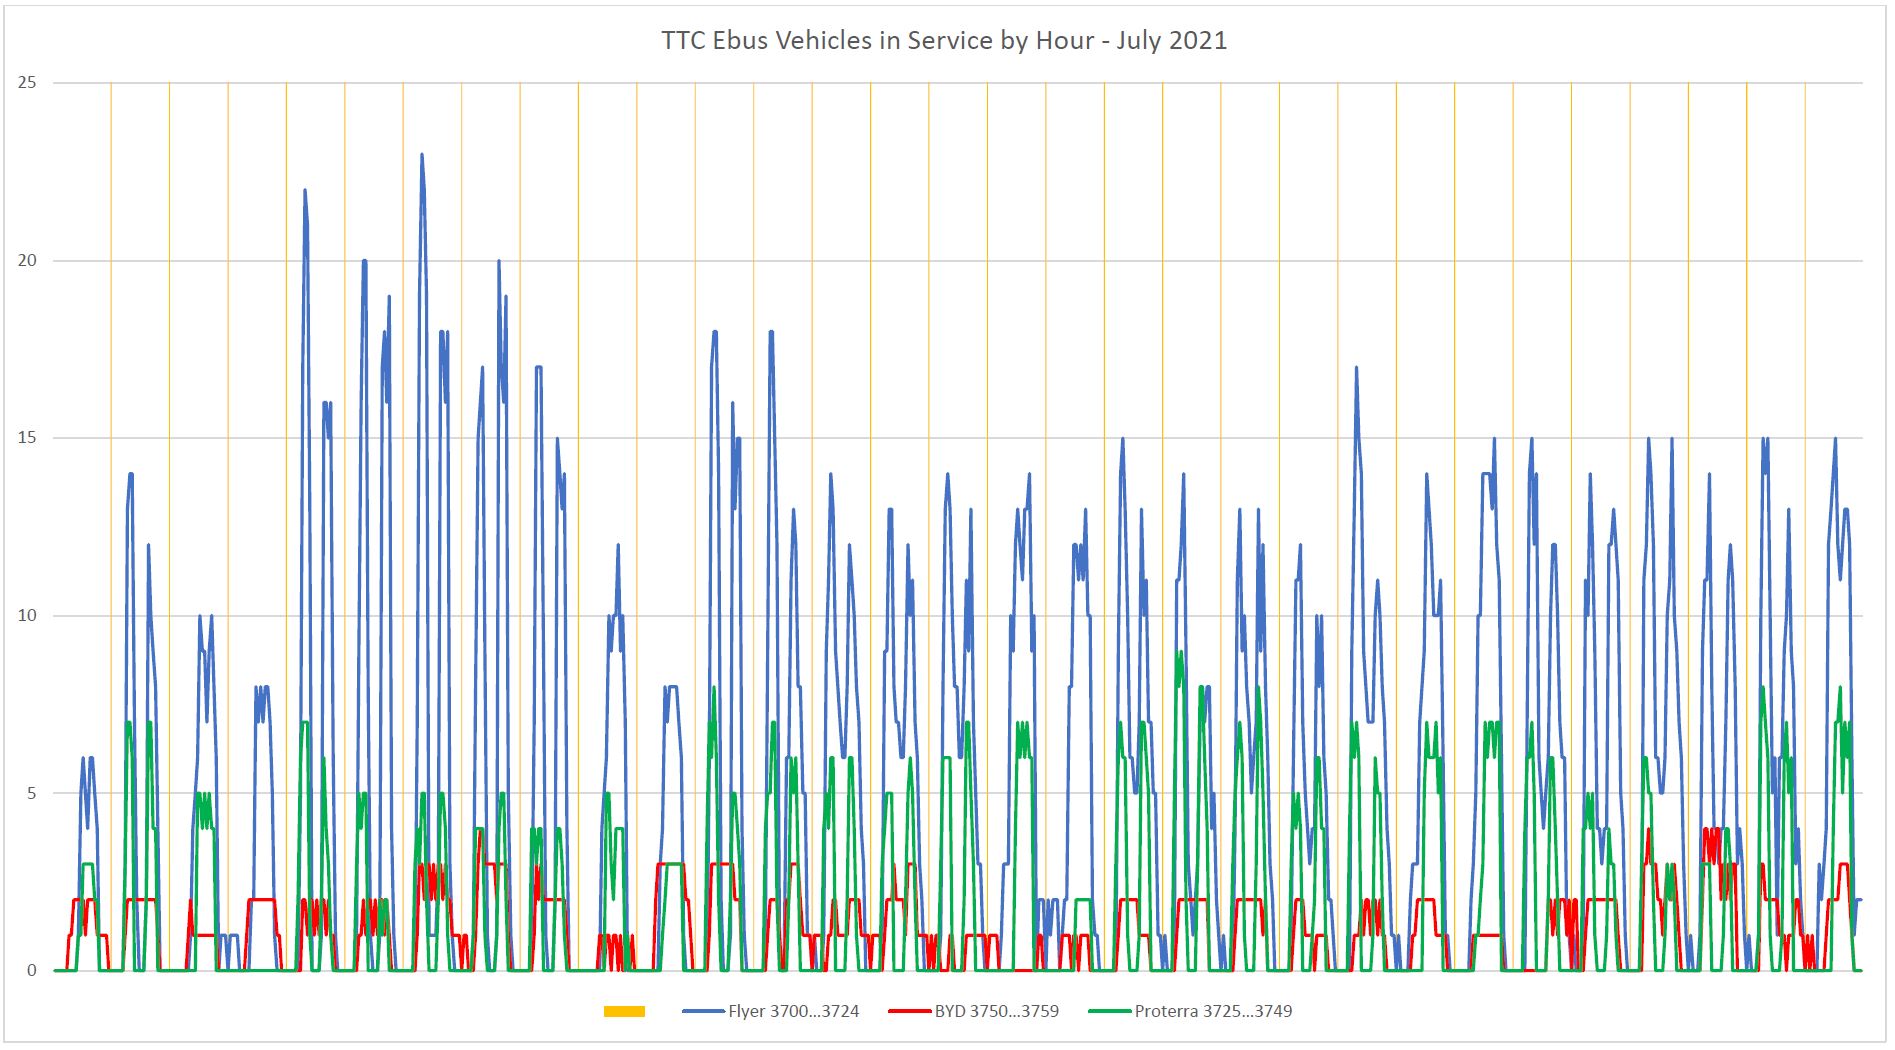
Here are the data for July 2021. Each vertical block separated by yellow lines is one day. The data for each group of buses is colour coded.
A few points are quite obvious here:
- The Flyer bus fleet was much more utilized than either the Proterra or BYD fleets, and at times over 80% of all Flyer buses were in service (20 out of 25). Proterra never fielded more than 9 of 25, and BYD never got beyond 4 of 10.
- There is a distinct pattern of double spikes in the usage on weekdays which typically have a higher total number of vehicles. This shows that many (and on some days all) of the eBuses did not stay out through the midday, but returned to their garage. On weekends, usage of Proterra and especially BYD buses was very low.



 Steve Munro