Updated April 10, 2022 at 10:30pm: Minor typos fixed. Bus order size for eBuses by TTC corrected. Reference to use of pantographs for charging on TTC buses corrected.
Updated April 18, 2022 at 2:50 pm: Note that the GHG savings cited in the TTC’s chart below are off by a factor of 1,000 because they mixed up kilos and tonnes partway through the calculation. See also TTC eBus Errata: Tonnes and Kilos Are Different.
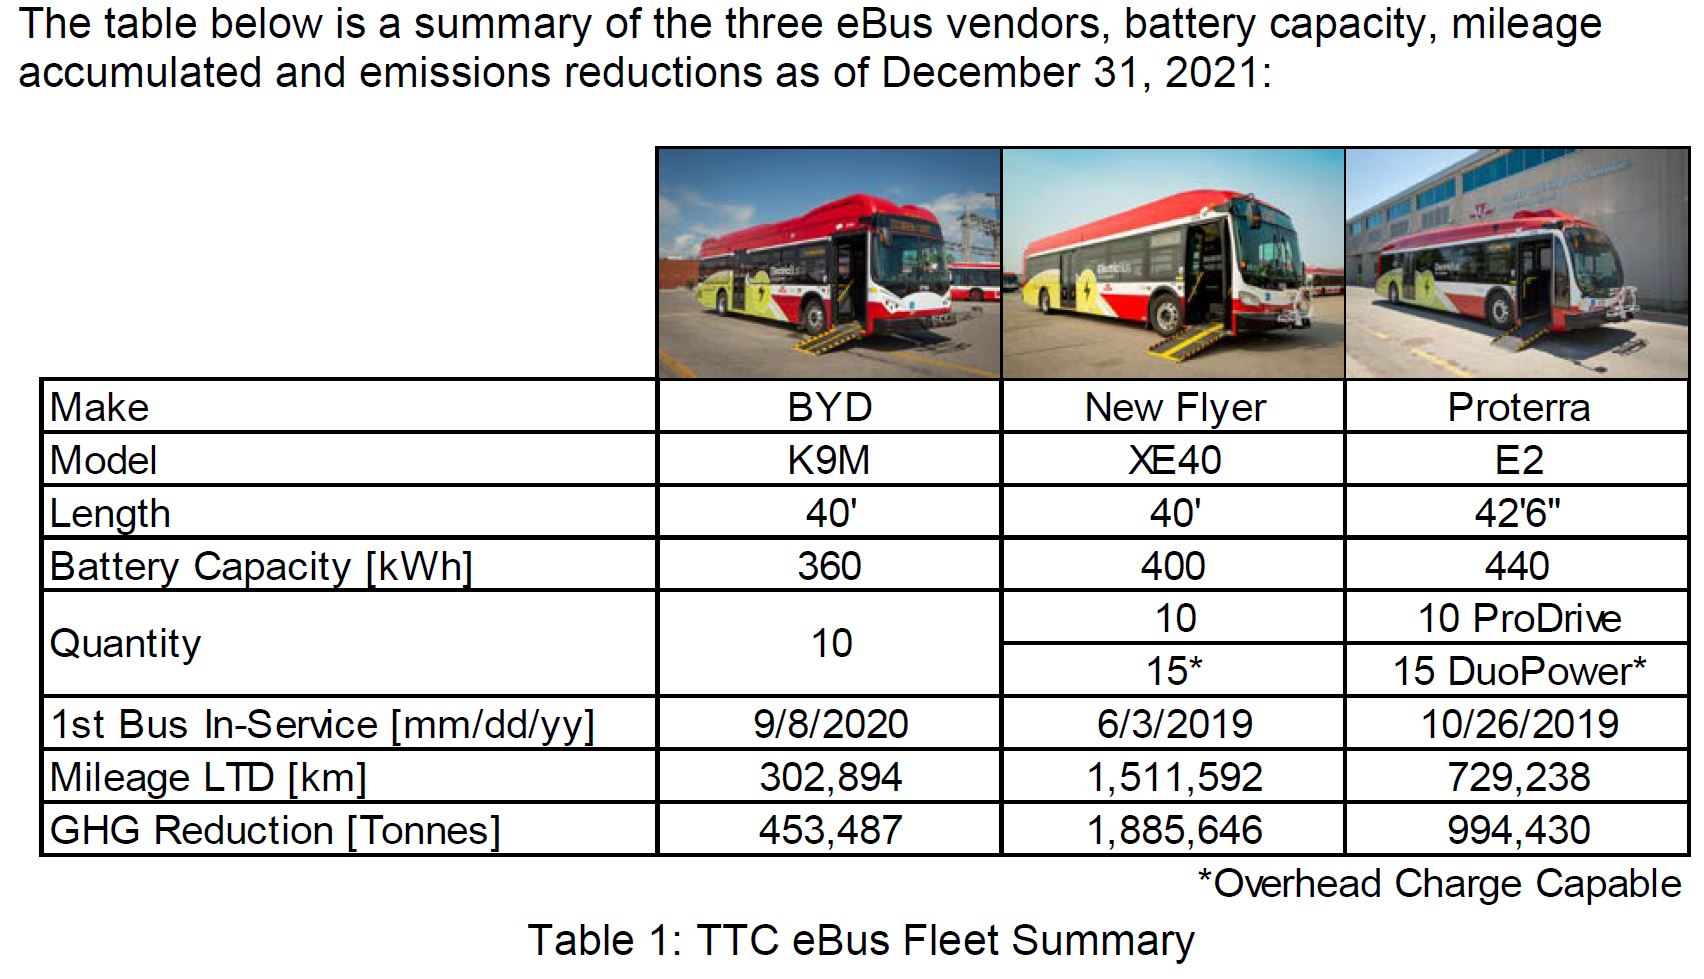
Since June 2019, the TTC ran head-to-head trials of three manufacturers’ battery-electric buses with a fleet of 60 vehicles:
- New Flyer models SR2304 (10) and SR2382 (15)
- Proterra models Catalyst 40 E2 RR Pro Drive (10) and DuoPower (15)
- BYD model K9M (10)
Nova Bus was not part of the trial because, when it was launched, they did not have a vehicle with sufficient range to meet the specifications. However, their hybrid diesel-electric bus, of which the TTC has many, was used as a comparator for the trial.
The low number of BYD buses was due to their inability to supply vehicles even though their lobbyists had engineered, through Deputy Mayor Minnan-Wong, a “deputation” at a TTC Board Meeting that turned into a full sales pitch clearly hoping to short-circuit the procurement process. This was not a high point in TTC history, and the move to a green fleet was launched under very dubious circumstances.
There is also bitter irony for those who remember TTC history. Three decades ago, the TTC opted for the allegedly-green technology of Natural Gas buses as a replacement for trolley bus system expansion. The CNG buses are long gone from Toronto, and the TTC now plans to move completely to electric transit. Lobbyists are good at selling things – whether they work or not is a secondary consideration.
The 102 page report TTC’s Green Bus Program: Final Results of TTC’s Head-to-Head eBus Evaluation goes into great detail of Toronto’s experience with their trial fleet and sets out many “lessons learned” and “must haves” for any large-scale procurement. This article is organized somewhat like the report with an overview followed by some of the technical background. The “lessons learned” have been consolidated at the end. Interested readers should consult the full report.
The clearly superior vehicles in the trial were the New Flyer buses. There were severe problems with reliability and maintainability in both the Proterra and BYD fleets, and some of the “must haves” would exclude them from consideration even if both vehicles and manufacturers had performed better.
Whether this technical outcome will be coloured by another round of lobbying remains to be seen. There will be a lot of money sloshing around as governments rush to “buy green”, but running transit requires a fleet that delivers reliable service, not just publicity photos. Toronto cannot afford to tie the future of its bus fleet to a manufacturer whose political connections outweigh their ability to deliver good products.
The TTC has funding in place from various governments to cover the purchase of about 600 vehicles. These will meet its replacement and growth needs from 2022 to 2025. In February 2022, the TTC ordered 336 buses for delivery by the end of 2023:
- Nova Bus LFS Hybrid 40′ (134)
- New Flyer Xcelsior Hybrid 40′ (134)
- New Flyer Xcelsior Hybrid 60′ (68)
These will be the last buses with diesel propulsion for Toronto, and they would be due for replacement in the mid 2030s completing the conversion to an all-electric bus fleet.
An RFP (Request for Proposals) was issued on April 4, 2022 for a large purchase (at least 240 vehicles) of eBuses with contract award planned for the third quarter of 2022. This lands in the middle of the municipal election campaign, and the authority to award will be delegated to TTC management by the Board. Bids will close on June 17, and the successful vendor(s) would be notified in July with execution of agreements in August. (The last scheduled TTC Board meeting is on July 14, 2022.)
The specification for these buses was developed jointly by the TTC with other agencies:
The TTC is engaged with other peer transit agencies in the province, including Brampton Transit, Mississauga Transit, York Region Transit, and others through the Ontario Public Transit Association on the first interagency co-operative procurement of eBuses. The aim of this collaboration is to develop a single zero-emissions bus procurement specification with the immediate benefit of reducing cost through economies of scale. The long-term benefit is through the optimization and standardization of customer experience and, operations and maintenance throughout the GTHA and beyond.
TTC Report at p. 4
The potential quantity of buses is considerably higher with options for both the TTC and other agencies.

In parallel to its migration to an electric fleet, the TTC must convert its bus garages including the provision of charging infrastructure for hundreds of vehicles at each location. At a previous meeting, the Board authorized an agreement with Ontario Power Generation and Toronto Hydro for the charging infrastructure. The utilities will build, own and maintain this as an extension of their distribution system.
Although the specification includes a requirement for on-route charging using stationary charging points, the TTC has not yet determined if or how such facilities would be used. There is no consideration of “in motion” charging using conventional trolleybus infrastructure to avoid the need for buses to lay over to recharge during their revenue service hours.
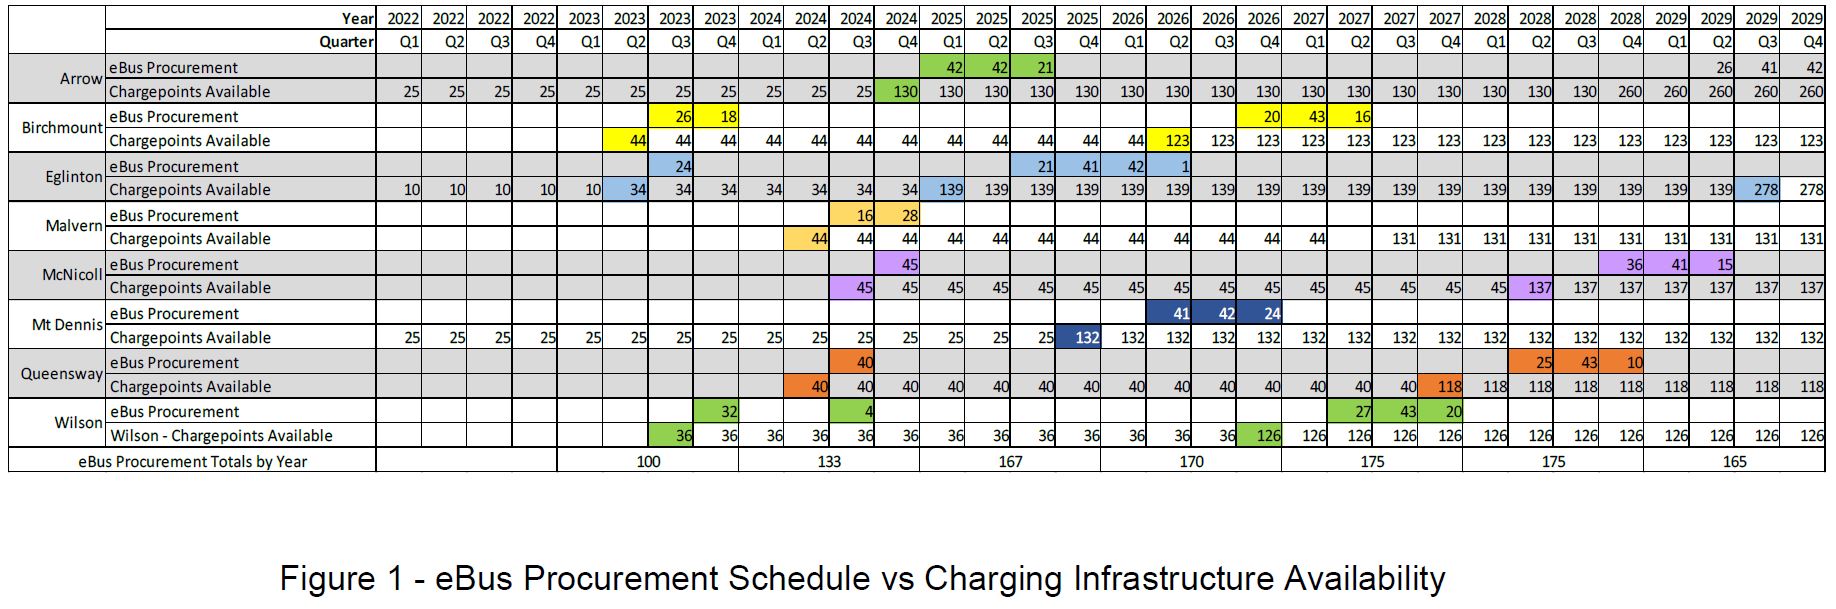
The overall plan for both buses and charging infrastructure is shown in the table below grouped by garage. This accounts for 1,085 buses, about half of the existing fleet. The first 240 buses planned in the contract award this year would take the TTC into early 2025. The program is not funded yet beyond that point. As and when more money appears, the TTC would extend its order.
Note that there are two phases to the installation of charging facilities at garages as the roll out of electrification works its way through the system. This allows some routes from each garage to operate with eBuses earlier in the program than might be practical if the conversion went garage-by-garage over the next decade.
The two-step scheme would also allow for a tactical change in charging strategy to move more of this to enroute facilities such charging stations at terminals. Although the TTC report is mostly silent on any charging technique beyond garage-based plug-in systems, there is a reference in “lessons learned” to a conversion to pantograph charging as a cure for problems with charging cables.
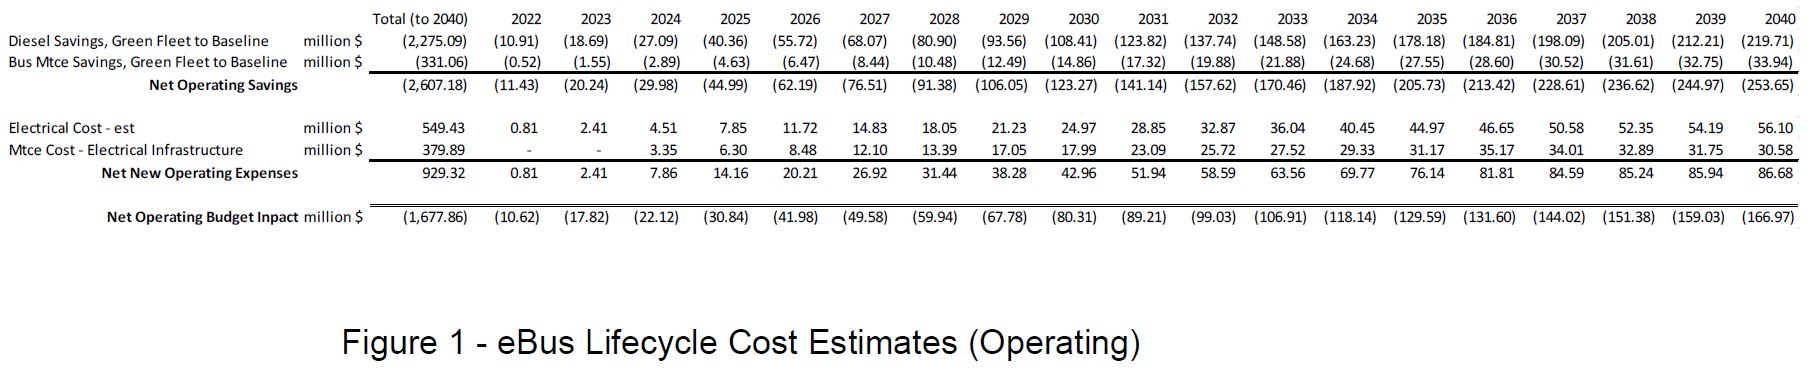
The TTC projects that life cycle costs for an electric fleet will be lower than for the diesels and hybrids it will replace because both energy and maintenance costs will go down. By 2040 this would save about $167 million annually. These estimates are sensitive to the future price of diesel fuel compared to electricity, but the TTC has not shown a range of values to indicate what the effect might be.
An 18-Year Design Life
Although the TTC report does not mention this, the actual RFP includes an interesting specification for fleet longevity. This signals a return to 18-year lifespans for the bus fleet after a retreat to 12 years in current fleet planning. If this can be achieved, it will offset the higher capital cost of the vehicles compared to hybrids or diesel buses.
1.1.1 The Bus shall have an 18-year design life and be equipped with a long life structure in accordance with Specification Section 1.8, made from full stainless steel in accordance with Specification Section 3.0, have a body with a maximum overall length of 12.8 m (42ft.) including a stowed Bike Rack , 2.59 m (8 ft.-6 in.) in width and a maximum overall height of 3.4 m (134 in.).
RFP Technical Requirements Section 1, Page 6
Later in the RFP:
1.8 SERVICE LIFE
Buses shall be designed for a minimum service life of 18 years or 1,610,000 km (1,000,000 mi.), under severe operating conditions similar to revenue transit operation in the City of Toronto.
RFP Technical Requirements Section 1, Page 19
And in more detail:
The vehicle design life shall be validated by successful completion of a simulated 12-year average New York City duty cycle service life. The test program shall be designed around input measurements taken from a vehicle configured similarly to the test vehicle while it’s being operated over a known severe route. The New York City B.35 route or an approved equivalent (i.e., the Queens Q.44 route is now reportedly used by New York City), shall be used for a simulated 800,000 km (500,000 mi.) to demonstrate Bus longevity. This is generally considered to be the equivalent of 16 to 18 years operating life at all
RFP Technical Requirements Section 1, Page 20
other transit properties.
“Must Have” Specifications
An important outcome of the trial has been the development of a “must have” list, and certain aspects of any new fleet are not negotiable. Toronto has a history with every type of vehicle (subway, streetcar, bus) where pervasive problems have hobbled fleet performance and availability.
TTC’s next large-scale eBus procurement includes ‘must have’ requirements that are informed by the head-to-head evaluation and focus on ensuring longevity of the bus structure and high system reliability through a proven platform (e.g. stainless steel structure, doors, HVAC, suspension, etc.).
TTC Report at p. 2
These requirements are:
1. Altoona and shaker table testing has been successfully completed;
TTC Report at p. 24
2. A full stainless steel structure with a minimum of six years of in service experience;
3. A minimum usable battery capacity of 400 kWh;
4. A maximum overall bus length of 12.8 m (42 ft.) including a stowed bike rack;
5. A maximum overall height of 340 cm (134 in.) including any roof-mounted equipment;
6. Ability to charge via roof mounted pantograph charging interface, capable of accepting a minimum charge rate of 300kW (400 ADC) at 750 VDC or greater via SAE J3105/1; and
7. Two rear-mounted charging ports capable of accepting a minimum charging rate of 150 kW (200 ADC) at 750 VDC or greater via SAE J1772.
Requirement 3 conflicts with statements elsewhere in the report where a maximum length of 40 feet is cited so that buses will fit within existing garage designs and operations. The difference appears to be in whether the bike rack counts toward the total, but it is not clear whether the Proterra bus would meet this requirement.
Physical Compatibility: The industry standard bus length is 40-feet (12 metres). This standard was used to design storage facilities in the TTC’s existing bus garages.
The Nova HEV, BYD, and NFI buses meet this standard. Proterra buses are 42.5 feet long, but also offers the highest seating and standee capacity. Based on our bus garage layout, procurement of additional Proterra buses would result in a loss of storage capacity of approximately 10% at four of eight garages. The remaining four bus garages could accommodate this additional length. However, this would impose a significant operational constraint that would prevent movement of buses between garages.
TTC Report at p. 15
A maximum bus length specification of 40 feet is required in order to preserve bus storage density at existing maintenance facilities; …
TTC Report at p. 16, also p. 28, under “Lessons Learned”
It is not clear whether the TTC is prepared to accept buses over 40 feet long, and what position they will take about Proterra vehicles on that account. Other issues with that vendor, notably bus reliability, might knock them out of the running regardless of bus length.
An additional requirement applies to the contract itself rather than to the buses, and it addresses the City’s equity goals:
In support of the commitment to diversity, equity, and inclusion, the Contractor must agree, as a fundamental component to the Contract, to meet the Procurement Equity Requirements, by applying a percentage of the Contract Price in respect of the Diverse Business Enterprise Requirement and a specified number and percentage, as stated in the Proposal, in respect of the Equity Hired Requirement.
TTC Report at p. 7
This is a contrast to recent provincial actions to back away from equity and community benefit components in contracts.
Continue reading