
Updated January 13, 2022 at 6:45 am: Sundry typos and scrambled phrases have been corrected. The projection of additional bus requirements for a 70 per cent service increase has been corrected to include spares.
At its recent meeting, Toronto Council endorsed a plan to move the City to Net Zero emissions by 2040. A review of the full plan is well beyond the scope of this blog, but some proposals affecting transit service and operations are very aggressive.
If Toronto is going to be serious about this we need a detailed examination of assumptions, scenarios, cost projection, and plans out to 2040. Where will population and job growth be? How will transit serve them?
Before I get into the report itself, a quotation from former TTC CEO Andy Byford is worth mention.
Andy Byford sums up the role of a transit system:
“…service that is frequent, that is clean, that goes where people want to go, when people want to go there, that is customer responsive, that is reliable, in other words that gets the basics right …”
Andy Byford on CBC Sunday, December 21, 2021
Too often we concentrate on big construction projects, or a new technology, or a showcase trial on one or two routes rather than looking at the overall system. In particular, we rarely consider what transit is from a rider’s point of view. It is pointless to talk about attracting people to use transit more if we do not first address the question of why they are not already riding transit today. This is an absolutely essential part of any Net Zero strategy.
The reports contain a lot of material, although there is some duplication between them. They contain proposals for short and medium term actions. At this point, Council has not embraced anything beyond the short term plan.
From a transit point of view, that “plan” is more or less “business as usual” and does little to challenge the current status of transit service in the short term. There is hope that electrification of the diesel/hybrid bus fleet might be accelerated, but little sense of what, on a system-wide basis, would shift auto users to transit beyond works already in progress.
A vital point here is that transit has two major ways to affect Council’s Net Zero goals:
- Conversion of transit vehicles to all-electric operation will reduce or eliminate emissions associated with these vehicles, depending on the degree to which the electricity sources are themselves “clean”. This is a relatively small part of the City’s total emissions.
- Shifting trips from autos to transit (or to walking or cycling) both reduces emissions and relieves the effects of road congestion, including, possibly, making more dedicated road space available for transit and cycling. Emissions from cars are much more substantial than those from transit.
In the short term, the overwhelming focus is on conversion of the existing bus fleet to electric operation, not of expanding service to attract more riders. Improvements to specific routes might come through various transit priority schemes, but these will not be seen system-wide. Based on demand projections, large scale capital works, notably new subway lines, will primarily benefit existing riders rather than shifting auto users to transit.
The short term targets related to transit are quite simple:
- Electrify 20 percent of the bus fleet by 2025-26.
- This effectively requires that 400 diesel or hybrid buses be converted. The TTC already plans to buy 300 eBuses, and the Board has asked TTC management to look at accelerating this conversion. This target is very low hanging fruit provided that someone will pay for the buses.
- Further targets are 50 per cent conversion by 2030, and 100 per cent by 2040.
- Looking at the TTC’s likely replacement schedule (discussed in my Capital Budget Follow-Up), they will easily be achieved as much of the existing fleet is due for replacement by the early 2030s. Hybrid buses to be acquired this year will reach end of life in 2034-35.
This is an endorsement of “more of the same” in our transit planning, but no real commitment to making transit fundamentally better so that it can handle many more trips at lower emission rates than today.
Looking further out there are proposals for substantially more transit service and free fares, but these are not fully reflected in projected costs or infrastructure needs.
Some of the proposals for the NZ2050 plan are, shall we say, poorly thought-out:
- Convert one lane of traffic to exclusive bus lanes on all arterials.
- Many arterials are only four lanes wide and taking a permanent bus lane has considerable effects on how the road would operate. This is a particular problem for routes with infrequent service during some periods of operation.
- Increase service frequency on all transit routes: bus by 70%, streetcar by 50%, subway off-peak service increased to every 3 mins.
- This represents a very large increase in transit service with effects on fleet size, facilities and, of course, budgets. This would require an increase in the bus and streetcar fleets beyond what is already planned as well as construction of new garages and a carhouse.
- Tolls of $0.66/km on all arterial roads.
- This would apply only to fossil-fueled cars, and the forecast amount of revenue is less than half of the additional funding transit would require.
- No transit fares.
- The immediate cost of this would be about $1.2 billion in foregone fare revenue, offset by about ten percent in the elimination of fare collection and enforcement costs.
- Shift 75% of car and transit trips under 5km to bikes or e-bikes by 2040.
- This is truly bizarre. In effect, transit stops performing a local service for most rides and they are shifted to cycling. The average length of a transit trip is under 10km, and many are shorter. Moreover, trips are often comprised of multiple hops each of which might be quite small. There is a small question of how much uptake there would be in poor weather conditions.
- Shift 75% of trips under 2km to walking by 2040.
- Even some transit trips are short, and transit, especially with improved service, is the natural place for these trips. It is not clear whether the plan would be to somehow deter transit users from making very short trips just as, indeed, a car driver would.
[Revenue and cost issues are discussed in more detail later in this article.]
With all of the planned investment, transit’s mode share of travel is projected to fall, while walking and cycling would rise considerably in part because of the policy of diverting short trips. It simply does not make sense to push people off of transit just at the point where we are trying to encourage transit use. This part of the plan is laughably incoherent, and is an example of how good intentions can be undermined by poorly crafted policy.
For example, it is less than 5km from Liberty Village to Yonge Street, and if we were to take the proposal seriously, we would expect most people to cycle to work downtown, not take GO or the streetcar services. I look forward to the public meeting where this scheme is unveiled to the residents. If the demand for GO and for the King car is any indication, they do not want to use “active transportation”. Similarly, the planned development at East Harbour is less than 5km from downtown.
Meanwhile, transit electrification itself only eliminates 3 per cent of existing emissions, assuming a clean source of electricity. The subway and streetcar systems already are electrified, and both have capacity for growing demand if only more service were operated.
Reports:
- Council motion
- Staff Report: TransformTO: Critical Steps for Net Zero by 2040
- Attachment A: Short Term Plan
- Attachment B: A Climate Action Pathway
- Attachment C: TransformTO Net Zero Strategy Technical Report – November 2021
- Supplementary Report: Critical Steps
The Council motion reads, in part:
City Council endorse the targets and actions outlined in Attachment B to the report (December 2, 2021) from the Interim Director, Environment and Energy, titled “TransformTO Net Zero Strategy”.
Councillor Layton moved two amendments:
* Request the Board of the Toronto Transit Commission to identify opportunities to accelerate the Green Bus Program and to request the CEO, Toronto Transit Commission to report to the Board in the second quarter of 2022 on these opportunities.
* City Council request the City Manager, in consultation with the General Manager of the Toronto Transit Commission, to outline in the 2022 Budget proposal options to increase spending on surface vehicles and hiring additional operators aimed at increasing ridership to get us on the path to achieving the TransformTO goals.
The first amendment echoes a request from the TTC Board to its management at the December 20, 2021 meeting. Acceleration of eBus purchases will require additional funding from somewhere, as well as a vendor capable of meeting a larger order. It will also have effects on TTC infrastructure needs for garaging.
The second amendment is more pressing because it speaks to the 2022 Budget process that will launch on January 13. If the TTC is going to ramp up service this year, this must be factored into the budget. A likely problem will be that any growth beyond that now planned will be entirely on the City’s dime rather than supported by other governments. However, we need to understand what could be done, if only to know the cost should a “fairy godmother” show up with some spare change.
Neither the amendment nor the short-term target for 2022-2025 gives any indication of just what is meant by “better” transit service, nor do they distinguish between restoring pre-covid service levels and going beyond that to encourage more ridership.
The points listed above for NZ2050 are excerpted from Attachment C, the technical background report. A casual reader might think that Council has embraced a very expansive view of transit’s role, but they have not.
The tactics from Attachment C are notably absent from Attachment B which refers to them, but actually lists a much more restricted set of transit goals. I have confirmed with City staff that Council has only endorsed Attachment B.
Q: For clarification: There are, broadly speaking, two levels of a shift in the emphasis on transit in the short term plan to 2030 and in the longer term to 2040 and beyond. Reading the Council motion, it appears that Council has endorsed the short term plan (Appendix B), but has not endorsed the more aggressive targets of the longer term set out in Appendix C. Is this a correct interpretation?
A: Yes. City Council endorsed the targets and the actions outlined in Attachment B ‘TransformTO Net Zero Strategy’. Attachment C is a technical backgrounder report that was used to inform the targets and actions that were recommended and adopted.
Email from Steve Munro to Toronto Media Relations, December 29, 2021. Response from Toronto Environment & Energy Division, January 10, 2022.
That is a polite way of saying “we had some really aggressive ideas, but we know enough not to bring them to Council”.
“Transit” vs “Transition”
In the process of reviewing the reports, I searched on the word “transit”, but got hits more frequently on “transition” as there are many other sectors where reduction or elimination of emissions are possible and on a large scale.
According to the most recent greenhouse gas inventory, transportation is the second largest source of GHG emissions, accounting for 36 percent of total emissions with approximately 97 per cent of all transportation emissions originating from passenger cars, trucks, vans, and buses. Gasoline accounts for about 30 per cent of Toronto’s total GHG emissions.
TransformTO: Critical Steps for Net Zero by 2040. p. 30
Here is a pie chart showing the relative contribution of each proposed action in the Attachment C list which is a more aggressive set of changes than Council adopted. Note the small contribution of transit (red) compared with other areas such as personal and commercial vehicles and changes to building energy use.

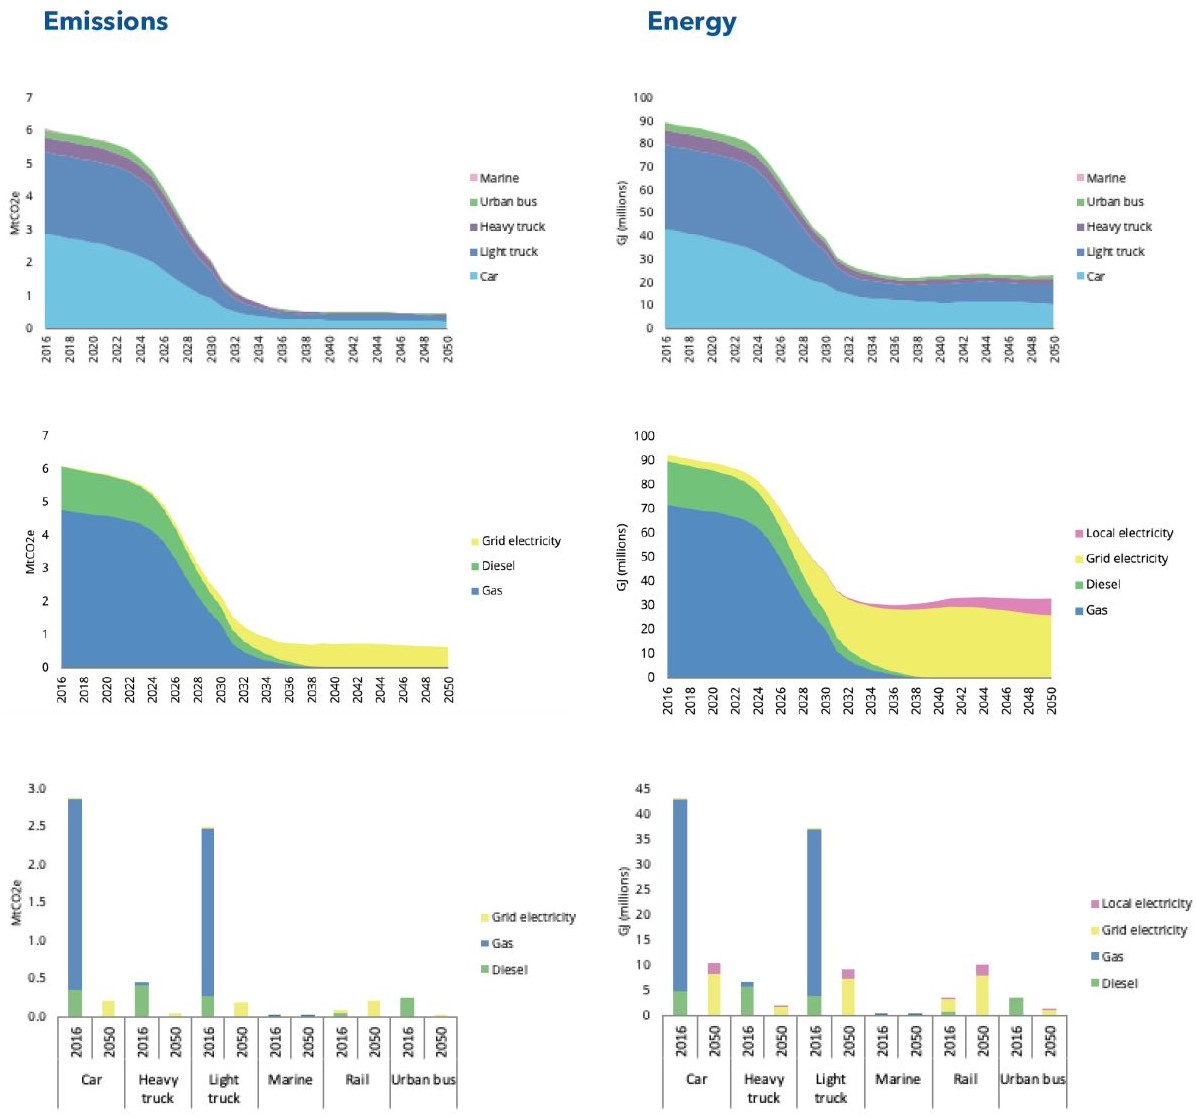
Another way to look at this is shown in a chart of energy sources and emissions generated by each transportation sector as the full NZ plan is implemented.
- Top left: the emissions of urban buses are shown in green. This falls off to zero as the bus fleet electrifies.
- Middle left: the decline in diesel (green) is a combination of transit, trucking and a small contribution from diesel-powered autos.
- Bottom left: Cars and light trucks are the overwhelming contributors of emissions within the transportation sector.
- On the right, the charts are harder to accept at face value because they include the effect of a very large shift of short trips to active transportation. An interesting comparison would be what might happen if autos electrified, but did not lose mode share.
That last point has a knock-on effect because if short trips are not shifted, but are only electrified, they will contribute a substantial demand to generating and charging capacity, not to mention continued auto traffic and competition for road space.
Improving Transit
The staff report paints a picture of widespread change, but at least as far as the transit component is concerned, some comments are out of sync with current TTC and Council budgetary plans.
The combination of attentive urban design, city planning, active transportation, and transit systems, changes in consumptive [sic] behaviour and supportive net zero consumer choices, will all need to work in step to cumulatively increase the efficiencies of corresponding urban systems.
TransformTO: Critical Steps for Net Zero by 2040 p. 2
Leaving aside that “consumptive” is a term referring to a disease, not to consumer behaviour, the observation that this is a collective effort is central to the entire plan. Cherry picking “solutions” with the hope of appearing to make progress will not solve our emissions problems, especially if the items chosen contribute little to the overall problem today.
Buying electric buses is the easy part. Actually running more of them and providing more service, that’s another story, one which Council has refused to embrace for decades.
The 2030 targets address many sectors, with transit playing a relatively small role (highlighted below). Note that this does not aim to change the relationship between existing residential and work locations, only to capture the lion’s share of short trips where they exist. [From the Critical Steps report at page 3]
- 100 per cent of new buildings are designed and built to be near zero greenhouse gas emissions;
- 50 per cent reduction in greenhouse gas emissions from existing buildings, from 2008 levels; this means that approximately 100,000 buildings must be retrofitted in the next 8 years, or approximately 12,500 buildings per year;
- 50 per cent of community-wide energy comes from renewable or low-carbon sources; this will mean that approximately 35 million MWh of energy will need to be sourced from renewable or low carbon sources
- 25 per cent of commercial and industrial floor area is connected to low carbon thermal energy sources
- 75 per cent of school/work trips under 5km are walked, biked or by transit
- 30 per cent of registered vehicles in Toronto will be electric; this means that by 2030, an estimated 332,000 vehicles will need to be electric
- Identify pathways to more sustainable consumption in City of Toronto operations and in Toronto’s economy
- 70 per cent residential waste diversion from the City of Toronto’s Integrated Waste Management System
- Reduce corporate emissions by 65 per cent, over 2008 levels, to demonstrate leading by example; this will mean that approximately 330 kt of emissions will need to be reduced cross-corporately
The degree to which comparatively short school and work trips will be made by active transportation or transit depends both on personal behaviour choices and on the viability of each option depending on land use patterns.
Schools and some job locations are not all well-served by transit from a wide catchment area, but from a route network that focuses on subway-bound travel. If the school, office or factory happens to be along the way, that’s fine. However access can be challenging depending on transfers involved and whether the destination is on a main route or inside a block requiring a long walk from the nearest transit stop.
In the longer range view, a further problem lies in the assumption that a much higher proportion of trips will be comparatively short, and therefore amenable to walking, cycling or a short (probably transfer-free) transit trip. This produces a very odd result in the projected modal splits.
In fact, when one delves into the Technical Report, one finds (as discussed in the introduction to this article) that the big shift to cycling is achieved by moving trips off of transit. This is a complete non-starter and undermines the credibility of the “transit” orientation of these proposals.
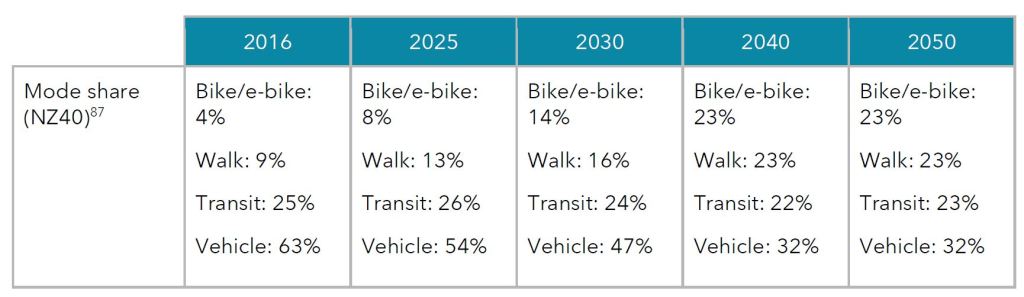
A key part of the entire plan is the assumption that the mix of short and long trips can be rebalanced so that short trips dominate, and these are largely taken by walking, cycling or transit. The projected mix produces a bizarre result that transit, in spite of substantial investment in more vehicles, more service and free rides, actually loses market share in the projections. The migration from private vehicle travel is entirely to cycling and walking. Transit may have more trips in absolute numbers through growth, but its share of the total travel market goes down.
It is not clear how the trip length mix would be so radically altered given that much of the city and its patterns of residential, school and job locations are well established. Indeed, this affects not just Toronto itself, but cross-border trips (and by extension land use) to the 905.
There is also the small matter of weather. If walking or cycling is impractical in poor weather, there is a good chance this will spawn a need for a private vehicle that will be used on fairer days. It is simply not credible that most people making journeys up to 5km will cycle in bad weather.
I asked the City to comment on this:
Q: On pp 85-86 of Appendix C, there is a table showing the shift in mode shares in which transit’s share actually declines while cycling and walking grow substantially. This is not just for short trips (under 5km) but overall. This is not credible given both the mix of travel distances and the proposed substantial increase in transit service. Can you explain the numbers in this table, and in particular how transit does not benefit in mode share from substantially increased service?
A: The mode shares in Table 10 in the technical report are modelled targets. Much of the shift in the modelled targets results from lower average trip lengths, resulting from increased mixed use density and higher future rates of work from home, and higher proportions of short trips being completed by walking and cycling (bikes and e-bikes), supported by investments in active transportation infrastructure. These targets are informed by existing mode shares observed using the Transportation Tomorrow Survey as well as modelling from the City’s regional travel demand model (GTAModel V4). The City’s modelling typically finds that the planned investments in transit increase the expected number of people taking transit in the future, but only maintain the proportion of trips taken by transit.
Email exchange, op. cit.
This statement bumps into a conflicting claim elsewhere in the report where the modal shift to transit is claimed to be part of the shift to net zero. The City really needs to decide whether transit investments will shift mode share or not. An even worse outcome would be for added riding attracted to new megaprojects to mask lost riding in other areas.
Continuing investments to expand public transit infrastructure will contribute to the modal shift to public transit needed to meet the Strategy’s 2030 targets and achieve net zero. The City and Province continue to advance transit expansion as part of several intergovernmental agreements, including the most recent Toronto-Ontario Transit Partnership Preliminary Agreement. These light rail, heavy rail and subway projects will expand access to higher-order transit across the city and are all at various stages of planning, development, and construction. The City also continues to advance design and seek intergovernmental funding for its transit priority projects, namely the Eglinton East LRT and the Waterfront Transit Network.
Climate Action Pathway, p. 95
The chart below shows the targets for electrification of private and public vehicles. In the chart, the “DN” option refers to “Do Nothing” while “BAP” refers to “Business as Planned”. The transition to an all-electric bus fleet is already baked into the TTC’s capital plans as discussed in my recent review of the Capital Budget. See TTC 2022 Capital Budget: Board Meeting Follow-Up.
The TTC will order what it expects to be its last batch of hybrid diesel-electric buses in 2022, and they will be due for retirement in the mid-2030s. At that point the entire fleet will operate on electricity. The challenge in the more aggressive scenario for transit will be the need to increase the fleet sizes and provide storage and maintenance infrastructure. I will turn to this later in the article.
The low hanging fruit in this plan is electrification of transit. However, a huge contribution to emission reductions will come from the migration of all personal vehicles to electric power. That is a cost borne by vehicle owners, and there are implications for how this transition will be financed if electric vehicles continue to command a premium price over those with internal combustion engines.
Increase access to low carbon transportation options, including walking, biking, public transit and electric vehicles – Toronto will increase the use of active and public transportation reduces [sic] greenhouse gas emissions, energy use and congestion while promoting equity and health benefits.
TransformTO: Critical Steps for Net Zero by 2040, p. 4
It is all very well to talk about giving access to low carbon options, but this requires a combination of geographic changes (population and destination concentrations), as well as facilities (good sidewalk, protected cycling routes and frequent, reliable transit) that in many cases do not exist today.
In support of increased net-zero travel for trips of 5km or less, one proposed tactic is better transit service. If, in fact, this would generate more transit travel, why does the transit mode share not rise? Moreover, there is a basic question about how applicable this tactic would be in different parts of the city where average trip lengths could vary. The existing layout of car-oriented planning does not lend itself to short trips, let alone a benign travel environment by other modes.
Increase existing bus and streetcar service levels to encourage shifts to low-carbon, sustainable transportation.
Summary of Short Term Plan 2022-2025, point 9. Ibid, p. 5
At this point, the report advances the idea of better transit, but overplays what is already in the pipeline.
… the City is making significant capital investments in the TTC – the 2021-2030 10-year Capital Plan totals $11.907 billion and includes $1.576 billion alone for vehicles such as buses, streetcars and subway cars, including the acquisition of electric buses to enable residents to reduce their transportation related GHG emissions.
TransformTO: Critical Steps for Net Zero by 2040, p. 8
To be kind, this statement is incredibly naive if not outright misleading. Yes, the City is making large capital investments but these are primarily for state of good repair, not for expansion. That $1.576 billion will, for the most part, replace existing vehicles at the end of their life (subway cars and buses), not add to the total fleet. Only the streetcars and a small minority of buses are net additions. (Note that the new subway lines are provincially-funded projects. Moreover, trains required for more frequent subway service are not yet funded and so do not yet appear in the 10-year Capital Plan.)
One cannot run more service without more vehicles unless (a) there is no intent to improve peak service or (b) better fleet utilization allows for more service with more buses on the street rather than sitting in the garage as spares. I have discussed the problem of underutilization of the TTC’s fleet before, but there does not appear to be any appetite at the political level to address this. See: How Much Bus Service Could The TTC Run?
Underlying all of this is an assumption that Toronto will not pay most of the cost. There is a big problem here that the focus is on capital programs which historically have contributions from the provincial and federal governments, but contribute little or nothing to day-to-day operating costs let alone service expansion or fare subsidies.
The costs included in this calculation of municipal finances are: transit infrastructure capital costs (assuming 27% of total investments are incurred by the City, the rest are from Provincial, Federal or other sources), transit bus maintenance and fuel costs, transit revenues, transit vehicle capital costs, wastewater and water treatment, waste management, and road toll revenues.
Technical Report, p. 123
A Question of Equity
At this point we get into the knotty problem of “equity” and the fact that car ownership, let alone electric car ownership, is beyond the means of many people. With the range of trips typically taken across the city, let alone the region beyond, is the intent simply to make electric vehicles more affordable, or to shift trips to other modes, notably transit for medium to long journeys? The phrase “as much as possible” in the text below is not quantified to show what proportion of trip kilometres fall into the target category.
The Net Zero Strategy intends to dramatically reduce greenhouse gas emissions from transportation by encouraging people to walk, cycle and use transit as much as possible, and by electrifying personal or commercial vehicles that are needed for any remaining trips. It is clear, however, that access to safe, continuous and inviting walking and biking infrastructure is not easily available for everyone in the city. Moreover, the cost to purchase a new electric vehicle can be high and not all buildings have charging available. As we transform our transportation system, it will be crucial that we ensure equitable access to safe, easy and affordable ways for everyone to get around.
TransformTO: Critical Steps for Net Zero by 2040 p. 16
There is an unfortunate blending of targets for short trips that might be shifted to cycling and walking with the overall travel patterns. A related problem is that, obviously, long trips contribute more emissions than short ones, and one must “capture” more of the short trips to generate reductions equivalent to a single long trip. At the same time, transit’s attractiveness wanes as trip lengths increase unless the trip lies along a speedy corridor with frequent service. These two effects compound the challenge of reducing emissions from longer commutes for work, school and entertainment.
The statement below appears to treat transit as something for people who cannot afford their own car, not as an alternative to a mode that eats road capacity.
For those not able to purchase a private electric vehicle, the electrification of our public transit fleet enables a long distance carbon free ride. Currently, subways and streetcars are virtually emissions free while the TTC’s Green Bus Program, approved by the TTC Board in November 2017, will see the procurement of only zero-emission buses starting in 2025 and achieving an entirely zero emissions bus fleet by 2040. By 2032, the TTC bus fleet will be almost 50 per cent converted.
TransformTO: Critical Steps for Net Zero by 2040 p. 32
I asked the City about this interpretation. They replied that it was not their intent, but it is hard to avoid the impression the statement gives. The authors appear to be trying too hard to draw in an “equity” element to their plan when they should emphasize plans that benefit everyone. More transit, and especially more transit in underserved areas in the outer 416 and 905, will do much more for equity by making transportation available regardless of its power source.
Q: There is a somewhat roundabout statement about how electrified transit will allow those who cannot use a private electric vehicle due to cost or other constraints to travel on a net zero mode. This is dangerously close to saying that transit is for those who cannot afford a car when we should be encouraging as much travel by all social classes on transit. This appears to be contrary both to the way the TTC works today and the target markets for many rapid transit projects. Does this reflect a new city policy?
A: No. It was not our intention to imply only those unable to afford Electric Vehicles (EV) would be using transit. The City’s Electric Vehicle Strategy, which was approved in January 2020, does look at equity issues around EVs and their use. The Net Zero Strategy also includes equity as a guiding principle. Equity and affordability will remain top priorities throughout implementation of the strategy.
Email exchange, op. cit.
The Cost of Net Zero
An important distinction is that the aggressive plan in the Technical Report, Attachment C is required to achieve net zero. This plan has not been endorsed by Council.
To achieve net zero emissions by 2040 governments, residents and businesses will need to take bold action. This will include all homes and buildings undergoing deep energy retrofits and using heat pumps for space and water heating, eliminating natural gas appliances, and electrifying all public transit and personal and commercial vehicles. Please refer to the TransformTO Net Zero Framework Technical Report for more details (Attachment C).
TransformTO: Critical Steps for Net Zero by 2040 p. 33
The cost of getting to net zero is portrayed as affordable, although the details underlying this analysis are not included in the reports. An essential question here is not just the capital cost of the transformation, but the ongoing additional operating cost notably for more transit service and free fares. The breakdown is unclear, as is the nature of assumed infrastructure additions. The statement below shows that the focus is on capital (infrastructure and retrofits), not on operating costs.
Financial analysis suggests that achieving a net zero Toronto will cost $57 billion to the entire community over the next 30 years. If broken down annually, these investments are equal to approximately 5 per cent of Toronto’s GDP until declining to zero in 2040. After 2040, investments are expected to generate a net annual savings. The greatest costs come from required investments in transit infrastructure and building retrofits.
TransformTO: Critical Steps for Net Zero by 2040 p. 38
I asked the City about the details:
Q: Can you comment in more detail or provide a breakdown of how the cost of this program, both operating and capital, was arrived at, and in particular the “delta” between “business as usual” costs and those required for the NZ program?
A: The technical modelling process included transit scenarios designed to achieve maximum shifts in transportation modal split. However, as the GHG reduction potential of certain actions is limited when modelled against the increasing uptake of electric vehicles, these actions must be studied in greater detail to assess overall feasibility. As a result, only high level cost estimates were created for these scenarios, which are based on estimated increases in the current TTC operating budget of approximately 22-27 per cent, depending on the scenario. These increases would be intended to cover some of the additional costs associated with service expansion and enhancements. More detailed, long-term costing will be undertaken as feasibility studies and implementation plans (including capital and service plans) are developed.
Email exchange, op. cit.
Elsewhere, there are general estimates of the money involved. Note that pre-pandemic fare revenues were about $1.2 billion annually. As described below, road fees would not offset the lost fare revenue let along the cost of additional transit service.
Expanded access to transit is an equity and efficiency measure at the heart of the net zero scenarios
A major investment in the NZ scenarios is in transit system enhancements, totalling around $1.5 billion per year. Free transit is introduced which also forfeits revenues of $2 billion per year on top of these investments by 2040. These costs are partially offset by road fees, which generate just over $1 billion per year. Providing free, widespread transit is a key equity measure, ensuring access to jobs and services for all in Toronto. Implemented correctly, the measure stands to increase the efficiency of travel in the city through reduced congestion and car use, amongst many other potential benefits and paybacks.
TransformTO: Critical Steps for Net Zero by 2040, p. 19
The report assumes that the TTC actually has service improvements in the pipeline. This is not true as current plans only foresee a modest increase in the size of the fleet and service operated on the system as a whole. In the near term, some buses now serving the Eglinton and Finch corridors will be repurposed, and the need for buses on streetcar routes will disappear except for construction season when transit service is not at its winter peak.
A key phrase below is “some of the busiest transit routes”. This is not the entire network, and it will not produce travel time savings for everyone. Indeed, for short trips, it is the wait time for irregular service that dominates the experience, not a saving of a minute or two enroute.
Increase existing bus and streetcar service levels to encourage shifts to low-carbon, sustainable transportation
The TTC’s 5-Year Service Plan and 10-Year Outlook aim to move people more efficiently on transit using enhanced service levels and priority bus lanes to improve reliability, speed and capacity on some of the busiest transit routes in the city.
Short Term Implementation Plan, Point 9, p. 5
The plan assumes that tolls on fossil-fueled vehicles will pay the freight for increased transit costs. As shown in the quotation above, the projected revenue comes nowhere close to paying for improve transit service and fare elimination. Tolls will “help subsidize” transit, but a big gap remains.
In the modelled net zero 2040 pathway all personal and commercial vehicles are electrified by 2040, and rail and air-travel GHG emissions are eliminated by 2050. Transit is free, and tolls are paid by fossil-fueled vehicles to help subsidize transit costs. Transit service is more frequent, and there are exclusive bus lanes on key routes. In this pathway 75 per cent of trips under 2 km are walked, and 75 per cent of trips under 5 km shift to bikes and e-bikes by 2040. Many people telecommute, eliminating some of their trips.
Implemented as a package, these activities would provide transportation alternatives to enable transportation to reach net zero.
Climate Action Pathway, p. 64
There is some hint of what is contemplated in the Technical Report. As noted above, the tolls might “partly offset” the cost of free transit, but a large gap remains. Yes, that proposed toll is 66 cents/km.
The NZ Scenarios call for significant investments in transit, including converting one lane of traffic to exclusive bus lanes on all arterials, increased service frequency on all transit routes (bus by 70%, streetcar by 50%, subway off-peak service to every 3 minutes), and expanding the rapid transit network. The cost of making transit free in the NZ Scenarios is partially offset by tolls of $0.66/km on all arterial roads. As a result, alongside increases in active transportation (see the previous section on physical activity), per-household transportation costs decrease by 76%. This is even more significant for people who do not own a car and for whom costs are reduced by 100%. From an equity perspective, this is significant, as it frees up money for low-income populations to meet other needs and provides them with access to services and job opportunities that might have otherwise been out of reach. Infrastructure investments need to be distributed and directed to low-income areas to ensure that these benefits do in fact reach low-income residents.
Technical Report, p. 127
Funding dependent on fossil-fueled vehicles is an issue for transit subsidies based on gas tax revenue with more efficient vehicles and electrification.
A problem already exists in jurisdictions that depend on fuel taxes as a source of transit revenue because of changes in travel patterns and improved fuel efficiency in vehicles. This will be compounded by a shift to electric vehicles. I asked the City if this had been taken into account. They dodged the question saying, in effect, we haven’t done the math yet.
Q: In the Climate Action Pathway at p. 64 is a statement that tolls paid by fossil-fueled vehicles will underwrite transit subsidies. Leaving aside whether such tolls could actually be implemented, there is an issue that fuel taxes or tolls are a declining revenue source because of improved vehicle efficiency and, under the Net Zero plan, a declining population of vehicles that will pay the toll. Lost tax revenue through fuel efficient cars is already an issue in some jurisdictions that depend on this revenue source for transit funding. Moreover, if there will be more transit service, the cost side of the equation will not simply be the foregone fare revenue, but the cost of additional service. How do you plan to pay for the transit subsidies if the fleets that would pay the tolls will eventually be replaced?
A: That section of the Climate Action Pathway describes only the modelled scenario in the technical report, which informs the strategy. It does not reflect the funding plans. Detailed implementation of any future road tolls would require extensive planning, consultation and approval by City Council. The transportation targets in the strategy are intended to promote shifts in modal split by investing in transit to also reduce road congestion. The source of funding of any transit subsidies is not yet known and will require further analysis.
Email exchange, op. cit.
Operation of electric vehicles is expected to be cheaper than the existing bus fleet. The TTC has yet to produce any plans showing how this would affect service levels and maintenance requirements. They have a distressing habit of enlarging the fleet without providing more service, and this must be reversed to achieve the claimed savings. Note, however, that the reliability of a bus is meaningless if it never leaves the garage because there is no budget to pay an operator to drive it.
Operating more service and a larger fleet will require at least three new large bus garages. I will turn to the fleet and infrastructure requirements of the proposed service expansion later in the article.
Bus reliability and availability will increase by an estimated 25 per cent, and the total life cycle cost of zero-emissions buses is estimated to be lower than any currently available fossil fuel alternative.
Climate Action Pathway, p. 95
Toronto Puffery
The Toronto Transit Commission (TTC) has made a commitment to be 50 per cent zero emissions by 2028-2032 and 100 per cent zero emissions by 2040. An interim target is for 20 per cent of TTC buses to be zero emission by 2025-2026. The TTC is currently operating 60 battery-electric buses, the largest zero emissions fleet in North America, and will be purchasing another 300 electric buses between 2023 and 2025.
Climate Action Pathway, p 95
The canard about Toronto having the largest zero emissions fleet in North America has been trotted out regularly by the TTC, and is repeated by the City. I challenged this claim, but the City wormed their way around this by talking about “electric buses”. The last time I looked, trolley buses are electric buses. Toronto would do well to concentrate on real improvements, not on false claims to be “number one”.
This is an example where simply talking about benefits without the self-congratulations would be useful, if only to acknowledge that Toronto is not the only place where vehicles run today on electricity. Toronto ditched its trolley bus system three decades ago thanks to the blandishments of the natural gas lobby and the connivance of TTC management. The current crew at TTC did not even know that Vancouver had produced a large study of zero-emission buses until I told them about it.
The City tries to wiggle out of its misrepresentation by saying they were talking about electric buses, but the text actually says “zero emissions fleet”, not “battery buses”. For the record, Vancouver has a large rapid transit network, and San Francisco has both streetcars (not just cable cars) and the BART subway.
Q: The Climate Action Pathway at p. 95 claims that the TTC operates the largest zero emissions fleet in North America. This is not true. Vancouver, Seattle and San Francisco have large, modern electric trolleybus fleets greatly outnumbering the 60 battery buses in Toronto. Vancouver’s power comes from Hydro, Seattle’s is mainly hydro, and San Francisco is about half renewables with a goal to move to 100%. It is surprising that a thorough report on electrification does not mention large existing systems. Do you plan to correct the report?
A: The statement on page 95 about fleet size refers to electric buses. We do not plan to change the wording in the report at this time. The TTC is currently operating 60 battery-electric buses and will be purchasing another 300 electric buses between 2023 and 2025. The TTC also operates streetcars and subways, which rely primarily on electricity. As is noted throughout the reports, both a shift towards electrification as well as a clean electricity grid are required to meet our net zero target.
Further opportunities to accelerate the Green Bus Program will be identified and reported on in the second quarter of 2022.
Email exchange, op. cit.
Better Transit Service: Fleet and Infrastructure Implications
The Technical Report proposes a substantial increase of transit service with:
- 70 per cent more bus service
- 50 per cent more streetcar service
- Maximum 3 minute off-peak subway headways
For the subway, this does not require any additional trains because it is (a) outside of the peak period and (b) a wider headway than the pre-pandemic peak. The only additional cost is to operate the trains.
On the surface networks, the first question is whether this improvement applies across all time periods including evenings and weekends. The effect on peak vehicle requirements would depend on:
- Whether the percentage applies across the board so that, for example, if there are 1000 buses running today, there would be 1700 buses running tomorrow.
- How much saving can reasonably be expected from the benefit of transit priority lanes on major arterials. Experience to date suggests that this might be at best 10 percent, and not necessarily over the entire route.
- How much the fleet utilization for streetcars can be improved through a combination of major streetcar overhauls (warranty repairs) and improved reliability of vehicles.
- How much the fleet utilization for buses can be improved through both the reduction in the average age of buses from nine to six years, and the expected higher reliability of electric buses compared to diesels and hybrids.
Streetcars:
- In January 2020, just after the retirement of the CLRV fleet and the arrival of the last of the Flexitys from Bombardier/Alstom, the peak streetcar service used 162 cars of a fleet of 204, a spare factor of almost 26 per cent. This did not include cars for 503 Kingston Road or 505 Dundas which were operating with buses. These would take about 20 Flexitys for a total of 182 in service, or 228 including spares.
- The TTC has 60 new streetcars on order for delivery starting in 2023.
- An increase of 50 per cent in peak streetcar service with no offsetting transit priority benefits would require 273 cars for service, or 341 including spares at 25 per cent. This is about 80 cars beyond the capacity of the existing facilities, allowing for planned changes at Hillcrest for streetcar storage. In turn, this would require a facility larger than either Roncesvalles or Russell carhouses, but smaller than Leslie Barns.
Buses:
- In January 2020, the peak bus service used 1625 buses, although 50 of these were for construction effects (Crosstown) and 58 operated on streetcar routes. Therefore, the basic bus network required 1517 buses.
- The total fleet numbered 2095 buses for a spare ratio of 29 per cent, a very high number by industry standards where 20 per cent is more common.
- An increase of 70 per cent of the basic bus network would require 1062 buses plus spares (another 200+ vehicles at a conservative 20% ratio) without any allowance for transit priority time savings, this might be reduced by ten percent, but the number is still very large.
- This number of additional buses would require at least three new large bus garages. TTC currently plans for a tenth garage in the late 2030s, and so this would be a major shift from their plans.
In both cases, there may be some reduction in peak requirements if the “peak periods” never return, but we know already that on some busy transit routes, demand was very strong late in 2021 before the most recent pandemic wave.
In any event, the number of vehicles and the facilities they will require to achieve the proposed level of service improvement is very substantial. The search for property will be difficult and it could well compete with other City priorities such as housing. Some co-hosting may be possible, but this would have to be designed in from the start.
Where transit priority is implemented, it must not be seen simply as a way to cut costs without improving service. If the only effect of a red lane is to allow the same service level with fewer buses, then from a rider’s point of view service capacity and frequency have not changed.
A Planned Tenth Garage
The TTC recent considered a report about acquisition of property that would be used, eventually, for their tenth garage. Here are a few excerpts of interest.
Note that the TTC’s projected fleet growth is only 15 buses per year, less than one per cent for a fleet of over 2000 vehicles.
With rail expansion projects opening over the next several years, the purchase of articulated buses and new streetcars and new transit priority initiatives such as the one recently implemented Eglinton Avenue East, the shorter term need for growth in TTC’s bus fleet can be accommodated through the reallocation of existing buses. These projects include Line 5 (Eglinton Crosstown LRT) and Line 6 (Finch West LRT). Consequently, the need for a new bus garage, previously identified for 2028 has been
moved out to 2038.…
Using the projected growth rate of 15 buses per year, this results in a fleet that will be approximately 15% (290 buses) over garage capacity by mid/late 2030s. Given this, there may be a risk for operational inefficiencies in both storage and maintenance of buses. However, the bus garage capacity projection does not reflect the potential impact of bus electrification (e.g. space required at existing garages for charging equipment, impact of on-route charging on garage storage requirements, etc.), nor does it consider the potential space optimization of existing garage facilities, (e.g. decked employee parking to free space for additional hoists and buses), with both of these factors currently under preliminary study by the TTC.
…
Notwithstanding the fact that there may be variability in the ridership demand into the late 2020s and facility capacity projections that require further study, it is reasonable to conclude that a 10th garage and maintenance facility will be required by the late 2030s and that property acquisition in anticipation of this future need is required. Large parcels of industrial land for these purposes are rarely available, particularly within city boundaries. In addition, substantial time is required to design, finance and a construct a new bus garage and maintenance facility.
Property Acquisition for New TTC Bus Garage and Additional Operational Uses, December 8, 2021
For comparison, McNicoll Garage has a capacity of 250 buses and a cost of $169 million as of November 2020.
Any plan that could trigger the need for three new garages and a carhouse will be challenged to find land, and it will have to compete with other city programs. Ideally, especially for electric buses, joint facilities for other uses like housing would be a consideration, but this would require commitment to both the housing and the transit facility in the comparatively near future.

As someone pointed out in another post, the TTC already has an overhead department for streetcars. Choose some heavy use bus routes, string up some wires and order some darn trolleybuses for goodness sakes!
LikeLike
As a regular TTC user, it bugs me that the transit apps are inaccurate. Comparing the arrival time of buses on several apps, they tell me that a bus will arrive in 1 minute. The minute passes and no bus. The apps get refreshed, and one says a bus will come in 12 minutes, while the other says 15 minutes. 8 minutes later a bus arrives, but did not appear in the app.
Could this be a result of a COVID-19 virus in the apps? Are the times “suggested” arrival times, since they don’t seem to be real time.
Steve: There appears to be a problem with the timely “push” of data from the TTC’s tracking system to the apps. They are reporting info based on where buses were some time ago.
LikeLike
Hey, no one said the city was good at planning transit!
LikeLike
TTC stated “The TTC also operates streetcars and subways, which rely primarily on electricity.”
What else do they rely upon? Coasting?
Steve: Actually that was a City report, and it was their staff who made that comment. Streetcars and subways run on electricity, but subway extensions run on hot air. There is a tiny amount of diesel consumed by the subway for work trains that operate in areas where power has been cut for maintenance.
LikeLike
This ‘greenwishing’ and ‘Not Zero’ exercise is much like how we ‘plan’ for system expansion – really badly and ignoring a host of basic facts to tilt towards whim, or what some want, not what the numbers/facts/science indicate.
It’s not necessarily the fault of those involved in it all, but truth-tellers get relatively short shrift and less time to displease the overlords/rulers.
We’re NOT being honest about all of the GHGs from ‘Toronto’ as a basic starting point. We are avoiding counting a basic like concrete, as we don’t use any of it, but globally c. 8%, if not a larger emitter than most countries. Honesty would have the City starting to account for all of the Agency/Board/Commission usages of concrete, Yes, it’s a Task, but it’s a Massive Tonnage, and denial is preferrable to keep us ‘green’.
This might be one of the Scope 2, or 3 emissions, if not 4, and while it’s complex, there’s a HUGE amount of embodied carbon in the materials and ‘stuff’ of our city/consumption, and hey, if we made complex streetcar track things in North America, that’d help in a few ways. All aluminum also tends to have nasty permanent GHGs associated with smelting too, (though haven’t tracked this issue that much recently), and that is a massive quantity of warming as well, oops, (and yes, include imported aluminum on/of bikes too please).
There’s also a HUGE denial of a massive source of uncounted GHGs on our doorstep – the contributions of Pearson airport, and jet travel is a ‘fall-between-cracks’ sort of denial – but the warming is heightened from the height of emissions, and if the volume of Pearson air travel is equivalent to the population of Canada, plus air freight, hmm.
Also, some expanding foams in insulation have HCFCs in them, so miracle tech and foam can have some impacts, if we want to be honest, and we tend not to want that.
A huge help for the competition to the TTC would be to have safe, connected routes, (which is in some ways well underway now, finally, 30 years after Toronto Target), but we also need to have safe riding along the roads with streetcar tracks, where there is pronounced danger from irregular rubble on the margins of tracks, and it’s widespread.
It’s understandable that the City/staff is having to skirt around doing more on transit, given how the City/transit has been smashed about with the Dougtator, and the federal level/Libs not really worrying too much about it, because it helps them look good, except what about defending democracy in Canada, let alone trying for real value for the billions in ‘help’.
Like more than a few other instances through the years, (though yes, some reduction), the City/pols tend to do the nice-sounding things, but hey, having user pay for the private cars that are enjoying tremendous hidden subsidies in anywhere near the ratio that transit users now pay for transit. Very specifically, if in 1996 Vancouver determined that each car had a $2700 avoided cost each year, where’s the Vehicle Registration Tax of $500 each, this year?
We tend towards to being climate criminals; hopefully we’ll get some liability assessed agin us, and especially those ridings that voted for Conservatives, because they’ve been dragging us back, and have been for years if not decades. And now it’s pretty late, oops, sorry kids.
Steve: I was so busy being appalled at the bad methodology — assuming a huge shift to short trips and removal of trips from transit — that I did not go into questions like how much is created by things like subway construction that isn’t mention at all except as a great thing we are doing to get people out of cars. I have a sense the agenda was to really show what cycling and walking can do, but in the process some ridiculous assumptions have been made about taking people *out* of transit to puff up the cycling counts. As I said in the article, Liberty Village is within the 5km ambit where they propose shifting trips away from transit. Such a proposal would be DOA if anyone bothered to read far enough into the details of the report.
Re streetcar tracks: Yes I agree there is a big problem with how they are built and the way that margin between the outer rails and the curb lane pavement often falls apart and is left as a mess. This is one of many problems with City road maintenance. Maybe we should also talk about the SOGR backlog caused by pouring every dollar into the Gardiner/DVP rebuild. A lot of concrete there too.
In the budget presented January 13, there is no money for service improvements and the fleet replacements are not fully paid for either. But, hey, we’re building subways and that’s all that matters, especially with someone else paying for them.
I fear that the NZ2040 plan will be stillborn thanks to shortcomings in its proposals and their underlying rationale, as well as the inevitable putting off to next year what we do not want to spend money on today.
LikeLike
it’s hamish wilson, though sure maybe I’m a ham sometimes.
Steve: Oink!
LikeLike
It’s forecast that tomorrow and later in the month that the weather in Toronto will be around -20•C. It would be nice if the transit app information being given out is accurate. Don’t want to step outside expecting the next vehicle will be coming in a couple of freezing minutes, instead of turning into icicles for 20+ minutes.
Steve: The TTC claims that there is no problem with the data feed. There may be buses where none appear in the predictions (extras, redirected vehicles), but there should not be predictions of vehicles that do not show up.
LikeLike
Thank Steve, and commenters, and to go into a bit of detail on the Liberty Village mobilities, and the City has tended to grab the tax revenue and not deliver, either bike nor transit, but they were keener on a road, including many progressives ie. Mr. Pantalone, even though the 1992 WWLRT EA modelled out (as it emerged a few years in to the ‘where’s the transit option here?’ fight. Which, while the road mostly withered, and GO Transit and the province were smarter to lengthen GO trains in the corridor for much more congestion relief for far less $$$, the City tended to falter, though clearly the King RoW was/is very cost effective for the boost in transit.
Steve would know the King RoW history far far better than I, and it’s been a real boon for transit but it’s a bit far up for much of Liberty Village maybe, and it’s also a bit short.
Steve: The cluster of development in “Liberty Village” has now grown north to Queen Street. You may have noticed all those high rises along King itself. King is in the middle of the node.
So with biking, the 2001 Bike Plan had Liberty St. as a suggested bike route, and since then, haven’t even got the feeble sharrows on the road, nor much else, though the City finally did the Richmond/Adelaide bikeway, also in the 1992 report, I think #2 after Bloor/Danforth. But there’s been very good usage of the R/A bikeway, but one set of issues is that it kinda fades away after Niagara, and is decidedly incomplete when it gets to Strachan, and for some, ‘sharing’ a lane with impatient cars isn’t that much fun. (King is much better than it was for biking with the ROW, yes, but I don’t know numbers, nor do I have much direct experience with it.)
With the real weaknesses in enforcement and legal protections of cyclists, not all people are going to be embracing it, and so it’s beyond disappointing that the suburban carservatives are again denying safety to urban settings as per this week’s denial of calling most of the old core a community safety zone with a firm option of a slower/30kmh speed. The rule of the old core by the car-driving suburbs quashed the initiative in a 3-3 tie, with Councillors McKelvie, Minnan-Wong and Pasternak embracing car dominance and thus, dangers and more climate change, in my view. Suburban dominance has also torqued and destroyed transit planning/doing in the core as well, as the place for heavy infrastructure of subways is in the core, not lower density suburbs, nor over-extending brittle transit spines. But of course these and other Councillors will be happily and seriously! against climate change.
I’ll send Steve a screenshot of Paris’ 2014 GHG accounting that is far more realistic on the air travel Problem etc. and should likely have a different set of policy outcomes; and I’ll try to dig up the C40 link.
If we are at all serious about the climate urgency, we have to address air travel/freight. Monbiot is good on this topic; and if we deny there’s an issue, than we think it’s Just Fine if not Needed! to improve transit to the airport vs. say, Eglinton Ave. E. LRT, etc. etc.
Steve: The City NZ2040 report talks about use of biofuels in aviation, but this is outside of the City’s jusisdiction. Remember also that Pearson is not in Toronto, only the Island Airport.
And if we’d reduced our flying/frying, then how much better might the pandemic have been? Only some science/scientists get to be listened to.
LikeLike
Responding to “wklis” comments I would suggest instead of solely relying on the app predictions try to memorize or understand the buses on the map. For example I take the 113 frequently and say the bus is at Birchmount I can reliably say that it will take about 6 minutes to get to my stop. Now as soon as I see the bus move from Birchmount on the map on whichever app I am using I will start leaving my house. Transit predictions can be easily skewed and sometimes it’s because of new schedules, heavy traffic (tip: check google maps if a bus is stopped for a long time at a point where it usually moves freely – a heavy red line on that road in google maps indicates its stuck in traffic). Obviously on a more frequent route this might not be easy but simply looking at a map of the predicted vehicles can easily show the gaps to avoid and try to catch the buses that have decent spacing.
LikeLike
A not-small quibble on Pearson not technically being ‘Toronto’…. Most of those frying in to Pearson are coming to ‘Toronto’, not Brampton, or Georgetown. It is known internationally as ‘Toronto’, and much of the justiifcation for wasting the corridor space of the UPX was to serve the Airport, not the communities through which it passes. Also, I’m sure much of the air freight, not just c. 39M passengers or whatever it is, comes in to the City. So if we led the world in the Toronto Target from 30 years ago, (at least in the theory), why not be realistic about the massive contribution of the main airport? Oh, money, and jobs, and so what if the Arctic permafrost melts, and we’ll add more hot air about doing things about climate change as our ‘contribution’….
Steve: I am saying this in the context of the City’s NZ2040 plan which only considers emissions within Toronto, not caused by Toronto. Their methodology.
LikeLike
I was able to find the chart indicating how MASSIVE air travel is within the Paris GHG count, and it’s p. 16 here.
LikeLike