Humber Loop QEW Realignment 1973-74

There was a time when the curve between the Queen Elizabeth Way and the Gardiner Expressway at the Humber River was rather tight. In 1973-74, while the highway structures were realigned, the Long Branch car continued to run through the site on a single track with signals.

Rather than overhead contactors common on single track street railway operations everywhere, the TTC opted for subway-type track circuits to control access. With a lot of water in the construction site, especially through winter, “track down” conditions showing the presence of a “ghost” car, were an ongoing problem. Nonetheless, through service continued over the single track, first on the old alignment, and then on the new one.

Special work for the crossovers was mined out of the street. One location was on Dufferin north of King and the other on Spadina south of King.

The Dufferin crossover had been used originally for a shuttle service to the CNE western gate that operated with double-end equipment. Later, this location was a point where the TTC snow plows reversed direction. Yes, there were official routes for the plows and sweepers when the TTC still had such cars. Ironically, after the work at Humber, the TTC re-installed the crossover on Dufferin even though by then the snow fighting fleet that used it had been retired.

The crossover from Spadina was last used in 1948 when double-ended streetcar operation on the Spadina streetcar route (along with the route itself) ended, and it had been buried in asphalt for years.

Access to the construction site was much more relaxed than today when, of course, the streetcar line would have been shut down and replaced by buses.

The photos with Peter Witt cars were all on charters. The Tour Tram never got this far west.

Ontario Supports Transit? Metrolinx Subsidy Cut By 30% (Updated)

Updated June 27, 2019 at 6:00 am:

Metrolinx has announced that the 38 bus routes, previously cut in the name of “efficiency”, will continue to operate two trips in each of the peak periods. See the end of this article for details.

On June 27, 2019, the Metrolinx Board will meet to consider various items including their 2019-2020 Business Plan and 2018-2019 Draft Annual Report. This will be a challenging year for Metrolinx because its subsidy will fall from the budgeted level of $467 million in 2018-19 to $321.2 million in 2019-20 thanks to the machinations of the Ford government. (The amount provided in the 2018-19 government spending estimates was even higher than Metrolinx’ budget figure at $505 million, but actual requirements were lower.)

There was no press release or photo op announcing this change, and it was buried in the detailed estimates for the Ministry of Transportation. Funding for Metrolinx operating subsidies appears under “Vote 2702” within the estimates.

For 2018-19, this contained many more entries than the following year:

Urban and Regional Transportation
Salaries and wages                                   $  6,744,300
Employee benefits                                         834,500
Transportation and communication                          305,600
Services                                               13,638,700
Transfer payments
 GGRA – Electric Vehicle Education 
  and Awareness                        $  4,919,000
 GGRA - Transportation Demand 
  Management Funding Program              1,000,000
 Community Transportation Grant 
  Program                                 3,000,000
 GGRA - Other                             8,000,000
 Metrolinx Operating Subsidies          505,290,600
 Electric Vehicle Incentive 
  and Infrastructure Program            102,774,100
 GGRA - Green Commercial 
  Vehicle Program                        24,616,000
 Ontario Seniors Public Transit 
  Tax Credit                              9,700,000
 Participation and Awareness Grants         450,000
                                       $659,749,700
 
Subtotal                                             $681,272,800
Less: recoveries                                    ( 173,832,200)
Total operating expense to be voted                  $507,440,600

The corresponding list for 2019-20 is much shorter and smaller. The Metrolinx subsidy has fallen, the green subsidies are gone, and there is an unexplained cut in the Seniors Public Transit Tax Credit.

Urban and Regional Transportation
Salaries and wages                                   $    780,100
Employee benefits                                          96,600
Services                                                  189,800
Transfer payments
  Metrolinx Operating Subsidies         $321,214,300
  Ontario Seniors Public Transit 
   Tax Credit                              3,578,600
  Participation and Awareness Grants         450,000
                                        $325,242,900

Total operating expense to be voted                  $326,309,400

Last week, I asked Metrolinx how they planned to deal with this cut, but they are still looking into it. Meanwhile, the reports before the Metrolinx Board give some indication of what is happening.

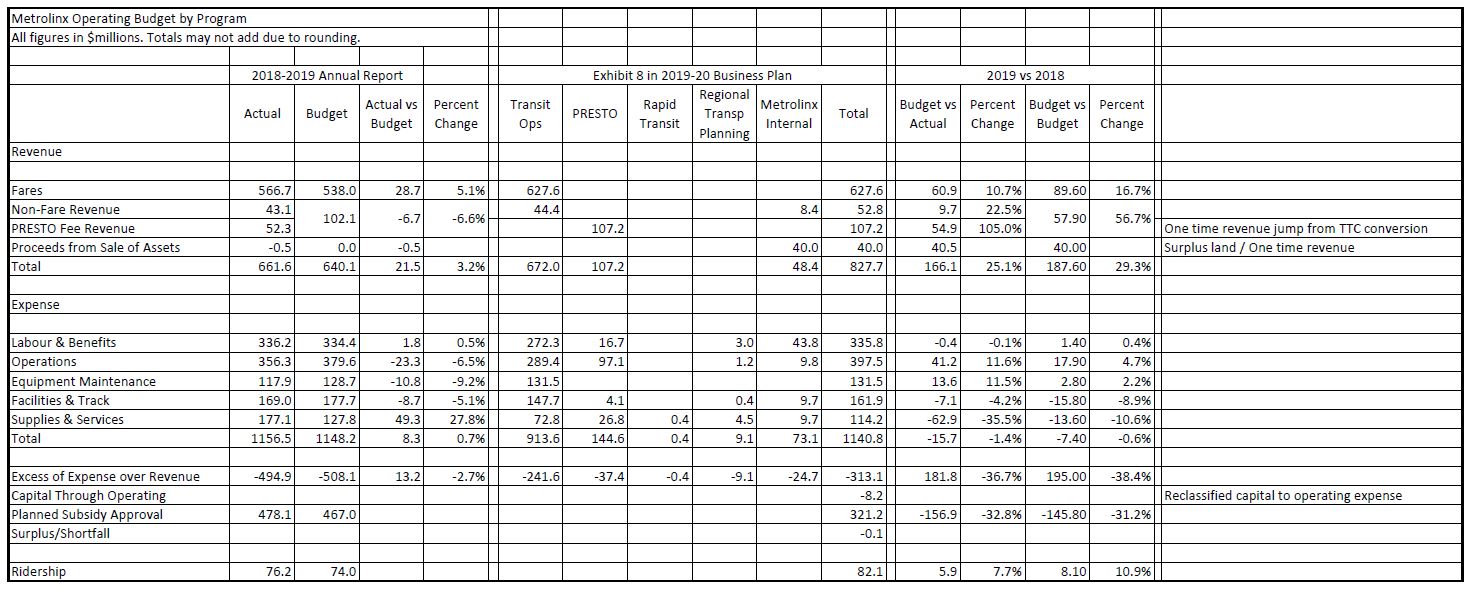
The table below consolidates information from the Annual Report for 2018-19 and the Business Plan for 2019-20.

Notes:

  • Capital lines such as contributions from the province and amortization of existing assets have been removed to show only the operating revenues and expenses.
  • Presto fee revenue projections for 2018-19 are not available because Metrolinx did not publish a Business Plan for that year. Actual results are shown separately in a chart on page 26 of the Annual Report.
  • UPX service was consolidated with GO Transit operations a few years ago and its financial results are not reported separately.

[The same table as a PDF: 2019V2018_BudgetAndPlan]

2018-19 Results

Thanks to a better-than-budgeted year in 2018-19, Metrolinx is already one step ahead of the game, at least on a budget-to-budget basis. This is not unlike the situation commonly seen at the TTC where the actual results are better than budget, and this gives a leg up on the following year’s requirements.

Fare revenue was 5.1% above budget, although other revenues were below budget giving an overall increase of only 3.2%.

The wide take-up of Presto by TTC riders with the elimination of legacy fare media drives a big jump in Presto fee revenue for 2019-20. A comparable jump in revenue will not be available in future years to offset rising costs. However, Presto operating costs have come down a lot. This is good to see, but such drops cannot be reproduced indefinitely for future savings.

PRESTO will also continue its work on the ambitious objectives of delivering new forms of payment (PRESTO Tickets) and reducing its operational costs by 25%. These will remain focus areas heading into the new fiscal year with significant progress having been made on these objectives to date. In 2018-19, twelve cost savings initiatives were identified and savings targets for the year were achieved with the largest contributor being vendor consolidation and maintenance optimization. Moving forward, PRESTO’s 2019-20 operating budget is already reduced by the 25% cost savings and PRESTO will include the execution and realization of savings from many of the remaining opportunities. [Annual Report, p 41]

Metrolinx may be considering a shift of more front line support to transit clients (e.g. the TTC). This could improve maintenance turnaround times, but also would represent a transfer of costs between vendor and client.

Payment Equipment: Over time, reduce PRESTO’s role in managing equipment, focusing on facilitating transit agencies to directly purchase fare equipment and associated services. [Annual Report, p 43]

On the expense side, the total was only 0.7% over budget although this was achieved by a variety of reductions offset by a large increase in “Supplies and Services” which includes consulting fees.

Although there was a budget of $508.1 million for required subsidy, the net amount came in at $494.9 million.

Of particular note in 2018-19 is the considerable over-budget spending on “Supplies and Services” which includes consulting contracts. This was mostly offset by underspending on Operations, Equipment Maintenance and Facilities & Track.

2019-20 Budget and Plan

For 2019-20, fare revenue is expected to grow by 16.7% over the previous year’s budget amount, or 10.7% over the actual results. This comes from a projected 7.7% rise in ridership over 2018-19 actual results plus the effect of the current year fare increase. Fares account for about three quarters of total operating revenue, and overall results, as on the TTC, can be influenced by how closely Metrolinx hits its ridership expectations.

What is less clear is how any ridership growth will interact with proposed fare improvements including reduced costs for short trips and better co-fares with local operators, notably the TTC. Although Metrolinx crows about how Presto “enables” various discounts, these are not available to all riders.

  • Users of the UPX, the much more frequent service in the Weston corridor, recently lost their fare discount for trips transferring to/from the TTC, as well as their monthly loyalty fare cap.
  • TTC riders who travel with monthly or yearly passes on Presto do not receive any discount for GO+TTC trips.
  • Co-fare discounts for seniors and students are lower than for adults, and as with adult riders, these do not apply to pass holders, only to full single fare rides.

If there is any move to better “integrate” fares for all riders, not just those paying full fare, this will be a cost either to Metrolinx or to local transit systems depending on the cost sharing arrangement. Metrolinx’ attitude to subsidies for fare reductions is that this takes money from service provision, and they expect other transit agencies to benefit from added ridership and, by implication, to provide fare subsidies at the local level.

The budget also includes one-time revenue of $40 million for sale of surplus assets. Although this helps to reduce the call on subsidies, it creates a gap that will have to be backfilled with other savings or revenues in future years. The Business Plan describes this revenue as supporting the Transit Oriented Development Program, and yet its actual effect is to reduce the operating subsidy.

On the expense side, there will be a big drop in “Supplies and Services” over previous year actuals, but a smaller drop on a budget-to-budget basis because of the overrun in 2018-19. Spending on “Facilities and Track” will also fall in the coming year. It is unclear whether this represents a reduction in the quantity and quality of maintenance, or if some sort of “efficiency” program is underway.

The various categories of expense and revenue are described in the Business Plan:

In the 2019-20 operating budget, the largest allocation is operations expense, which accounts for 35% of the total operating budget. This includes items such as support train crew wages, train control dispatch and PRESTO operations.

Next, labour and benefits account for 30% of the operating budget, supporting transit ridership growth. Facilities and tracks account for 13% of the operating budget, and include rent, property taxes, hydro, winter maintenance and other facility repairs. Equipment maintenance accounts for 11%, covering support services, inventory, inspections and yard operations. Finally, supplies and services represent 11% of the budget, which includes all types of professional services, bank fees, staff development and advertising.

Transit operations fare revenue is based on a year-over-year increase in ridership and GO fare changes implemented on April 20, 2019.

Non-fare revenue sources typically include billboard advertising, track usage fees from corridor ownership, transit operations partnerships on UP Express line, interest on working capital and reserved parking fees. In addition to these more typical sources of non-fare revenue, the total PRESTO fee revenue and proceeds from sale of assets to support the Transit Oriented Development Program are projected to be $107.2 million and $40.0 million for 2019-20, respectively. [p 62]

At a recent Metrolinx Town Hall, the question of the drop in subsidy was raised from the floor, and CEO Phil Verster deflected this by saying that Metrolinx is improving efficiency in the use of its assets. This is not entirely true in that the budget mixes one time and recurring revenues, and depends on strong growth in Presto fees both in the current and future years.

Part of that “efficiency” is the reallocation of services, something that happened recently with the removal of service from a few GO bus routes without notice or consultation. Meanwhile, GO added rail service to Niagara Falls that carries even fewer passengers than the bus services that were cut. Even though there is one train a day each way at hours when almost no ridership is attracted, Metrolinx trumpets this new service as an “accomplishment”. Clearly the political influence over Metrolinx decisions continues from the Liberals into the Conservative government.

Updated June 27: Limited service on the 38 Bolton/Malton service will be preserved pending implementation of a local replacement by the Town of Caledon. See details at the end of the article.

There is a fundamental problem with the overlaps and gaps between GO as a regional operator and local transit systems, where they exist. When GO decides to cut a service, there may be no local route to take up the slack, or it may not provide as convenient a service. This shows the degree to which Metrolinx is unaccountable and is a fundamental issue in “regional integration”. Although they are looking at alternatives such as shuttles with smaller vehicles or autonomous vehicles, the reality is that routes will vanish until Metrolinx gets around to serving the area again.

Videos from Town Hall:

Looking Ahead to 2022

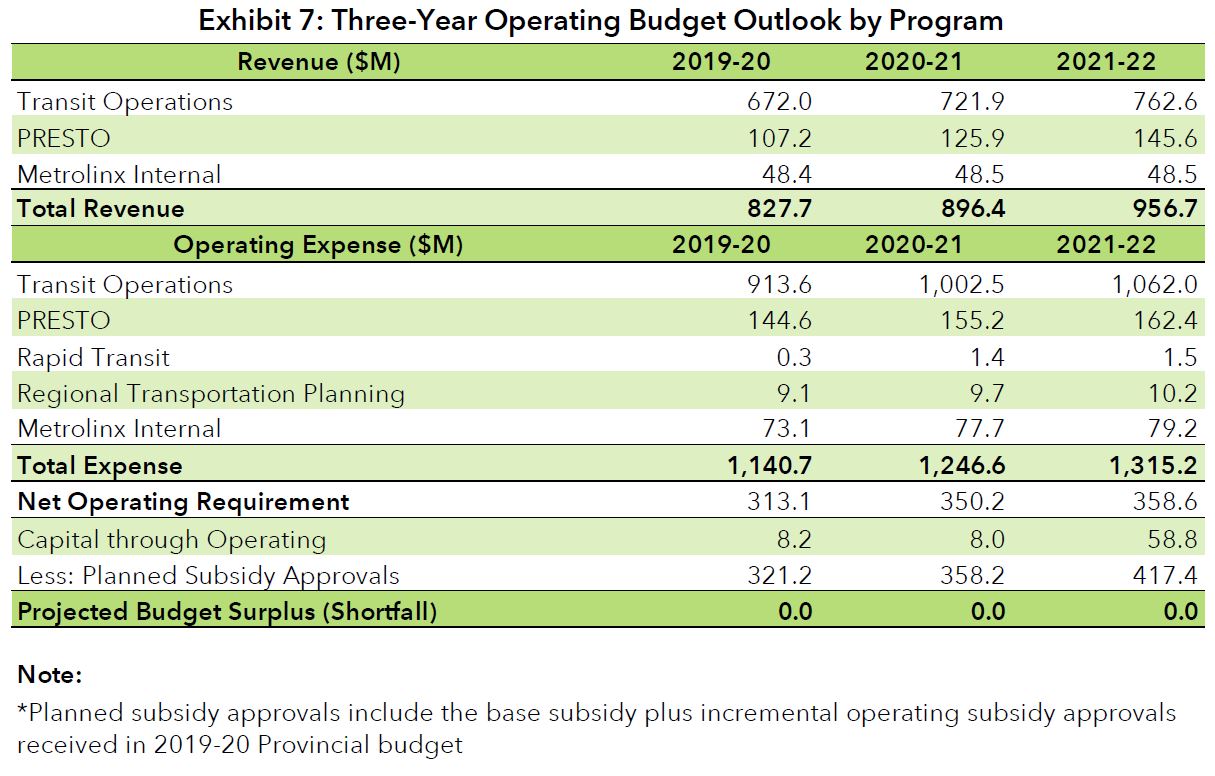
The three year projections for Metrolinx operating revenues and expenses are shown in Exhibit 7 of the Business Plan.

Fare revenue growth is projected at about 7% into 2020-21, and at 5.6% in 2021-22. There is no ridership projection for these years.

Presto fee revenues will also grow, but they will not keep up with projected operating costs. The $37.4 million shortfall in 2019-20 is projected to fall to $16.8m by 2021-22 thanks largely to strong growth in fee revenue. How much of the fee growth will be due to greater takeup of Presto as a fare medium and how much is due to changes in the fee structure for various Presto client systems is not specified.

“Metrolinx Internal” comprises $8.4 million in non-fare revenue plus $40 million from asset sales. It is not clear that the latter amount would actually be available in future years, and in any event this is described above as supporting the TOD program which is part of the Capital Budget, not Operating. This cannot be both a source of operating revenue and contribute to the capital program.

The “Net Operating Requirement” grows by $37.1 million in 2020-21, or 11.8%, but only by $8.4 million or 2.4% in 2021-22. Fare revenue will grow by $90.6 million (13.5%) while transit operating costs will grow by $148.4 million (16.2%). This spread is partly offset by the projected reduction in Presto costs net of fees, but the large growth in fee revenue (36%) is essential to these projections.

The big change in the third year is the “Capital Through Operating” line which consumes almost all of the planned increase in “Operating” subsidy.

What is not shown, at least not explicitly, is the effect of the opening of the Eglinton-Crosstown line planned for fall 2021. This will affect at least six months of the 2021-22 fiscal year for Metrolinx, but there is no indication of the associated costs and revenues, let alone how these might be split between Metrolinx and the TTC.

Updated June 27, 2019 at 6:00 am

Following pushback at the Town Hall on June 24 and intervention by the Mayor of Caledon, Metrolinx has announced that it will retain limited peak service on the 38 GO bus pending implementation of an alternative local service by Caledon. In the best Twitter tradition, there is a typo.

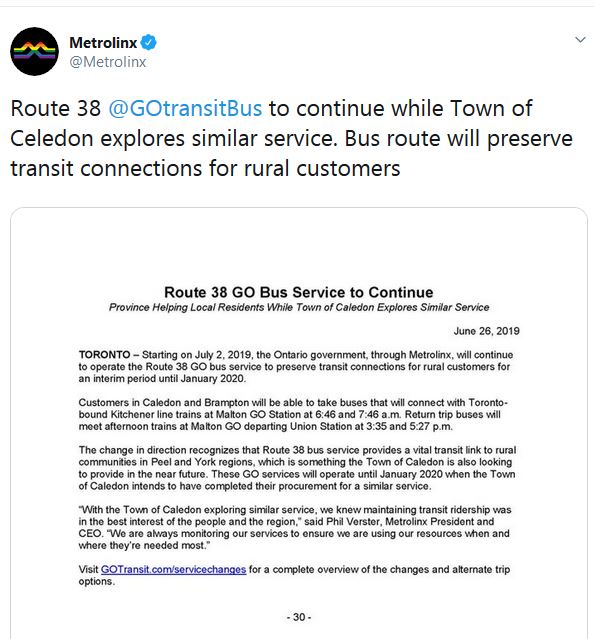
The existing schedule provides 6 and 7 trips on route 38 Bolton/Malton in the AM and PM peak respectively, and 2 in each peak on the 38A Bolton/North York. The new schedule goes into effect on July 2, 2019 and provides only 2 trips in each peak period on the 38, and no service on the 38A. The GO Transit Service Changes page encourages riders to use alternative means to make their trips.

To what extent this is a “victory” for riders remains to be seen with an agency and a government that are deaf to consultation.

TTC to Presto: Deliver What You Promised

At its meeting of June 12, 2019, the TTC Board considered a report and presentation setting out the many shortcomings of the Presto fare card system.

Presto implementation has been underway since a 2012 master agreement between the TTC and Metrolinx, and they are now at the half-way mark in a 15-year contract. In spite of this, some functionality included in that contract has not yet been provided, and there are no service level agreements (SLAs) in place setting out basic issues for system performance and financial penalties to Metrolinx for failure. Indeed, although the TTC has claimed revenue losses thanks to problems with Presto, Metrolinx has not accepted that it owes the TTC anything.

Until quite recently, Presto, like so much that comes from Metrolinx and Queen’s Park, was a “good news story” where TTC riders switching to the fare card drove fast growth for that system. The convenience of Presto versus tokens and the disappearance of the Metropass shifted over two-thirds of TTC riding onto Presto. The chart below shows the breakdown for April 2019. The Presto share is expected to reach 95% when legacy media are withdrawn.

However, the good news hides problems with the system as it exists both for Presto users and those who might shift to that system in the future.

The heart of Toronto’s problem with Presto lies in the way the system was imposed. TTC was prepared to go with an alternative vendor for a new fare card system, but were told by Queen’s Park that failure to adopt Presto would put all of the provincial subsidy programs at risk. This was a very big, heavy stick for the government to use, and it shows just how desperate they were that Ontario’s largest transit system be a client (with associated revenue and prestige) of the Presto system.

During the ongoing discussions that began in the fall 2010, the Province and Metrolinx maintained that the common PRESTO Farecard system was their recommended approach to achieving the Plan’s inter-regional policy objective of increasing cross boundary travel. The Province and Metrolinx committed to upgrade the PRESTO system to meet the TTC’s distinct and forward-looking customer, business and financial needs, including advances in fare payment technologies using open payments. The Province and Metrolinx indicated that billions of dollars of funding for some existing TTC programs which had been promised publicly (Provincial gas tax, new streetcars, Eglinton and Scarborough transit initiatives) could be in jeopardy without PRESTO. The adoption of PRESTO was thus approved in June 2011, subject to developing acceptable operating and financial agreements and confirming the funding necessary to proceed. [p 7]

Despite a competing proposal from Xerox subsidiary ACS that would cost over $300 million less than Presto, the TTC was forced to accept the provincial system.

Presto did not perform as it needed to, and contracted functionality is still not available.

The TTC entered into the Agreement with Metrolinx on November 12, 2012. The base term is 15 years (2027), with an option to extend for one additional year at Metrolinx’s discretion and an additional four years by mutual agreement. Key elements of the Agreement include:

  • Metrolinx to make modifications and enhancements to the PRESTO system to allow for an e-fare account based payment system with an open architecture using industry standards to accommodate open loop financial cards, mobile applications and future technological innovations (“PRESTO NG”)
  • Metrolinx to finance, implement and operate the PRESTO NG system and provide a wide range of “managed services” (e.g. back office operations; customer services; revenue collection and maintenance of all system field equipment)
  • In return, TTC to pay a fee of 5.25% of TTC fare revenues processed through the PRESTO system [pp 7-8]

The TTC contemplated a variety of payment mechanisms years ago.

The TTC’s Business Requirements specified both open payment and an account-based architecture, which was to have been built alongside the existing PRESTO card-based architecture. In such a system, customer convenience and flexibility would be maximized. A customer could choose to have a PRESTO card with all its fare policy benefits (e.g. fare concession, 2-hour transfer), or to get some of those benefits using a non-registered open-payment card (e.g. Visa, Mastercard), or to get all fare policy benefits with a registered open-payment card. These concepts were an essential component of the Agreement and were fundamental to the TTC’s agreement in 2012 to accept the PRESTO system versus a competitive market-based solution. [p 11]

Two key capabilities – fares for travel between transit agencies such as York Region Transit and TTC, and the move to “open payments” and an account based system – have yet to be implemented. Regional integration is hoped for later in 2019, but there is no firm date for a change to the payment mechanism.

What Are Account Based Fares?

Account based fares and open payments are closely related, and they are fundamentally different from how Presto works today.

With Presto, fare calculations and validation occur between card readers and the cards themselves. Information about the account balance and any bulk purchase such as a pass is stored on the card. This allows a transaction to occur without any link back to a central system, an arrangement dating back to Presto’s early days when wireless links from their roving bus fleet were not reliably available. However, this forces all of the payment logic into the architecture of the readers and cards constraining the functions they can support.

This arrangement is responsible for the lag between an online account update and the appearance of new “money” on your Presto card. Until you tap onto a reader that “knows” you loaded more money online, you have money in the central system, but cannot use it because the fare machines don’t “see” it.

Imagine if software had to be loaded into every phone so that it could calculate the cost of a call and maintain your account balance. That, in effect, is the complexity Presto imposes, something that should have been designed out of the system years ago.

In the case of a credit or debit card, Presto cannot “write” information onto the card, and so distance-based functions such as GO fare calculations cannot be handled. Only a flat, standard charge is possible such as an adult TTC fare, and without a two-hour transfer privilege.

In an account based system, a rider has a transit account just as they would have one for their mobile phone or credit card, and activity (trips, transfers, border crossings) is accumulated as it occurs. At the end of a billing period, the cost of these trips is calculated with any appropriate discounts such as loyalty programs, time-of-day fares or special event promotions. A Presto card, any other smart card, or a smartphone app can be registered as the rider’s transit identification, but in all cases processing happens in the “back end” with monthly billing to a bank account or credit card. Riders who have not set up accounts simply use their credit cards for pay-as-you-go billing.

The important distinction is that the system needs only track a rider’s travel, not compute the fare in real time based on “today’s rules”. Those rules can be updated in the central billing system rather than having to be integrated in the reader software and pushed out network wide. There is no need for an electronic purse or “e-purse” on the card which must hold enough money (or some form of pass) to pay for any trip a rider might take.

Presto tickets (sometimes referred to as limited use media or “LUMs”) would still exist, but Presto readers would only have to verify when the ticket expires or how many trips are left on it.

Metrolinx plans to make account based fares available sometime in 2020 with open payments in 2021, but there are no firm dates, nor is there a specification of just what functionality Metrolinx will support.

Gaps in the Presto TTC System

Other gaps between the TTC’s Presto contract and current capabilities include:

  • Flexible and dynamic fare policies/products
  • Support for other than standard fares and environments such as
  • Presto tickets dispensed as receipts for cash fares on surface vehicles
  • Device availability/reliability
  • Service Level Agreements (SLAs)
  • Third-party sales network

Continue reading

TTC Aims Too Low For Future Service

As the TTC ponders the future of transit service through a 5 and 10 year outlook, they seek public input on where transit should be going in the years ahead. The focus of this plan is the surface route network which is too often overlooked in the debates, political gamesmanship and pitched battles about rapid transit expansion. The City and Province routinely debate expansion projects with multi-billion dollar price tags, but invest little in the surface system that is essential to transit’s overall success.

There are 1.2 million people using the TTC’s surface transit (bus and streetcar) network every day. That’s 70% of the 1.7 million total number of people who take the TTC each day. [TTC website]

Many targets for improvement are included in the TTC’s work, but the basic provision of more and better service does not get the attention it deserves. For many years, thanks to tax-fighting limits on TTC growth going back to Mayor Ford and beyond, the TTC’s surface fleet grew slowly if at all. Fleet growth has gone, in part, to increasing the pool of spare buses for maintenance. Much scheduled service growth has been directed to replacing streetcars with buses and making allowance for slower traffic speeds and long-running construction projects such as the Crosstown.

AM Peak Service Buses Streetcars
April 2015 1508 202
April 2019 1606 158

For many years, the fundamental problem facing any call for better service is “we have no buses, we have no streetcars” compounded by “we have no garages”.

The political situation, historical and current, does not excuses total inaction. There are issues both inside and outside of the TTC that deserve debate: the relative importance of transit, motorists and other users of road space; the management of service so that riders receive something close to the quantity and quality advertised in schedules. However, there is no “magic bullet” that will improve transit painlessly without extra cost, management effort and realignment of transit’s political importance for more than big construction projects and photo ops.

The Plan will be developed in consultation with customers and stakeholders and:

  • Identify key opportunities to improve transit services
  • Evaluate and prioritize network-level service improvements
  • Outline a five-year service-focused business plan

The Plan will also continue the TTC’s corporate focus on preparing transparent, multi-year plans and will:

  • Set the foundation for future annual service plans
  • Identify and link service-related operating and capital cost requirements
  • Bridge the gap between the TTC’s near-term planning with long-term City and Provincial plans [p 1]

These are laudable goals, but there is a challenge for both TTC staff and for the Board: does the political will exist to produce a plan that aspires to a stronger role for transit complete with the costs and trade-offs this will require, or is Toronto afraid to contemplate anything beyond “business as usual” planning?

This is not simply a question of buying vehicles and building more garages, but of recognizing that the compound effect of population growth and more service will drive up costs faster than inflation. When the political goal is to limit fare, subsidy and tax increases, the TTC is challenged to maintain the existing service, let alone improve to address latent demand and the widespread sense that transit is not “The Better Way”.

The transit wish lists among existing riders and those who use other modes is not the same for obvious reasons. Riders want a better travel environment and service, while non-riders want fast, cheaper ways to get around. However, both groups agree on five targets: reliability, crowding, wait time, trip duration and affordability. That list says something about the quality of what is now on offer.

Far too often, calls for better transit meet with the response “we can’t afford it”, and this precludes even a study to determine what might or might not be possible. That was the strength of the Ridership Growth Strategy of March 2003. That study provided a menu of possible system improvements together with costs and potential benefits. Simply having that menu told us all what might be done should resources become available. Without such a strategy, asking for transit changes is akin to walking into a restaurant where your dinner order must await a study to find out what might be available.

In August 2014, the TTC report Opportunities to Improve Transit Service in Toronto proposed several changes many of which are now in place, most recently the two-hour transfer.

The 2019 work will “… focus on near-term improvements that can be delivered within five years that enhance the TTC’s core-competency, mass transit …”. [p 1]

Five “opportunities” for improvement are:

  1. Improve surface transit schedules
  2. Prioritize transit on key surface transit corridors
  3. Enhance the customer experience at key surface transit stop areas
  4. Provide new connections with new higher-order transit services
  5. Accelerate integration with regional transit agencies and complementary modes of transport [p 2]

A troubling omission in this list is explicitly the provision of better transit service. Improving schedules and providing transit priority can bring better efficiency to provision of transit, but there is no actual goal to increase transit capacity. “Customer experience” at major stops will improve, but there is nothing here about their experience once on board a vehicle.

The TTC’s Corporate Plan includes five critical paths including “Move more customers reliably”. However, it also includes “Transform for financial sustainability”. These are competing goals especially when just keeping the lights on may require decisions to cut or constrain growth plans.

This competition is made explicit by two sections side-by-side in the report.

The Plan will continue the TTC’s corporate focus on preparing transparent, customer-facing, multi-year plans that:

  • Set the foundation for future annual service plans that will outline, in-detail, service improvements for the upcoming year;
  • Identify and link service-related operating and capital cost requirements over a five-year period which will provide the public, the TTC Board and elected officials with a transparent blueprint; and
  • Bridge the gap between the TTC’s near-term transit planning with long-term population and employment growth projections, rapid transit plans and the Official Plan.

The Plan will also strive to be realistic in the actions it identifies to ensure what is being planned can be delivered. This includes planning within the constraints of the TTC Operating Budget and Capital Budget. As such, the Plan will be developed noting the following key financial assumptions over the next five-years:

  • Operating Budget: The TTC 2020 Operating Budget will increase to account for the annualized cost associated with implementing new service in 2019 only. Between 2021 and 2024, multiple funding scenarios will be prepared to account for a range of possible funding scenarios from a -1% to +1% change in the Operating Budget.
  • Capital Budget: The availability of fleet including buses, streetcars and subway trains and facilities will generally align with the TTC Capital Investment Plan, noting that vehicle requirements across all modes are predominantly unfunded and any new procurement for buses, streetcars and subway trains cannot be achieved beyond 2021 based on current available funding. [pp 3-4]

If the opening premise is that costs will grow by at most 1%, then “we can’t afford it” becomes a filter that will screen out options before they even reach the discussion phase. To put this in context, the two-hour fare was estimated to have a $20 million effect on the TTC’s operating budget. That is over 1% of the gross budget of $1.9 billion, and over 3% of the $622 million operating subsidy. A two-hour fare would be knocked off of the table if a 1% filter decided which options were even considered, let alone proposed for implementation.

It is telling that the two-hour fare was finally introduced in part as an inducement for riders to switch to Presto, but the comparable change in operating cost for opening the Vaughan subway extension was never an issue during budget debates.

The gaping hole in this report is an aspirational view of transit. What might it look like if only there were the will to make it better? If there is a cost, at least let everyone know what it might be and what will be needed to bring about improvement.

Continue reading

Zero Short Turns Does Not Equal Better Service

For many years, the TTC has had a fetish for reducing short turns, or more accurately, for reducing short turn counts. Together with “on time” stats, this is a primary metric for TTC management, the one they get gold stars for.

When former CEO Andy Byford hired the current CEO Rick Leary, one of his first tasks was to reduce short turns. The result is that the CEO’s report concentrates on two factors to the exclusion of all other measures of service quality.

Here are two pages from the June CEO’s Report for streetcars. There are similar pages for the bus network.

In a recent newsletter to constituents, Councillor Brad Bradford, also a member of the TTC Board, included the following chart to show how the TTC is attacking the short turn problem. Short turns on 501 Queen were the lowest in number among all streetcar routes in early April, and fell to zero on Monday April 15 (along with a big drop on other routes too). This looks good, but as we will see later, has unintended side effects.

Bradford’s newsletter included this text:

We all know the frustration of too many short-turning streetcars, especially during rush hour.  As a member of the TTC Board I’ve been working hard with my colleagues to improve the streetcar service and reduce the number of short-turns.  I’m happy to report that April 2019 had the lowest number of short-turns since 2014, including the 501 streetcar which had ZERO short turns for several days.

Short turns disproportionately affect Bradford’s constituents as they live at the eastern end of the 501 Queen and 506 Carlton routes. However, irregular service which I have documented in numerous articles affects riders along the entire route. Gaps of 15 minutes or more in what is advertised as “frequent service” do not encourage ridership, and the unpredictability of service leaves many people walking or taking alternate modes to the TTC.

Measures of Service Quality

The count of short turns only tells us how many cars did not reach a terminal over the course of the day. It does not tell us:

  • What proportion of the service this count represents. The scheduled service to Neville over the course of a day (6 am to midnight) is about 200 trips with a similar count at Humber. 40 short turns represent about 10% of service assuming they are equally divided between the two terminals.
  • What time(s) of day were most affected. Certain times of the day are disproportionately affected by short turns, notably the hours immediately after the am and pm peaks, and through the evening especially on busy nights in the club district downtown.
  • Whether the short turn was successful in restoring more regular service, otherwise known as “filling the gap” on its next trip. There appears to be little or no management of cars re-entering service from short turns, and they may well reappear immediately ahead of or, even worse, behind a “through” car without reducing the headway. The average headway looks better, but it’s a bunch of two cars with a wide gap, not evenly-spaced service.

Unless one sees a breakdown such as the one published by Councillor Bradford, the numbers in the CEO report are accumulated for all routes over all periods of operation including weekends. This is a very generic average value, and it gives only the most general idea of short turning as a trend, rather than pinpointing problem routes and times of the day.

The other published metric is the “on time departure”. This is something of a misnomer because “on time” is defined as a window from one minute early to five minutes late, in other words six minutes’ grace relative to the schedule. For a route with a five minute scheduled service, three cars could depart close together and be “on time” for the stats.

The TTC does not report on headway reliability and bunching, issues which are at least as important as short turns. A rider on a Queen car bound for, say, Dufferin Street from Yonge does not care if their car gets short turned at Sunnyside, but they do care if no car shows up for 15 minutes or more, and they cannot board the first one in the parade.

If the scheduled times were 12:00, 12:05 and 12:10, the actual departures could be 12:05, 12:07 and 12:09 and fit within their allowed windows. The service is supposed to look like this:

X————X————X————X————X————X————X————X————X————X

But it can look like this and still be “on time”:

—————X—X—X——————————X—X—X——————————X—X—X——————

It would not take long for cars to bunch together as triplets running across the route. However, the on time measurement only applies at the terminals, and what happens after vehicles leave is not reported.

The TTC produced route-by-route statictics for five months, April to August 2018, but they have been missing-in-action ever since.

An important metric is the distribution of headways by time of day. Charts showing this information are published regularly on this site. (See this article about headways at Neville Loop and scroll down to charts showing the range of headways actually operated.)

The TTC would do well to report on the proportion of headways that are less than 50% of the scheduled value, or more than 50% over that value, broken out by by time of day and by location. Situations where vehicles are running very close together (except for the few routes and periods where the scheduled service really is that frequent) should be flagged. This is not a particularly challenging exercise, but potentially quite embarrassing.

As a quick check, I looked at 501 Queen westbound at Yonge on Wednesday May 1. Of the 215 trips crossing Yonge Street, 54 were on a headway of two minutes or less, or one quarter of the service. There were 25 trips on headways ranging from 10 up to 18 minutes, over 10% of the service. Those are all-day values, and the proportions vary by time period. (The eastbound stats are comparable.) Here is a chart of the day’s data. Note that the trend line sits at about 5 minutes for much of the day only slightly above the scheduled headway, but what riders experience is wide gaps followed by at least two cars.

(For those who might argue that this is the fault of a mix of new and old vehicles, 501 Queen and just about every other route in the system has looked like this for years.)

Although there will be more data to digest, the TTC would have a better idea of just what riders face. Exception reporting would quickly flag areas of concern, although from my own experience looking at these data, there would be a lot of “exceptions” until the TTC addresses the problem of service reliability, not just of “on time performance”.

Crowding statistics are produced from time to time, but these rarely are broken down in public reports. This should be a standard part of the CEO’s report. If the TTC does not identify when its service is overcrowded, how can the public or the politicians with responsibility for transit funding and oversight reconcile claimed service provision with rider experiences?

Crowding and headway reliability are linked in that uneven headways lead to crowded vehicles (the “gap” car) and underused capacity. The average load might look good, but the average experience is not. Most riders are on the crowded vehicles and the “average rider” will report an overcrowded trip not to mention the possibility that they boarded the first vehicle to show up with difficulty, if at all.

Vehicle reliability is reported on an overall basis, not for its effect on service. Once a failure causes a delay of five minutes or more, it “counts”, but there is no distinction about the severity of the delay or the actions taken to restore normal service. Delays caused by infrastructure issues or by external events, and again the actions taken to counter their effects, are not reported. There is no metric for how well or poorly service was managed when things went wrong.

Continue reading

501 Queen: Service Capacity with Low-Floor Streetcars (Updated)

Updated June 7, 2019 at 6:45 am: Charts showing capacity of service operated from September 2015 to May 2019 have been added at the end of the article.

For several months, the proportion of service on 501 Queen provided by the new low-floor Flexitys has been rising as the TTC shifts this route to the new fleet. The effect has been that service capacity actually provided has been rising with the larger Flexitys replacing smaller CLRVs on a 1:1 basis. This will change on June 23 with new schedules as discussed in a previous article.

This post reviews the actual capacity provided at certain times and locations on 501 Queen and compares this with the scheduled service that will go into effect with an all-Flexity fleet.

The source data are the TTC’s vehicle tracking records. For each screenline where capacity is calculated, the number and type of vehicles crossing the line is multiplied by the vehicle capacity to determine the actual hourly capacity provided. These values vary from day to day, but the overall pattern of route capacity is easily seen in the charts. Service design capacities of 74 and 130 were used for CLRVs and Flexitys respectively. Although the cars can and do carry more riders, service design is (or at least should be) based on a crowding level where riders have some ability to move around and dwell times are not driven up by delays as people fight their way into and out of vehicles.

One factor in the changing capacity on Queen, by contrast with King, is that as Flexitys started to appear in service, they tended to  be dispatched in bunches so that there would be many of the larger cars in a row. This has the effect of making the capacity bump uneven by time and location depending on where the “parade” of Flexity cars would be. When service converts to all Flexity  on a wider headway, the change in service capacity will vary, but in all cases it will decrease because there will be about 1/3 fewer cars/hour than there are today.

The table below compares the scheduled capacity before and after the change assuming all “old” service is provided by CLRVs and all “new” service by Flexitys. On paper, there will be more capacity with the new schedule. However, the actual service provided today, and for some time on 501 Queen, is higher than the all-CLRV level. Riders will experience both a considerable widening of headways and a reduction of service capacity relative to what they have had in 2019 to date. It is no secret, based on the King Street experience, that there is latent demand for more capacity on major transit routes like this.

Existing Schedule New Schedule
Service Design Vehicle CLRV (74 passengers) Flexity (130 passengers)
AM Peak Headway 4’15” (255 secs) 6’30” (390 secs)
AM Peak Cars/Hour 14.1 9.23
AM Peak Capacity 1,045 1,200
PM Peak Headway 4’50” (290 secs) 6’50” (410 secs)
PM Peak Cars/Hour 12.4 8.8
PM Peak Capacity 920 1,140

In the charts below, the actual capacity provided by the mix of CLRV and Flexity service is regularly above 1,200 passengers/hour, and the new schedule represents a service cut. The only saving grace is that the TTC plans to operate three peak period trips in each direction with buses (adding roughly 150 spaces to the peak-within-peak period) and keep a few “run as directed” cars in reserve. When the actual operating results for June and July are available, we will see exactly what service was provided.

Continue reading

TTC Service Changes Effective June 23, 2019

The TTC will make several changes in its service on June 23. Many of these are the usual summer service reductions, but others will see changes for construction projects, to improve reliability on some routes, and to redeploy the streetcar fleet.

Subway

On 1 Yonge-University-Spadina, the dispatching of trains will change to increase the use of the north hostler track and exit from Wilson Yard (all days), and to restore the full capacity of Davisville Yard following expansion of the carhouse (weekdays).

On 2 Bloor-Danforth, a gap train will be dispatched from Greenwood or Keele Yard in the AM and PM peak as needed to fill service gaps. There will also be the usual summer service reduction on this line.

On both routes, crew procedures at Finch, Vaughan, Kipling and Kennedy will be changed to single step-back operation.

Streetcars

The 501 Queen car will be formally scheduled as a low-floor route entirely with new cars. In recognition of their larger capacity, headways will be widened somewhat, but not on the scale Toronto saw when the two-section ALRVs replaced the CLRVs on a 2:3 ratio with correspondingly wider headways. Although in theory the scheduled capacity remains the same, the actual capacity could fall because new larger cars have already been operating on the shorter CLRV headways. I will explore this in a separate article.

Night service will be improved on 301 Queen to reduce overnight storage needs with the large number of new cars now on the property together with remnants of the old fleet, and the partial closure of Roncesvalles Carhouse for reconstruction. This continues a change introduced on 304 King in May.

CLRVs will continue to operate on the Long Branch segment of the route. This is expected to change to low-floor operation in September. The peak period trippers that run through from Long Branch to/from downtown will be dropped, but will return in the September schedules.

The 511 Bathurst route will revert to streetcar operation. The exact mix of cars will depend on availability and day-to-day decisions about allocation. The service memo shows a small allocation of ALRVs to the route, but these could turn out to be Flexitys instead just as happened on 501 Queen. (Click to expand the table below.)

Leslie & Eglinton

For the summer months, Leslie Street will be closed at Eglinton, and a temporary loop will be created north of the intersection. This will be used by 51 Leslie and by some of the 54 Lawrence East service. Weekdays from 5:15 am to 9 pm, and weekends from 8 am to 7 pm, the Starspray and Orton Park branches will terminate at the Leslie/Eglinton loop, and there will be a separate service running from Eglinton Station to Lawrence East Station via Don Mills & Eglinton. Outside of these periods, the Starspray and Orton Park services will run to Eglinton Station via Don Mills, and a supplementary shuttle will run from Leslie/Eglinton to Lawrence/Don Mills as part of the 51 Leslie route.

All 51 Leslie service will terminate at Leslie/Eglinton.

The 954 Lawrence East Express is not affected.

Service on 34C Eglinton East to Flemingdon Park will be increased slightly to offset changes to 54 Lawrence East.

See the linked spreadsheet for details of the various routes, headways and hours of service.

Lawrence Station

Because of construction at Lawrence Station, part of the bus loop will be closed for paving and the 52/952 Lawrence services will loop via the east side of the station. Service on 124 Sunnybrook and 162 Lawrence-Donway will be extended west and north to Roe Loop on Avenue Road. Transfers between these routes will move to surface stops.

Wellesley Station

Construction at Wellesley Station will complete and the 94 Wellesley will return to its normal operation with its eastern branch terminating there rather than at Queen’s Park.

Royal York Station

Buses were planned to return to Royal York Station on May 24, but the schedules will not formally be revised until August. Interlining of 15 Evans with 48 Rathburn, and of 73 Royal York and 76 Royal York South, will continue until then.

Bay Bus

Service on the 6B short turn at Bloor will be discontinued during the peak period and all buses will run north to Dupont.

Dufferin Bus

All service will terminate at Dufferin Loop rather than at Princes Gates due to frequent summer events that make bus operation through Exhibition Place difficult.

Road Construction in Scarborough

Several routes will be affected by road construction projects.

Danforth Road from St. Clair to Danforth Avenue:

  • 113 Danforth

Midland Avenue from Danforth to Lawrence:

  • 20 Cliffside
  • 57 Midland

Brimley Road from Progress to Huntingwood:

  • 21 Brimley

Huntingwood Drive from Kennedy to Brimley:

  • 169B Huntingwood

20190623 Service Changes

Ontario’s Transit Plans: Details Emerge in City Report

When Premier Doug Ford announced his new transit plan in April as part of his first budget, there was plenty of hype about provincial transit investment, but few details about what would be built or how far design had progressed beyond doodles on bar napkins. Four projects comprise the Ford plan:

  • The “Ontario Line” from the Science Centre at Don Mills & Eglinton to Ontario Place replacing Toronto plans for the Relief Line
  • The Richmond Hill extension of Line 1 Yonge
  • The Scarborough Line 2 Danforth extension to Sheppard & McCowan with at least three stops rather than the one in the current Toronto plan
  • A modified plan for the Eglinton West LRT extension with underground construction for part of the route east of Martin Grove
  • Extension of the Sheppard subway east to McCowan to meet the northern end of Line 2

Information about these proposals came more from rumours than from specifics, notably from Metrolinx, the agency charged with planning and delivery of the scheme.

Staff from the City of Toronto and the TTC have been meeting with their provincial counterparts, and details begin to emerge in a staff report to Toronto’s Executive Committee.

The Ontario Line concept proposed by the Province is at an early stage of design. [p 5]

This is not a “shovel ready” project, nor is the revised Scarborough subway, in spite of claims that the Ontario line can be open by 2027. That is very much a political date based on the need to have relief capacity in place before new demand is added to the Line 1 Yonge route from the Richmond Hill extension. The government, knowing the votes available in York Region, needs to show progress on that extension, but actually operating it would totally overload the subway system without substantial diversion of ridership to a relief line.

Previous studies by Metrolinx foresaw a drop in ridership at the Bloor/Yonge choke point provided that a new line went at least to Eglinton rather than stopping at Danforth. This is not news, but the political change lies in recognition that a line to Eglinton is not some future, “Phase 2” option, but an essential part of reducing demand on Line 1. Whether the construction timing and possible opening dates for the Ontario and Richmond Hill lines can be achieved is quite another matter. In a political context, the important date is 2022, the next Provincial election. By that time, visible “progress” will be needed to shore up support for the government, but the target dates will be far enough off that the inevitable slippage will not yet be evident.

Public Consultation

In parallel with the technical work on provincial plans, the City of Toronto has launched a public participation campaign about the shift in responsibilities for transit between the municipal and provincial governments. This is all a bit vague at present because the details of what Queen’s Park actually intends remain rather vague. The government has given itself the power to take over projects completely or in part, and to seize Toronto assets with or without compensation. However, the financial details are murky including the problem of expected contribution to capital projects by other governments and the as-yet unaddressed question of cost sharing for day-to-day transit operations which includes a substantial component of running maintenance, not just driving the trains.

The City will bring a wider range of issues than a few new lines before the public for comment. Four public meetings are planned over the coming month:

Thursday, June 13, 6:30 to 8:30 p.m.
Father Serra Catholic School
111 Sun Row Drive, Etobicoke

Thursday, June 20, 6:30 to 8:30 p.m.
North York Memorial Community Hall
5110 Yonge Street, North York

Saturday, June 22, 10:30 a.m. to 12:30 p.m.
Scarborough Civic Centre
150 Borough Drive, Scarborough

Thursday, June 27, 6:30 to 8:30 p.m.
City Hall, Council Chamber
100 Queen Street West, Toronto

Although one might despair that the Ford government cares about or will listen to concerns by Toronto citizens, this consultation will be important if only to gauge overall public feeling. The challenge will be to conduct real consultation without having sessions hijacked by Ford Nation supporters.

Continue reading

Analysis of 501 Queen: Why Are Trips Taking Longer?

Schedule changes for 501 Queen pending on June 23 are, in part, related to a growth in travel times. This article examines the evolution of the route’s operation and travel times over the past year.

There are a lot of charts in this post in part to show many aspects of the discussion and in part so that readers can refer to different parts of the route of interest. All charts are clickable to open a larger version.

Previous articles in this series are:

The growth in 501 Queen travel times from 2018 to 2019 is summarized in the following chart of monthly averages across the route westbound.

This prompted theories both by readers and by me about possible causes including:

  • Longer dwell times caused by new streetcars
  • Greater congestion caused by changes in traffic signal timing

The charts below, included in a previous article, compare average travel times by hour in each direction and show slightly longer averages for Flexitys compared to CLRVs. A valid question here is whether the CLRV times are artificially higher because they catch up to Flexitys and then travel at a lower speed than would otherwise happen. This is difficult to verify because there is already much bunching leaving Neville and Humber Loops, and “gap cars” (the first car in a parade) slows following vehicles regardless of which type it is. However, a detailed review of the headways in front of each type of car shows that in many cases Flexitys tend to be carrying wider gaps. This is not, however, consistently the case.

As to the concern about signal timing, a factor that affected the King Street Pilot for part of its run, this did not pan out for the route as a whole, but was a factor at one location. City staff advised that the only place that was changed was at the Queen/Lansdowne/Jameson intersection where work is underway, and transit signal priority has been shut off. Elsewhere, the signal timings were not modified.

A further question lies in a jump in travel times midway through April. Both the CLRV and Flexity travel times went up and also became more varied from day to day in weeks 3 and 4 of April. This implies some change affecting the route overall, not just one vehicle type. A review of detailed data showed:

  • The proportion of service provided by Flexitys did not change in the second half of April. Any effects due to their operating characteristics should be the same throughout the month.
  • An unknown activity between Sherbourne and Jarvis slowed traffic during the late morning hours of the last two weeks in April. Some other congested locations such as the Lansdowne/Jameson and Bay-to-York areas also worsened during this period.
  • The TTC instituted one of its periodic “no short turn” policies start in mid-April. While this makes the management statistics look good, the effect is to create larger gaps which, in turn, drive up average travel times as packs of cars follow each other and gaps are not filled.

Total trip times can be affected by extra dwell time at stops, by slower operating speeds, or by a combination of the two. In reviewing the data for April in both 2018 and 2019, I found that changes in speed were more marked than changes in dwell times.

Of particular note is that some of the areas where streetcars go slower in 2019 are areas of bad track where slow orders have been implemented. The number of these locations is growing on the streetcar network, and there is reason to worry that the TTC is not keeping ahead of this problem. Most notable is the track at Queen/King/Roncesvalles including the carhouse entrance and Sunnyside Loop. This has been on the books for replacement for a few years, and that work was delayed yet again to 2020 due to problems at the City with planning and contracting for the work. However, this is not the only place on the route where slow orders are a quick fix for track that needs repair. The TTC has a generic “go slow” policy for all intersections which slows streetcar service across the system.

I will update this tracking with May and June 2019 data as they become available.

In the next article in this series, I will review operations on 501 Queen during the period when there appears to have been an embargo on short turns.

Continue reading