
In Part I of this series, I reviewed the operation of the 501 Queen car at the east end of the route, specifically to review the amount of short turning and the regularity of the service. Now in Part II, I turn to the west end of the main segment of the route at Humber Loop.
It is no surprise that the results here are quite similar to those at Neville. Specifically:
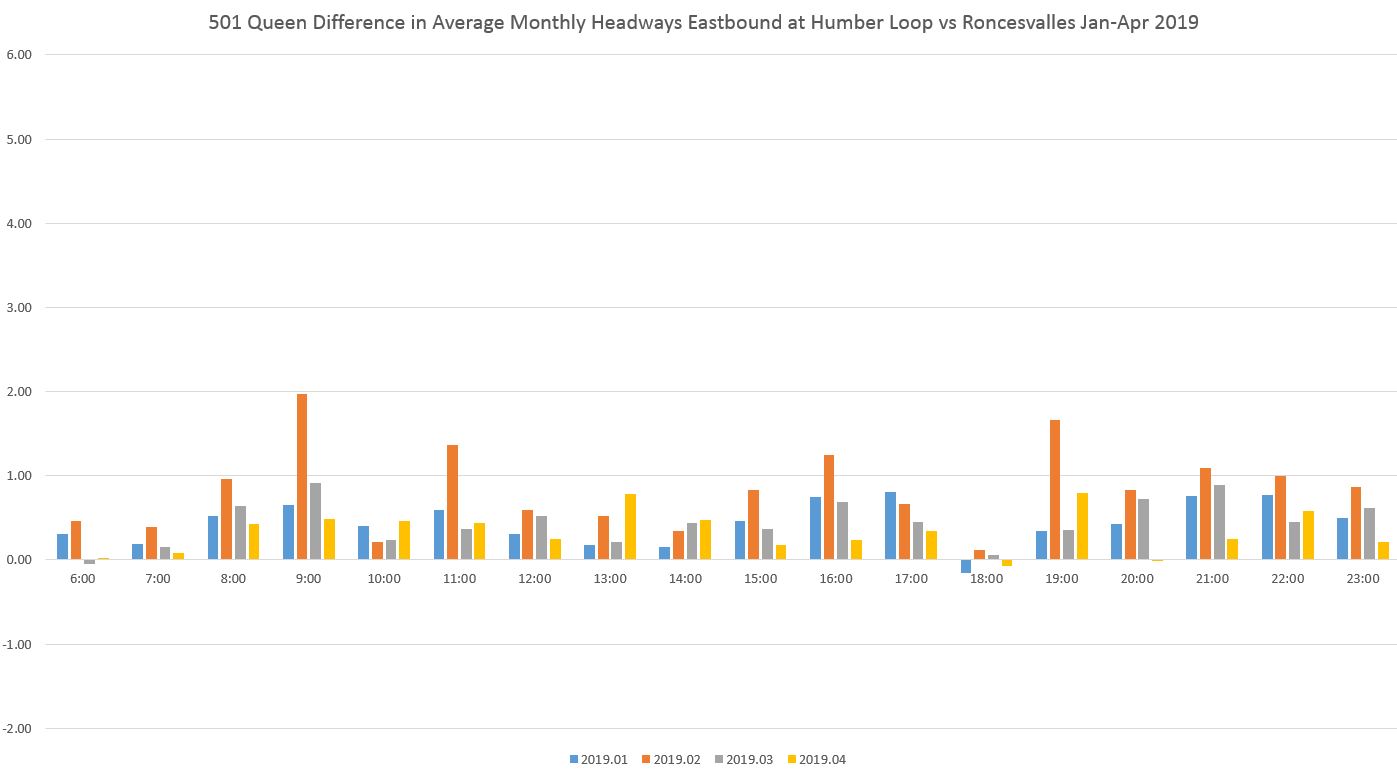
- The average headway at Humber is somewhat wider than at Roncesvalles, just east of Sunnyside Loop where some service scheduled for Humber short turns.
- There is a peak in the difference between these locations just after the morning peak, and again after the pm peak showing the effect of recovery actions from those periods.
- Headways (the time between cars) are quite erratic leaving the terminal at Humber, and this pattern continues east over the route.
An important issue here is that both short turns and erratic headways can have similar effects on riders, and they might not always know the difference.
If you are riding a car that is short turned, you know about this because you get turfed off and must transfer to the following car whenever it appears. However, if you are waiting for a car and there is a long gap, this could be due to a short turn (one or more cars is missing) or simply due to bunching (all the cars are there, but running in packs). Short turns affect riders on the outer parts of routes, while bunching affects riders across the entire line.
The TTC reports riding stats from time to time, although not anywhere as often as they should, and these are calculated as hourly averages. The problem with this is that averages do not reflect the uneven wait times, nor the uneven loading that results from a gap car carrying more passengers than its follower. Indeed, a route’s average load may lie within standards, but most of the riders are actually on crowded gap cars. This is a long-standing problem on the TTC and with the reporting of demand versus service. Also, of course, riders who never board are never counted, and we do not know the latent demand if only service were provided more reliably and with capacity for all to board.
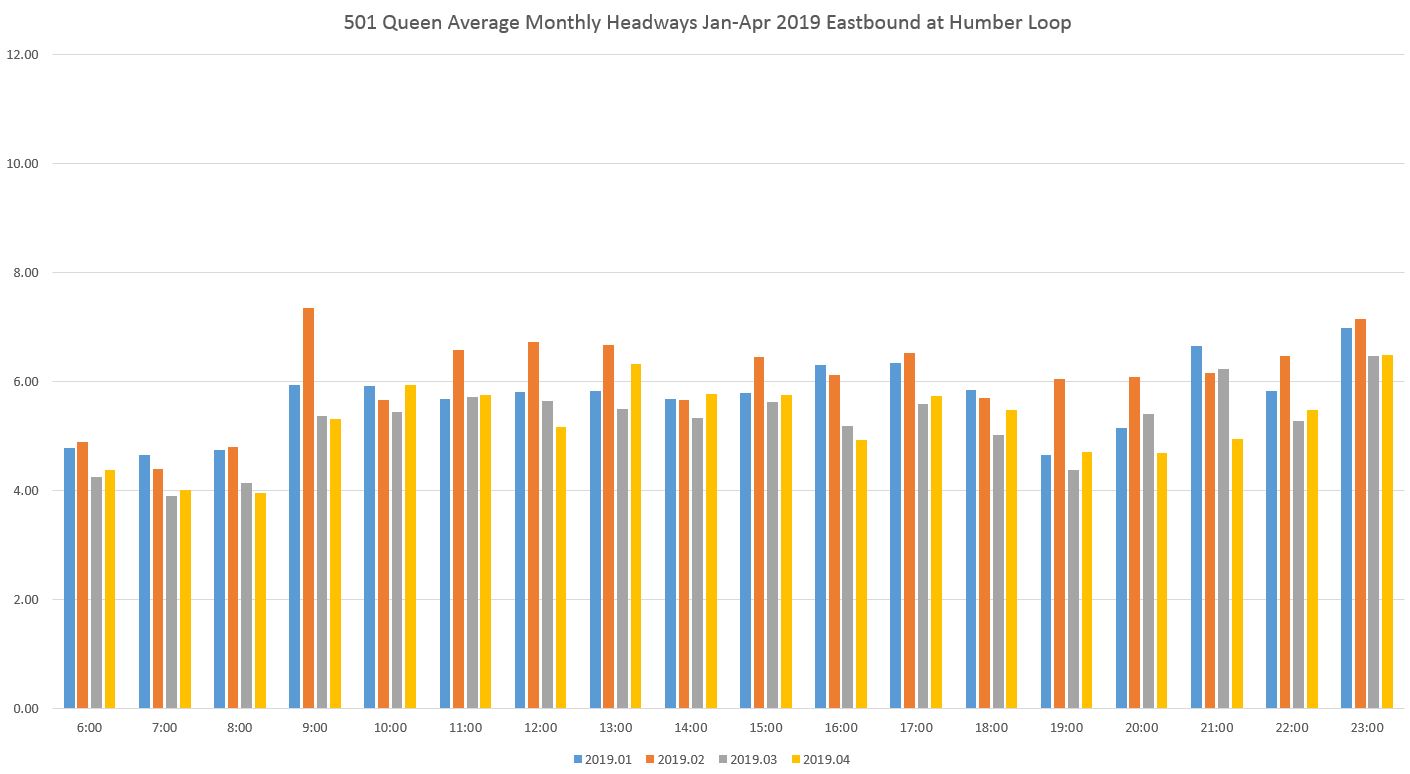
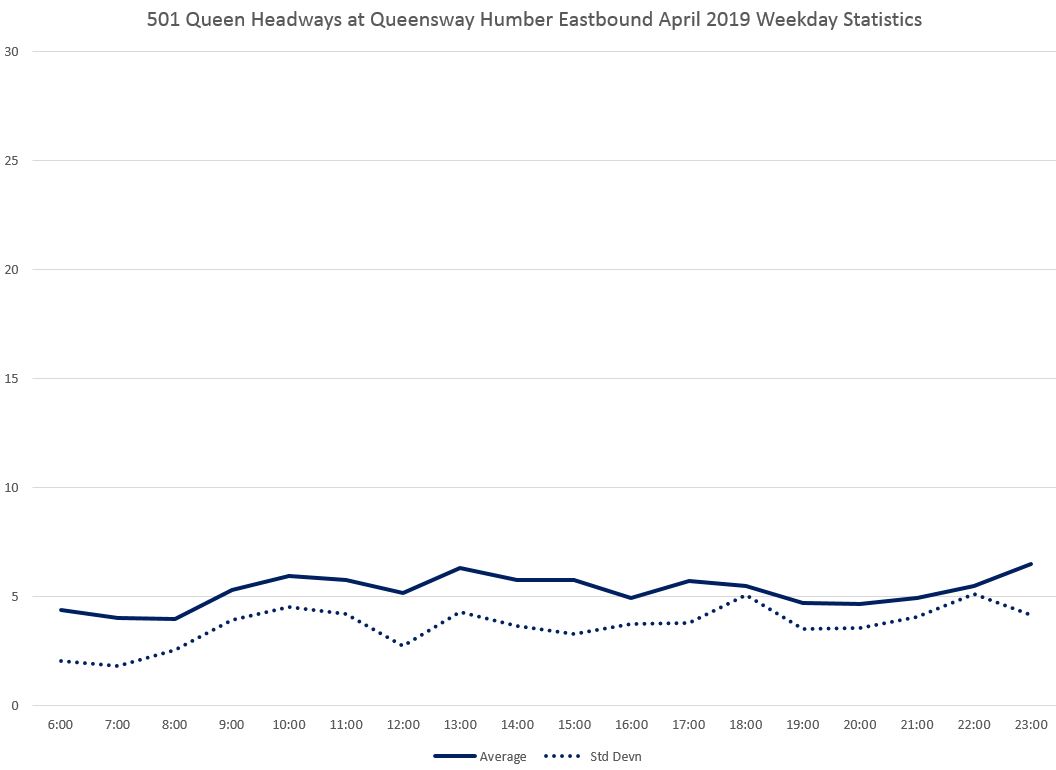
The charts below show the average headway on weekdays, broken down by time of day, for each of the months of January to April 2019 eastbound from Humber Loop and from Roncesvalles Avenue. The third chart shows the difference between the two sets of values. These are averages, and the charts do not convey the degree of scatter for individual headways and the effect of this on service riders actually experience. [Click on any chart to expand to full size.]
Note that the average headways in March (grey) are higher than in April (yellow) in some cases, lower (better) in others. The TTC says that there were fewer short-turns on Queen in April than in March, but there is no convincing argument here.

The same data looked at on a weekly basis show more variation, but in particular there are spikes corresponding to periods of extremely bad weather


Full chart set: 501_201901_201904_HeadwayComparisons_Humber
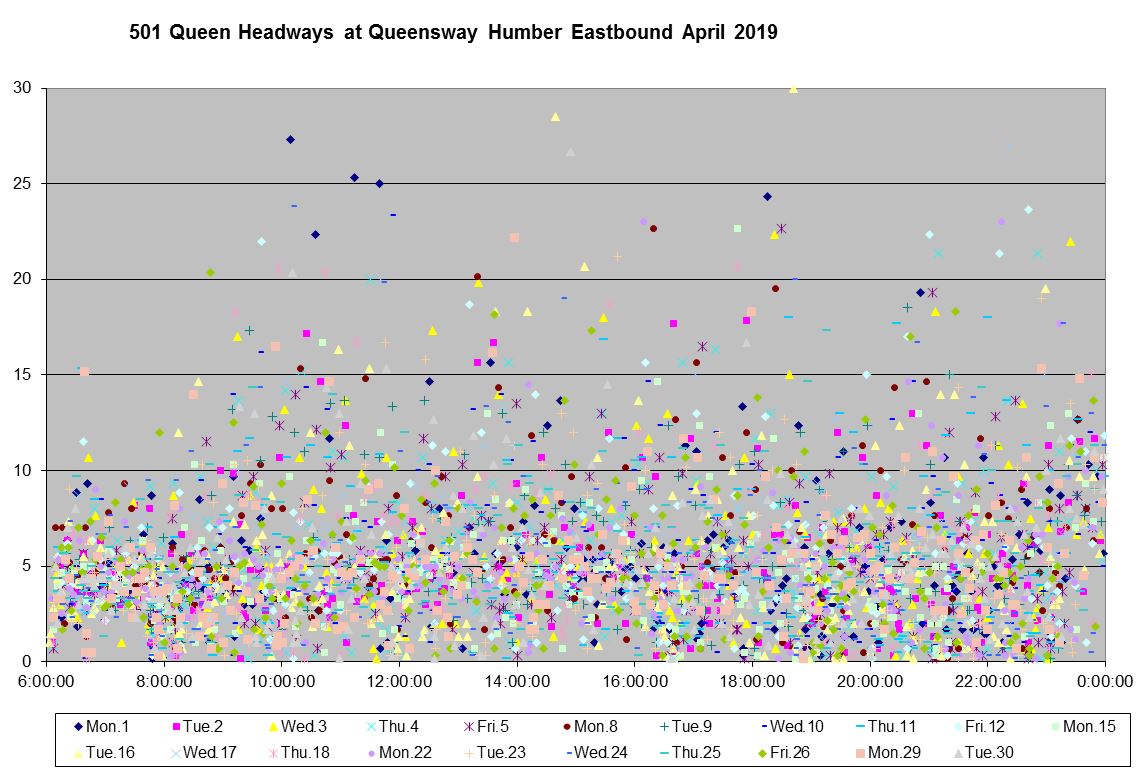
At the level of individual trips, the wide variation in actual headways is evident. The charts below show all of the trips for the months of March and April 2019 by day and time. The further up the chart, the longer the gap between cars. The point here is that headways well above 10 minutes are not uncommon, but also many headways have very low values showing cars running together as they leave the terminal at Humber. There is little difference in the overall patterns for the two months.
About the only good thing to report is that, unlike the service at Neville reviewed in Part I, there were few headways above 30 minutes with none in March and only three on April.
The screenline for these charts is on The Queensway just east of Humber Loop.
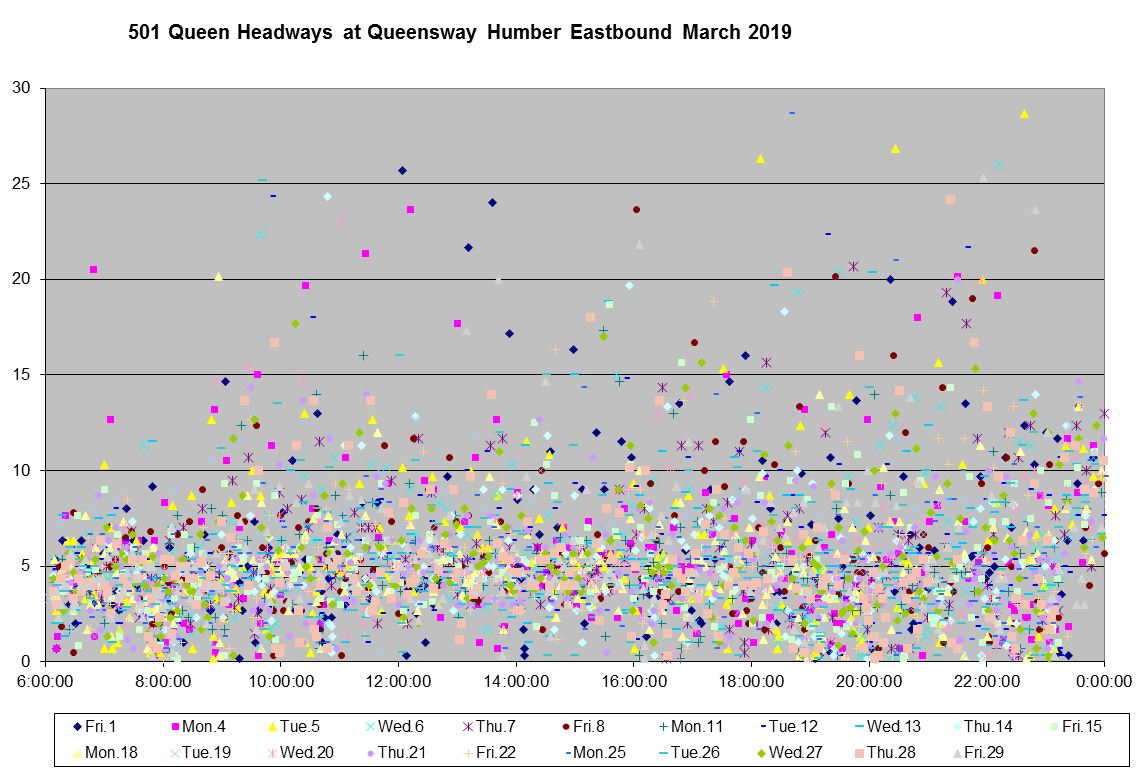
Looking at the whole month’s data, average and standard deviation values are interesting. With the SD value lying close to the average, there are periods when cars are routinely leaving Humber in pairs, or close to that.
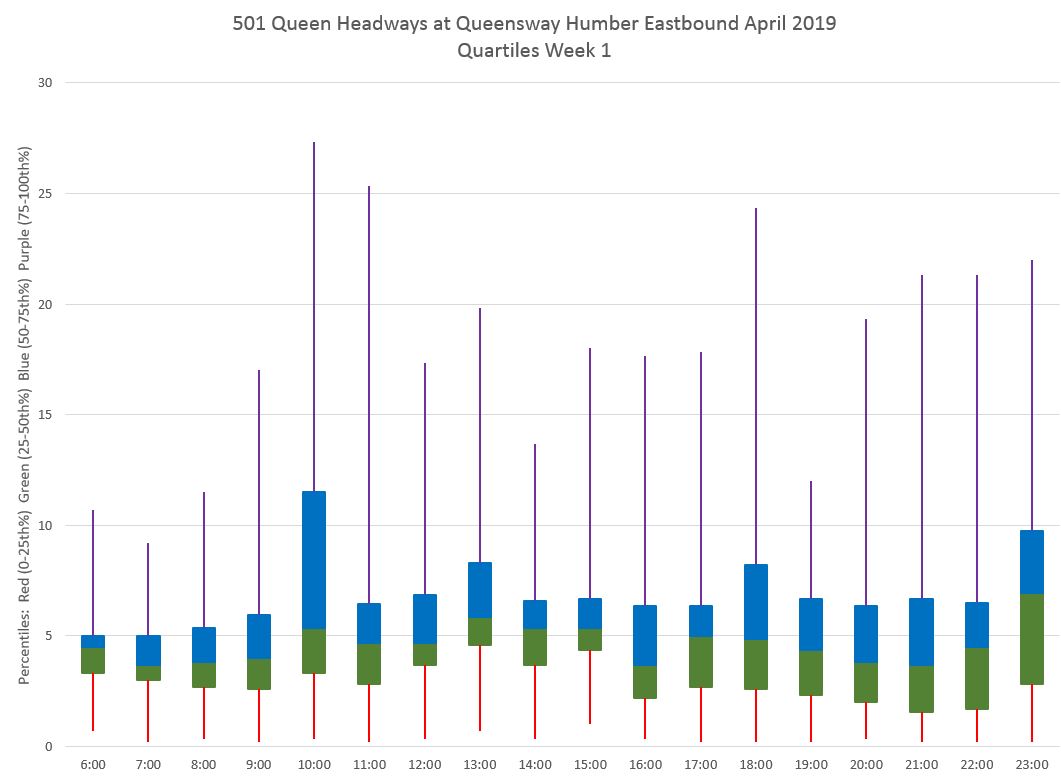
Taking the data from the scatter diagram above down to the level of a single week, the chart below shows the data for April 1-5 with trend lines are interpolated through the points (6th order polynomial). This shows in aggregate the headways lie close to the scheduled value, but the scatter of the individual points shows that many riders have a longer than scheduled wait for a car, and that more than one car is likely to show up shortly behind another. This pattern is seen throughout the month.

The same data presented as quartiles show how the headways are distributed. Half of them lie within the green and blue boxes, but a quarter lie in the lower quartile (red) reaching down to the axis in most periods, and the remaining quarter lie well above the scheduled headway.
Looking at an individual day, the “spikiness” of the charts shows how short and long headways are the common pattern through the day. Some of the spikes at Humber disappear at Roncesvalles because of short turns coming into the service from Sunnyside Loop.


To the extent that short turns occur, they do not fix the overall irregularity in headways because this is so pervasive. This erratic service travels east across the route with little change, and this cannot be blamed entirely on congestion as cars travel east through the busy Queen West area.
The situation westbound is similar with erratic service leaving the Beach and continuing across the line. By the time service reaches Yonge westbound, here is what it looks like:

By Roncesvalles, the gaps are wider. The gap at 3 pm (15:00) started out from Neville Loop at about 1:40 pm (13:40) and was not “split” by a short turn at Woodbine even though a car was already sitting in that loop when the gap passed by at 2 pm (14:00).

One particularly wide gap of over half an hour at about 6 pm was caused by short turning all westbound cars at McCaul Loop starting at about 5:20 pm. There was no eAlert issued for this, and so I cannot report on the cause.

In this case, the large gap travels west to Humber, but it is split by a short turn that comes in at Roncesvalles.

And finally, arriving at Humber Loop.

April 3 is one day out of the month, but it is not unusual.
Full chart sets:

Sections of streetcar trackage have separate signals for the streetcars, could this be extended to parts of the mixed traffic routes, such as short turns and loops and used to schedule and space cars. My thought is that if a bunch hits a short turn point, then the “following” cars GPS trips a signal to the driver to short turn, or do a delay run up McCaul to re-space. At end of line loops a signal could be used to “space” cars, so a following car would not leave until the leading car had passed a set point. And if other spots along the route could be found/made for a car to wait for a preceding car to gain some space another set of spacer signals could help enforce the headways.
Is this too basic, or is this something the TTC could implement if they had funds?
Steve: The basic problem is that this type of functionality should have been designed into the vehicle tracking system and included as part of operators’ dashboard displays. However, this would require that TTC rethink their operating philosophy from one of being “on time” to being properly spaced, itself dynamic concept that depends on day-to-day and hour-to-hour conditions.
LikeLike
Another aspect of riding the 501 route is making it through Humber loop in either direction. I don’t know how complicated it would be to see how long a typical through rider spends at the loop, either waiting for a Neville or Long Branch car, and then sitting in the car as it lays over. (Long Branch cars tend to have layovers of five to ten minutes, generally leaving when the next one arrives.)
Steve: An interesting question. I will have to contemplate a way to tease this out of the data.
LikeLike
Why would they short turn ALL westbound cars at McCaul Loop? That sounds quite ridiculous. They could have at very least short tuned them west of their so there’s a smaller gap but McCaul. That might cause problems…
LikeLike
If the westbound track is blocked between McCaul and Spadina (by a collision or abandoned vehicle) there’s no choice but to short-turn at McCaul. If it’s blocked between McCaul and Bathurst you could try to turn at Spadina and maybe Charlotte, but adding turning streetcars to Spadina and King isn’t a recipe for joy either.
LikeLike
This part is relatively easy. Unfortunately, the problem is that they don’t care. If management cared, they could instruct their drivers that they are not to leave until it has been a certain amount of time since the previous car left (which they could see, typically); and if most drivers cared, they could simply wait without being instructed to do so.
Technological solutions usually can’t fix social problems.
LikeLiked by 1 person
Thank you for this analysis Steve. I realize it doesn’t have the same ridership, but is there any chance you would consider doing something similar for 501 Long Branch (perhaps in tandem with looking into the Humber Loop dwell times mentioned by Ed)?
My sense is that local service is not as reliable as expected or assumed to be, given the route length. As I write this, there is a 15 min. headway westbound during peak PM hour.
Steve: I was planning to turn to the service west of Humber once I finish with the route to the east. Still delving into the mysteries of growing travel times there.
LikeLike