
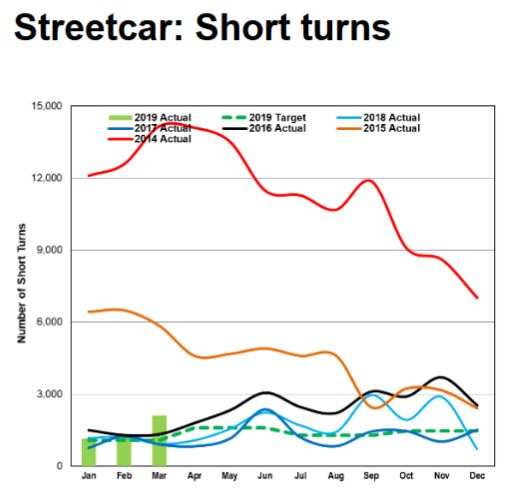
A recent report by the CBC on May 8 claimed that the “transition to new streetcars will help alleviate short turns on major routes”. TTC spokesman Stuart Green, citing the May 2019 CEO’s Report, said that a large increase in short turns during March 2019 was caused by, among other things, the mix of new and old cars on the route with the strong implication that things will be better once Queen goes 100% low-floor in late June.
The CEO’s Report cites various factors:
Over the five-week period, the 501 Queen route made up approximately 40% of all short turns. This increase on the 501 route was due to several factors:
First, the reduction in Run-As-Directed (RAD) streetcars beginning in Week 8 (from 6 a.m./p.m. to 3 a.m./p.m.) has hurt the operational flexibility to respond to incidents and service gaps on all routes.
Second, the Queen route is largely serviced by CLRVs. These legacy vehicles experienced a high number of mechanical delays and disablements in March.
Finally, the Queen route is in a transition period with LFLRVs making up a small portion of the vehicles on the route, mixing with the CLRVs that have historically operated on the route. The different speed and operating characteristics of the two vehicle types inherently leads to more bunching and gapping on the route. [p 37]
The situation on Queen is even more complex than this and includes factors not listed in the CEO’s report:
- Weather varied substantially over the winter months and yet short turns were at a substantially lower level in January and February.
- Many delays on streetcar routes were caused by the City of Toronto’s failure to clear snow resulting in many cars parking foul of the tracks.
- There is a persistent problem with uneven headways (bunching and gapping) leaving terminals, and little evidence of attempts to evenly space service. The mix of vehicle types can compound this problem depending on the capacity of the “gap car”.
From a rider’s point of view, irregular service and short turns may be indistinguishable especially for someone beyond a common short-turn location. On the east end of Queen, this is Woodbine Loop. It does not matter whether a 20 minute gap to Neville is caused by a short-turn at Woodbine, or because the service is running in packs separated by long gaps. In practice, most of the scheduled service does reach Neville, but it neither arrives nor leaves on a reliable headway (the time between cars).
At the May 8 TTC Board Meeting, Acting CEO Kirsten Watson noted that there had been a change in operational strategy in April whereby operators who were “late” to the schedule short-turned by trading vehicles with another car near a terminal rather than physically short-turning their own car. The result is that the operator gets back on time while their original car continues to the terminal.
Technical Note
In the charts below, headways are measured at Silver Birch Avenue which is the first stop west of Neville Loop. The reason for this is that a combination of GPS oddities and bunching of cars at the loop do not produce reliable data if the screenline for tracking vehicles passing a point is set close to the loop. Silver Birch is far enough west to avoid this while still reliably portraying the quality of service leaving the terminus.
Average Headways by Time of Day
The charts below show the average headway (the time between cars) westbound at Silver Birch (a few blocks west of Neville Loop) broken down by hour of the day (groups of bars) and month (coloured bars, one for each month). Higher values mean that the average headway was worse. There is not a great deal of difference between March and April, and the bigger changes are seen relative to January and February which were affected by weather.
A typical problem on Queen is that at the end of the morning peak period, headways at terminals can be larger than usual because route supervisors are cleaning up after the peak. This shows up for the 9:00 and 10:00 data below. The rise late at night is the scheduled transition to “baby night” service.
Note that the same scheduled headway operated on Queen for the entire four month period. Only weekdays are included here. Although there are transitional periods where the scheduled service is not the same throughout an hour, there should still be the same level of service over that hour every day. The averages shown below will reflect what actually happened.
Click on any chart to see an expanded version.

The next chart shows data from just east of Coxwell (a few blocks west of Woodbine Loop. Note that these cars generally sit lower than the values for Silver Birch above and there is no post-peak effect in the AM because short turns at Woodbine Loop are counted in these figures.
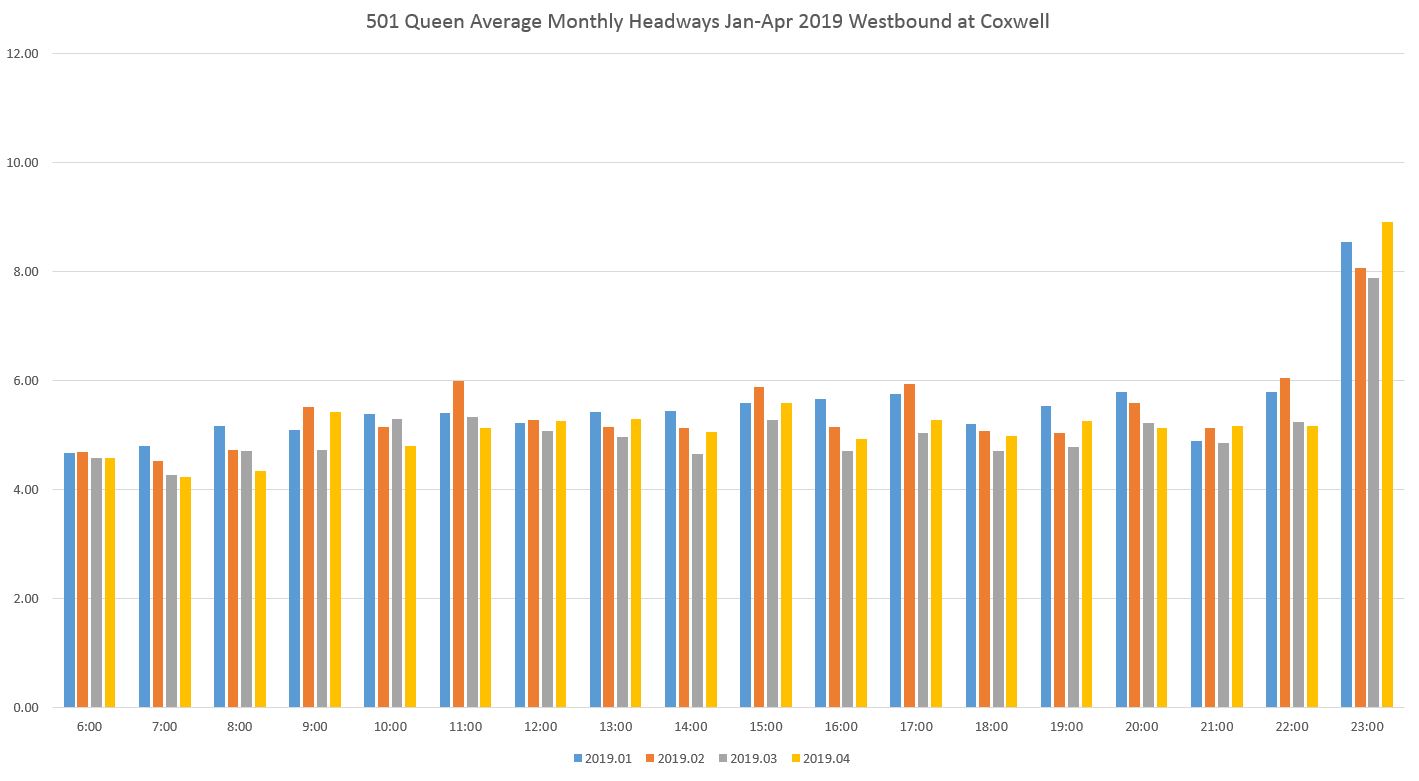
To save a lot of back-and-forth between the charts for readers, the version below shows the difference between values at Silver Birch and at Coxwell which, unsurprisingly, are highest (worst) after the AM peak. Note that the scale here is different on the left axis, and includes provision for negative numbers. These values can occur because one hour’s service leaving Neville is not quite the same “hour” as seen at Coxwell. Even if there are no short-turns, it is possible for fewer cars to cross the Coxwell screenline in an hour than at Silver Birch because a bunch of cars leaving Neville late in the hour might not be “seen” at Coxwell within the same hour.

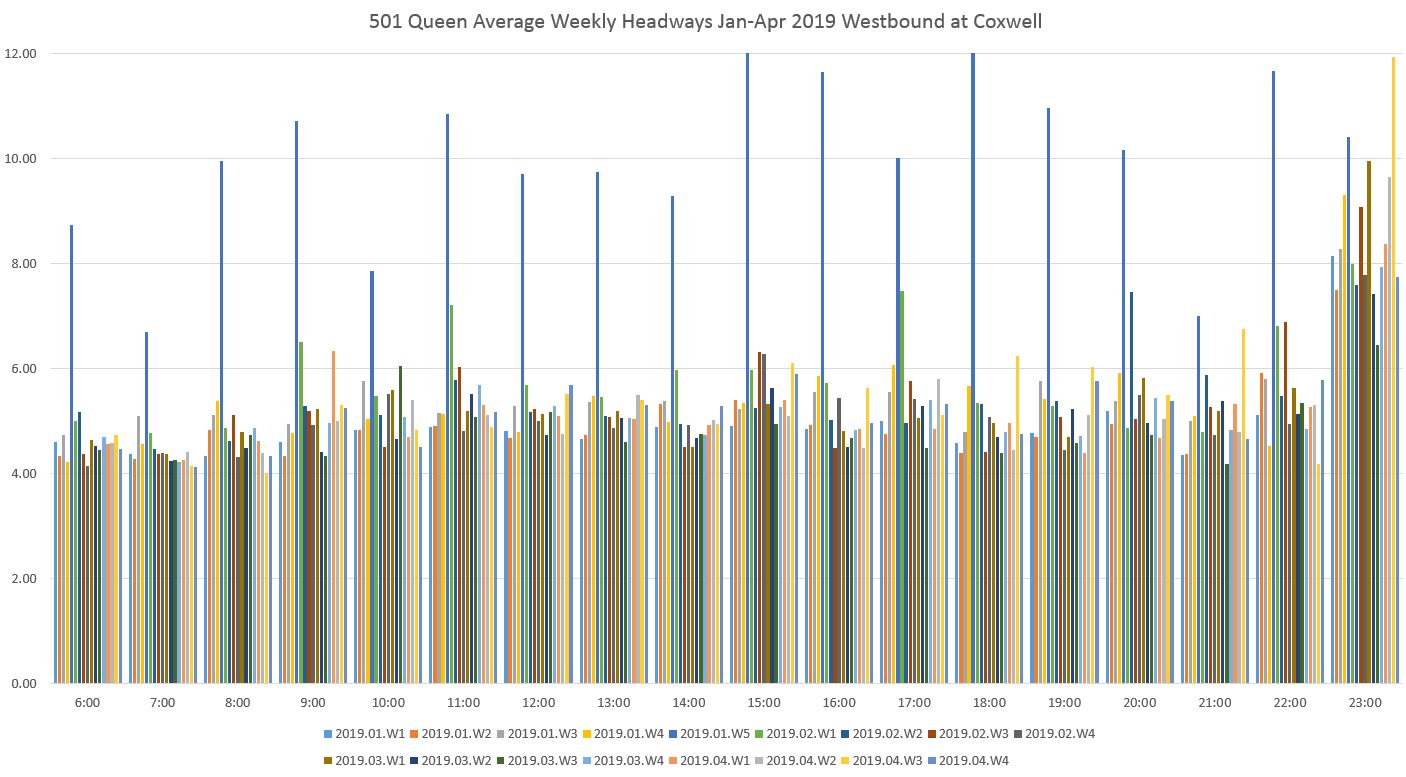
However, these charts are average data for entire months, about 20 days, and the situation changes when looked at in more detail on a weekly basis. Note that in these charts some values have been clipped where the average goes above 12 minutes to keep the rest of the chart readable. The biggest problem coincides with the severe weather at the end of January, but this is not the only time when average headways sit well above scheduled values.

At Coxwell, things are not as bad, but in late January, the average headways are bad all day. As with the monthly charts above, note that the problem of a “hump” in headway values from 9:00 to 11:00 more or less disappears at Coxwell.
The delta values shown below illustrate the periods when average headways at Coxwell were generally better than at Silver Birch. There are variations by time of day and by week within the four month period.

The six charts above are collected here in PDF format.
501_201901_201904_HeadwayComparisons_Neville
Headway Variations: Gaps and Bunches
Although averages show the overall pattern for service and specifically the degree to which some of the scheduled service never reaches Neville Loop, these charts do not reveal the degree to which headways are dispersed over a wide range. In theory, a streetcar should arrive every “n” minutes, and at terminals they should most certainly depart on a regular spacing. However, TTC standards fail on this account in two ways:
- There is a six minute window within which a car is “on time” ranging from one minute early to five minutes late. On a frequent service like 501 Queen, this means that pairs of cars can be “on time”. The management performance stats may look good, but the service is crap. When a vehicle is short-turned, it never gets to be counted as “on time” or otherwise at the terminal.
- There is no measure of headway regularity such as the degree to which headways are very short (bunching) or very long (gaps, including those caused by short turns).
Further problems arise because many TTC performance statistics are averaged over the entire day and multiple locations on a route. The individual trips and rider experiences disappear in averages that make the service look better than it really is.
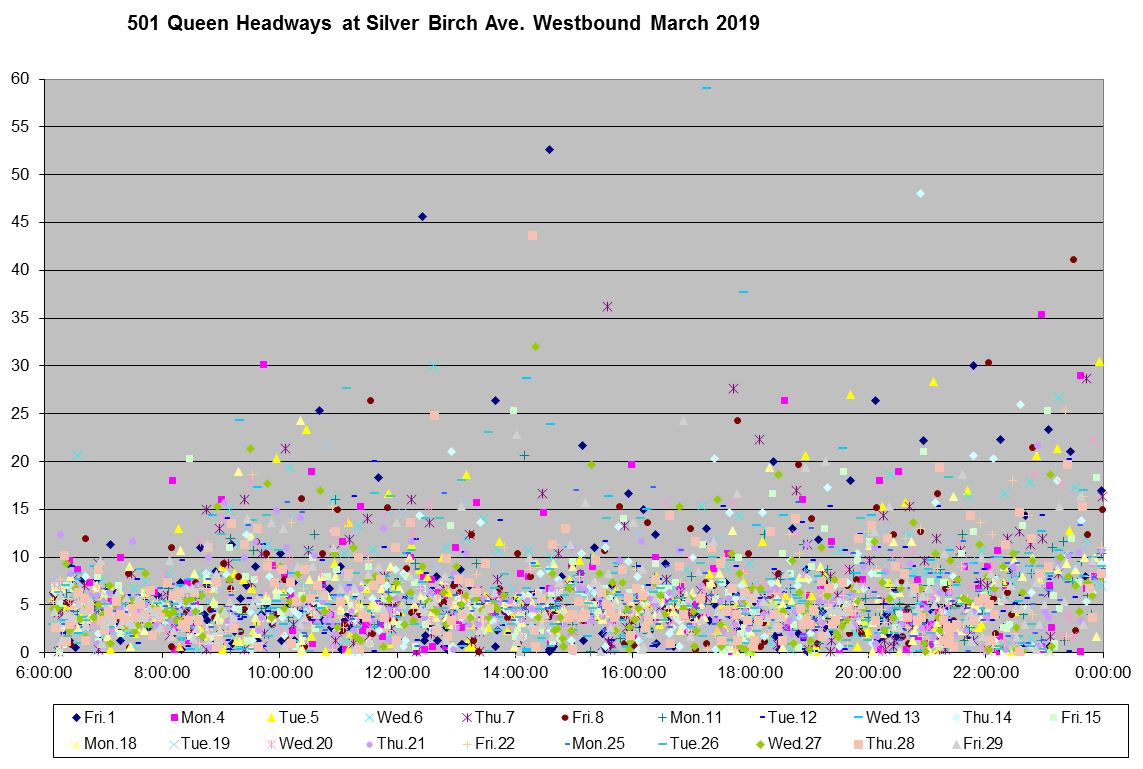
The charts below show all of the trips for every weekday in a month on one page for headways westbound at Silver Birch in March and April 2019. Each dot on the chart is one trip leaving Neville. The shape and colour give the date, the horizontal position the time of day, and the vertical position the headway. The vertical scale reaches up to 60 minutes to fit in all of the data points for some very wide gaps. The intent of this format is not for detailed analysis, but to show the overall character of the numbers.
For both March and April, the majority of points lie between 0 and 10 minutes, with a considerable number of points above that line. April is somewhat better than March in that there are fewer very wide gaps, but this is still not a pretty sight when contemplating “on time performance”. Of course, this chart does not actually tell us if the cars were “on time” according to the standards, only that a lot of them were very close together (headway values close to zero), or very far apart. This is the service as riders see it. Moreover, this is service as it departs from the terminal, one place on the route where one might expect some effort at dispatching a regular service. Clearly this does not occur.

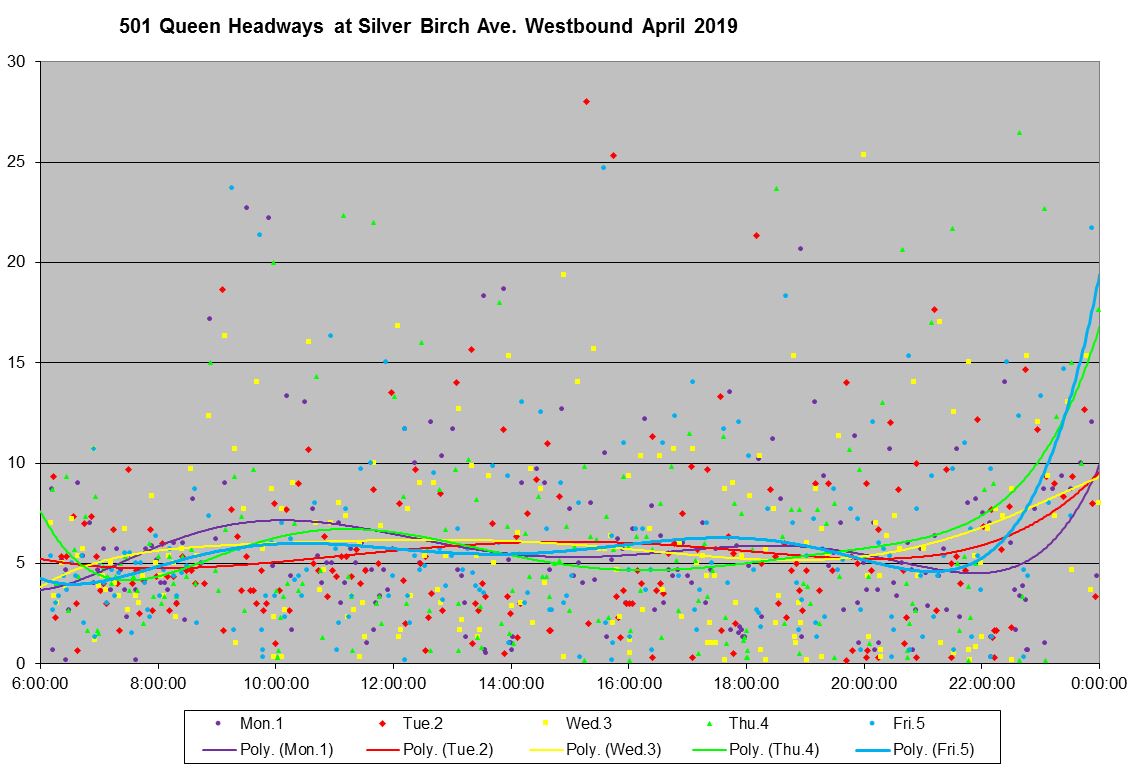
When these data are broken down by week with trendlines, we see that although the distribution of points varies, the overall pattern day by day is similar. Each day has its own colour. Note that the vertical axis tops out at 30, as opposed to 60 in the charts above.
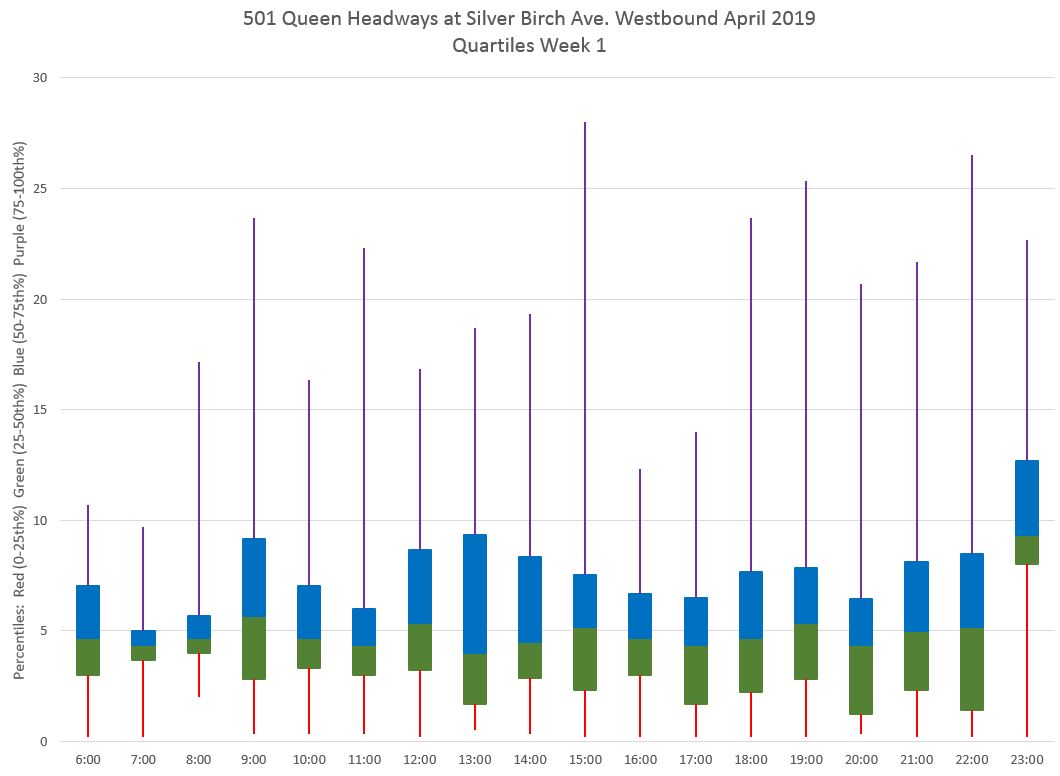
The chart below uses the same data with all five days grouped together, but formatted in “block and whisker” layout where the central blocks show the middle two quartiles and the upper and lower whiskers show the first and last quartile. The middle quartiles show the range of values for half of the headways with the median value marked by the line between the two halves of each box. The lower quartile (red whisker) routinely reaches down to near the zero line indicating that 25% of the service is running at close headways. The upper quartile (purple whisker) shows that 25% of the service is running with wide gaps.
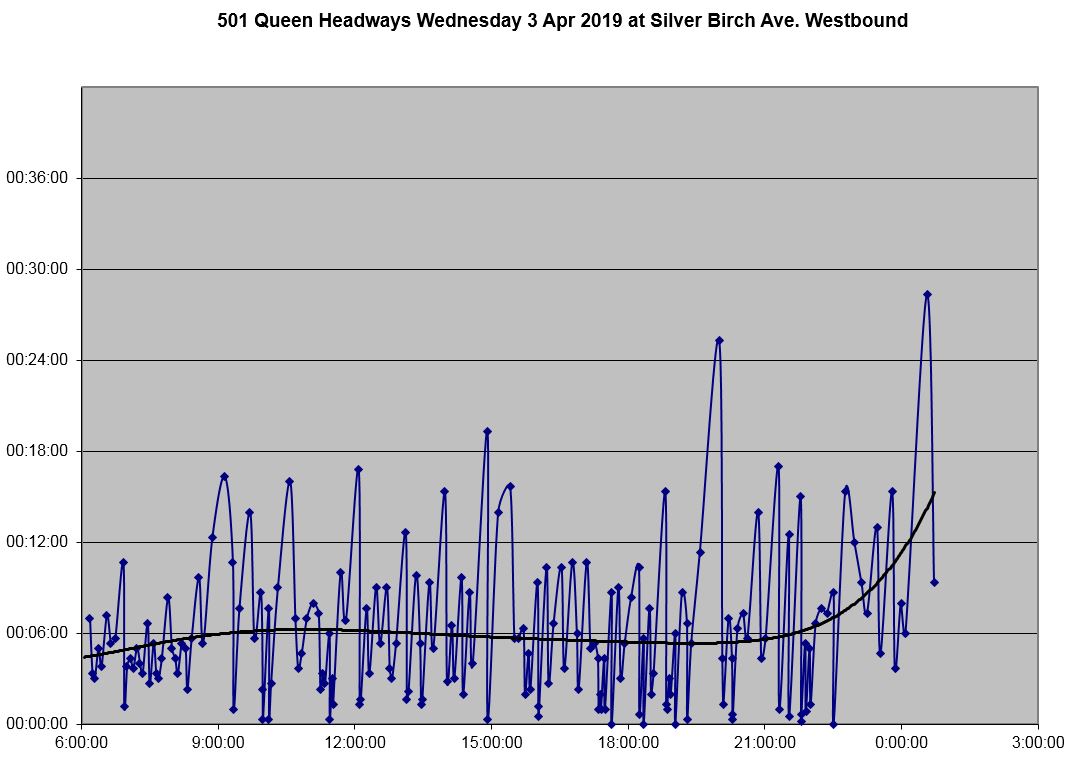
On a very fine grained basis, one day’s operations look like this. Cars leave the terminal in pairs, or very closely spaced, on a regular basis. The data here for Wednesday, April 3 show the typical pattern.
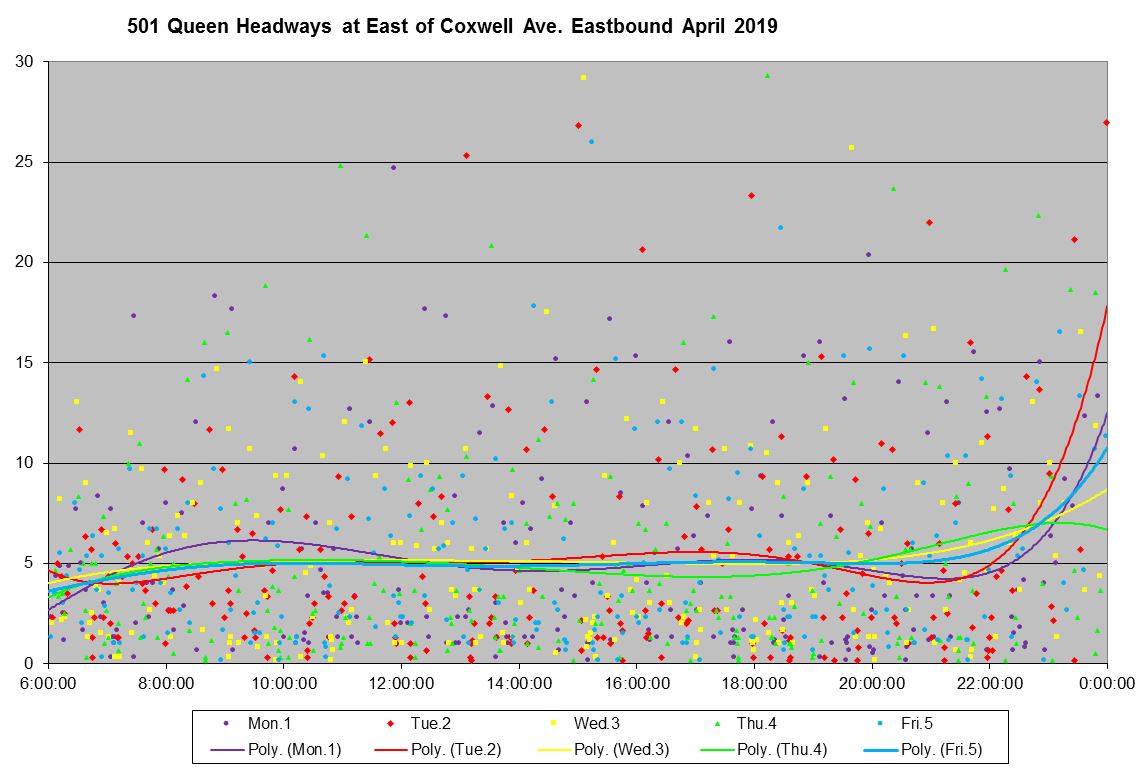
The effect of short turns on improving headways west of Woodbine Loop is shown in the chart for Coxwell westbound below. Although some of the worst gaps have been filled, a large number of cars are running at short headways only a few kilometres from the terminus.

This pattern is typical for 501 Queen going back at least through 2018, and uneven departures from Neville are not a new phenomenon.
Eastbound into the Beach
Service eastbound into the Beach arrives after a trip across the city. The trend lines in the charts below for service at Coxwell lie slightly below those for service at Woodbine showing the effect of short turns at Woodbine Loop. However, the headways were already quite erratic at Coxwell and short turns merely compounded the annoyance riders face.
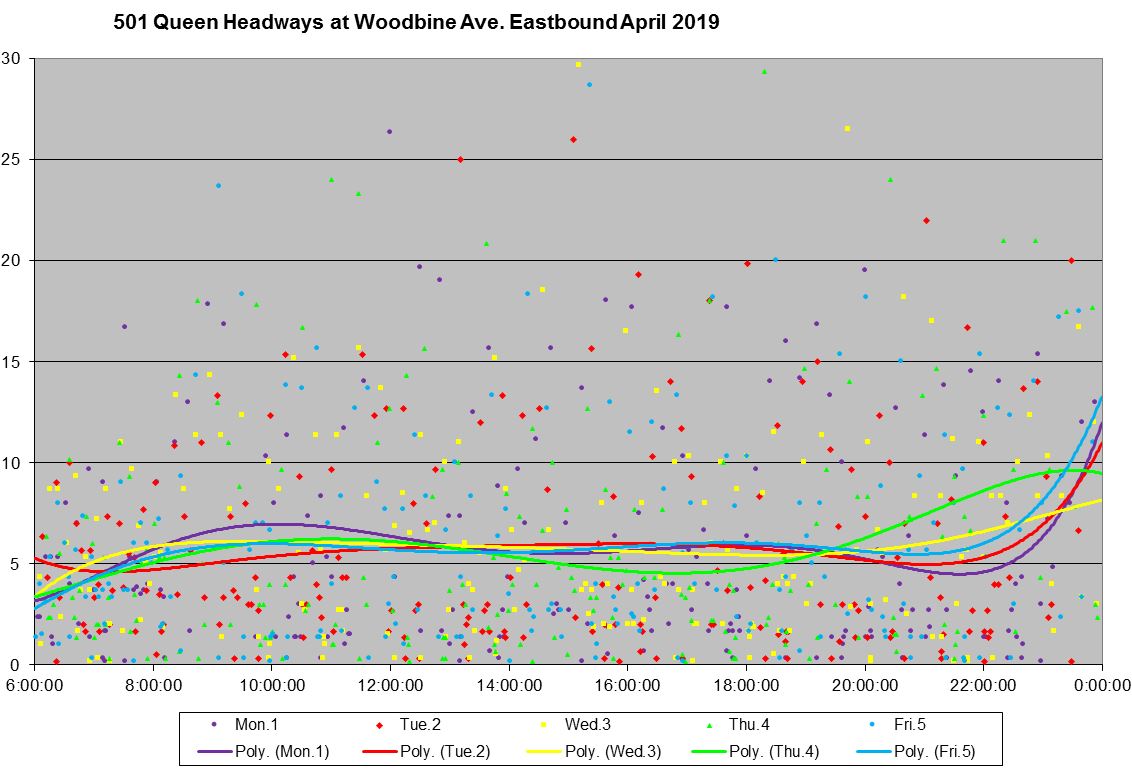
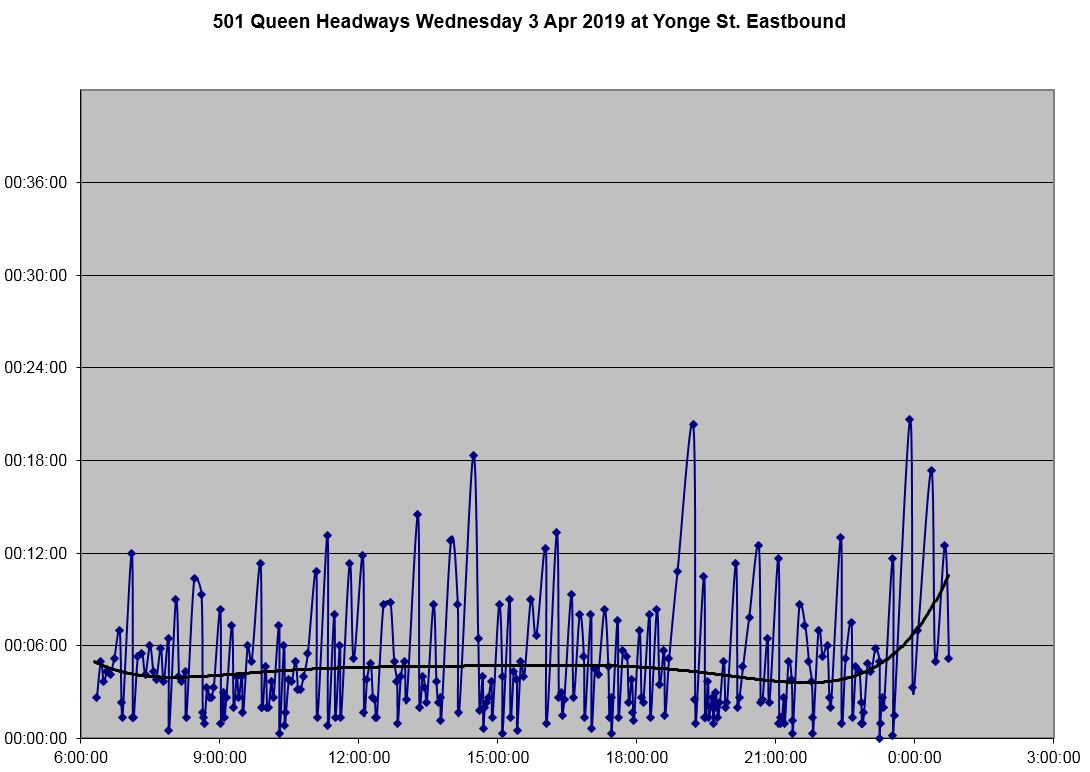
Just as service leaving Neville westbound has erratic headways, the same situation exists at Humber Loop. The pattern continues across the city leaving riders with unpredictable wait times for service and uneven loads on streetcars. At Yonge Street, service is uneven long before it reaches the Beach. Many cars are running at short headways. (I will turn to the service from Humber eastbound in a later article.)
The spike at about 19:00 was caused by the echo of congestion westbound over an hour earlier coming east across the route as an ever-widening gap. The cars following this gap were all the smaller CLRVs, not the much larger Flexitys.
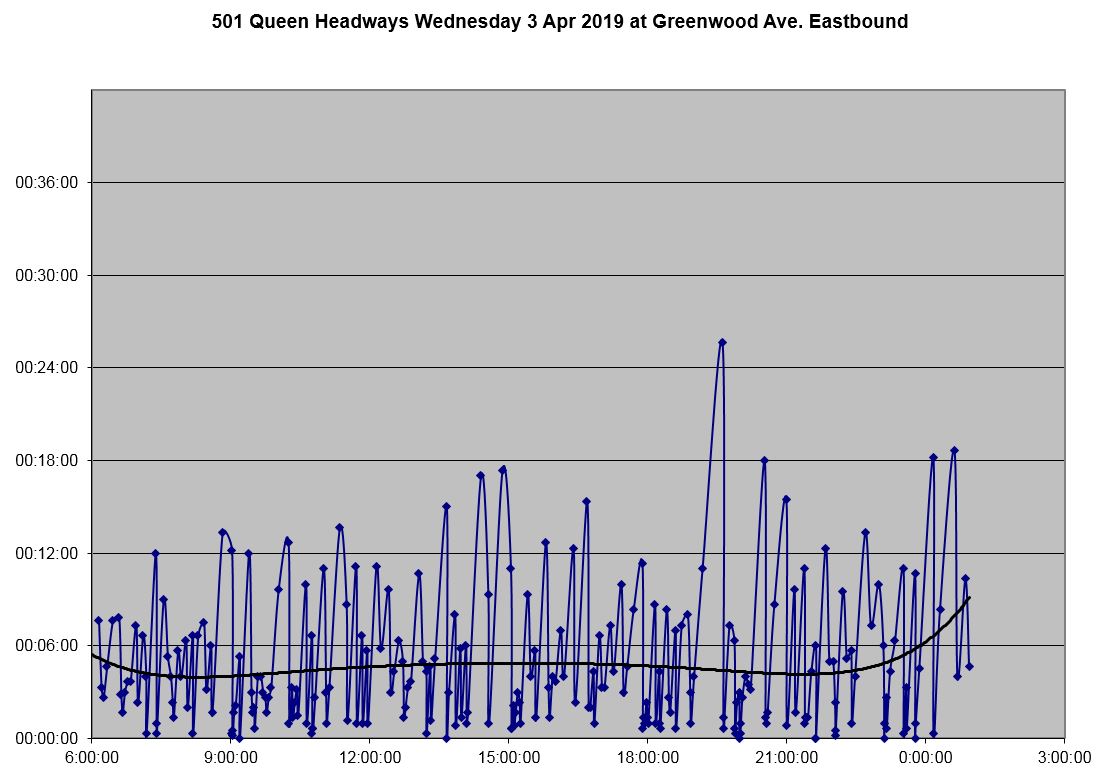
By the time the service reaches Greenwood, the gaps have widened, notably the one in the early evening.
At Coxwell, there is an additional wide gap at about 15:00 caused by a service blockage that triggered short turns at Russell Carhouse (between Greenwood and Coxwell).

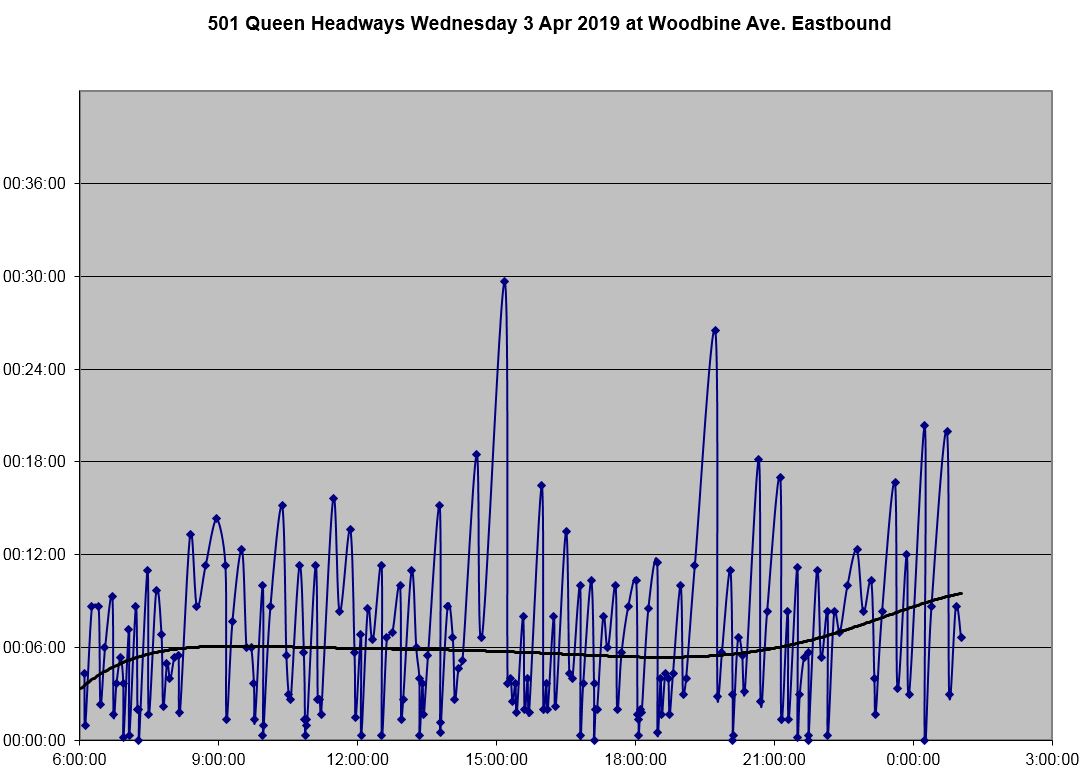
At Woodbine, the effect of short turns is evident especially between 8:00 and 10:00 when headways are notably wider than at Coxwell.
Full Chart Sets
For those who want the full sets of charts:
- 501_201903_SilverBirchAve_WB_MonthHeadways
- 501_201904_SilverBirchAve_WB_MonthHeadways
- 501_201904_EastofCoxwellAve_EB_MonthHeadways
- 501_201904_WoodbineAve_EB_MonthHeadways
- 501_20190403_HeadwaysWB
- 501_20190403_HeadwaysEB
Coming Soon
In following installments in this series, I will review the service reliability from Humber Loop eastbound, as well as travel times across the route by vehicle type. I will also review the length of terminal layovers and recovery time.

I have a few points/questions I would like to pose.
Firstly, when the TTC uses/used the RAD streetcars, where were they parked prior to being run? Also, would it be feasible to begin every rush hour with a streetcar parked in McCaul Loop and one parked on Victoria St to cover any large gaps going eastbound or westbound respectively through downtown?
Steve: At carhouses, probably to be dispatched to routes that already need extras at the beginning of the peak. McCaul Loop is occasionally used for short turns. The real problem is that only a few extras will not make much of a difference across the downtown routes.
Secondly, since there is currently a mixed fleet of vehicles on the 501, does the TTC deploy the Flexity streetcars strategically or at random? I often see them bunched up and then none for a long time. There have been occasions where I’ve witnessed packed CLRVs going by Yonge during rush hour while there’s 4-5 Flexities tracking near Neville Park. It seems like the TTC does not consider the capacity of the vehicles, only the number of vehicles, when planning with a mixed fleet.
Steve: They are scheduled for specific runs and these have tended to lie in a block rather than being sprinkled throughout the service. It’s bad schedule design that misses the idea of making a route somewhat accessible by having every “nth” car as low floor.
Thirdly, I agree with you that the reasons for the increased short turns are more complex than those listed in the CEO report. I would say the poor route management and minimal attempts to space out service seems like the likely explanation. The TTC stated that it was due partially to the CLRV reliability yet the MDBF for March was greater than that of February. Looking at the chart, short turns decreased dramatically after 2014 yet that’s when the Flexities were being introduced and mixing with CLRVs on other routes and at the same time, CLRV reliability began to fall. Seems to contradict the explanation the TTC gives.
Steve: Over the years, I have found that the TTC always has explanations for poor service that sound credible but don’t hold up to the kind of argument you make.
LikeLike
I also believe that service issues and short turns are due in large part because of poor management of the line. I have found that on the portion west of Humber Loop (the old 507 Long Branch car), service seems far more reliable since the split was brought back. Two factors account for this in my opinion: a shorter route and, more importantly, not having to go through the downtown core.
The shorter route helps as a delay on one streetcar is easier to fix. But also because the a back up will not affect service down the line. It would almost work better if they had two branches of the 501 Queen like they have done with the 504 King: Humber (or Park lawn in the future) to Woodbine and McCaul Loop to Neville Park.
Steve: A scheduled short turn at Woodbine (or equivalently splitting the route and sending half of the service to Bingham replacing the 22 Coxwell service) would guarantee lousy service for everyone. The basic headway on Queen is not as good as on King, and if you split it, that would be even worse. Riders on Roncesvalles and on Broadview have noticed the less frequent service since more cars are concentrated between Sumach and Dufferin, and the effect in the Beach would be very bad. Imagine if every other Queen car was scheduled to turn back at Sunnyside. Just how much service would ever reach Humber?
Your scheme only has a chance with a substantial improvement in scheduled Queen service overall, and even then I would be leery of it.
LikeLike