Streetcars Come To Scarborough

On May 25, 2021, Metrolinx moved the first of its test LRVs from the Mount Dennis maintenance facility at the west end of the new Eglinton Crosstown route to the more-or-less completed section of the line between Brentcliffe and Birchmount. This move was done by truck and trailer as the central tunnel section is not yet available. There is no definitive date for the tunnel to open for testing all the way east to Brentcliffe Portal, let alone for revenue service.

The cars are delivered to a temporary ramp installed at Rosemount Drive (between Birchmount and Ionview) where they are unloaded. From that point, they run under their own power.

Initial testing will be at low speed to check clearances and track geometry, and Metrolinx will then move up to regular service speeds and train operation. When cars are not out on the line for tests, they will be stored inside of the tunnel west of Brentcliffe portal.

Photos and videos of this event are on the Metrolinx Blog, and a selection sent to me by Harold McMann (to whom much thanks!) appears below.

And, yes, of course they are “Light Rail Vehicles”. A rose by any other name …

Headway Quality Measurement: Update

This article should be read in conjunction with Headway Quality Management: A Proposal for which this is a response to some questions and suggestions in the comments, and adjustments of my own in the interim. Specific routes discussed here are:

  • 52 and 952 Lawrence West local and express services
  • 504 King streetcar service (December 2020 before the diversions now in place for construction work)

Changes in format include:

  • Better spacing of the columns in the headway distribution charts for clarity,
  • Separation of the AM and PM peak periods for an express service that only operates for a few hours of each period, and
  • Changes in the layout and colour scheme of the headway distribution charts to emphasize the portion of service that lies within the target band of headways.

Both routes reviewed here show the problems of branching services and wide differences in scheduled service. A service may look “good” where all of it branches overlap, but be much less reliable on the unique segments. Vehicles may or may not be “on time”, but service riders experience does not accord with the TTC’s claims of high reliability. Indeed, there are cases where schedules contain built-in gaps that exist as part of blending services and managing transitions between service periods. They “work” for the schedule, but not for the rider.

One can argue that my proposed methodology should be adjusted with narrower or wider target bands. That’s easy to do, but the important issue here is to measure service as riders actually experience it, looking at various points on routes and all times of the day. The TTC’s scheme of looking only at terminals and averaging results over all time periods buries variations in service quality that riders know all too well.

Continue reading

A Very Busy GO Corridor (Updated)

Debates on the effect of Metrolinx service expansions often turn on noise and vibration effects, the degree to which any new or modified service will change the communities through which lines pass. Nowhere is this more striking than in Toronto’s Riverside district where an existing three-track GO corridor will be widened with a fourth GO track plus two Ontario Line tracks.

Reviews of the effects along the GO and OL corridor are hundreds of pages long for those who have the stamina to dig through appendices in so-called environmental reviews, but the material is inconsistently presented. Three separate projects affect this corridor, but no study considers the combination of three services.

This is a major oversight, and it hobbles any public consultation. Metrolinx appears either unable to answer valid questions about the effects of new services, or worse unwilling to reveal information that they should already have. Past experience makes communities distrust what Metrolinx says especially if “consultation” sounds more like cheerleading for decisions made long ago by sage transit wizards.

Updated 4:15 pm: Due to an error in a spreadsheet, the summary counts are off a bit because existing service was included in future totals. This has been fixed.

Continue reading

TTC Plans 60 Streetcar Order (Updated)

On Tuesday, May 25, 2021, the TTC will hold a special meeting to confirm that it will purchase the full 60 additional streetcars proposed in their 2020 Fleet Procurement Strategy and Plan. 13 of these cars are already on order thanks to funding from the City of Toronto, and the remainder will come thanks to recently announced funding from the provincial and federal governments.

The project budget includes a placeholder amount of $100 million for the proposed renovation of Harvey Shops at Hillcrest as a small carhouse for about 25 cars. The remainder of the 264-car fleet will fit within existing carhouses at Leslie, Roncesvalles and Russell once renovations are complete at the two older sites.

The costs will be shared among all three governments as shown below:

Updated May 22, 2021:

The TTC’s Interim CFO, Josie La Vita, commented:

As part of their year end process, the  City annually reviews its accounts.  There was funding left in a reserve dedicated to TYSSE that had not been fully utilized.  The reserve can only be used for TYSSE purposes. By applying those reserve funds to TYSSE expenses this frees up the debt that was being used to fund those costs and now can be used to fund other expenditures.  

Source: Email from Stuart Green, TTC Senior Communications Advisor

Based on the January 2020 level of service on 512 St. Clair (20 cars), that route would use all of the cars proposed for storage at Hillcrest. The project estimate does not include any allowance for the dead-head time that will be saved with a yard much closer to the route than today, and this should be shown as an offsetting saving to the capital cost.

With a fleet of 264 cars and a target spare factor of 18 percent, there should be 224 cars available for service. In January 2020, the peak streetcar service was only 142 cars, partly because the first third of the Flexity fleet is going through a major overhaul to correct manufacturing defects. The change will represent an increase of almost 60 percent in the available fleet. Now all the TTC needs is riders to fill these cars, and operators to drive them.

Although there have been proposals for reconfigured streetcar routes in the past, there is nothing definite on that score. A related issue is the timing of the Waterfront East and Broadview streetcar extensions for which a completion date keeps drifting into the future.

The TTC estimates that this change will also release 50 buses that can return to that network. More buses run on streetcar routes today (about 70 at peak), but that is due to construction projects which tend to occur during periods when the full bus fleet is not required (summer schedules).

Headway Quality Measurement: A Proposal

For regular readers of this site, it will be no surprise that my opinion of the TTC’s reporting on service quality is that it is deeply flawed and bears little relationship to rider experiences. It is impossible to measure service quality, let alone to track management’s delivery of good service, with only rudimentary metrics.

Specifically:

  • The TTC reports “on time performance” measured only at terminals. This is calculated as departing no more than one minute early and up to five minutes late.
  • Data are averaged on an all-day, all-month basis by mode. We know, for example, that in February 2020, about 85 per cent of all bus trips left their terminals within that six minute target. That is all trips on all routes at all times of the day.
  • No information is published on mid-route points where most riders actually board the service.

Management’s attitude is that if service is on time at terminals, the rest of the line will look after itself. This is utter nonsense, but it provides a simplistic metric that is easy to understand, if meaningless.

Source: March 2021 CEO’s Report

There are basic problems with this approach including:

  • The six minute window is wide enough that all vehicles on many routes can run as pairs with wide gaps and still be “on time” because the allowed variation is comparable to or greater than the scheduled frequency.
  • Vehicles operate at different speeds due to operator skill, moment-to-moment demand and traffic conditions. Inevitably, some vehicles which drop behind or pull ahead making stats based on terminal departures meaningless.
  • Some drivers wish to reach the end of their trips early to ensure a long break, and will drive as fast as possible to achieve this.
  • Over recent years, schedules have been padded with extra time to ensure that short turns are rarely required. This creates a problem that if a vehicle were to stay strictly on its scheduled time it would have to dawdle along a route to burn up the excess. Alternately, vehicles accumulate at terminals because they arrive early.

Management might “look good” because the service is performing to “standard” overall, but the statistics mask wide variations in service quality. It is little wonder that rider complaints to not align with management claims.

In the pandemic era, concerns about crowding compound the long-standing issue of having service arrive reliably rather than in packs separated by wide gaps. The TTC rather arrogantly suggests that riders just wait for the next bus, a tactic that will make their wait even longer, rather than addressing problems with uneven service.

What alternative might be used to measure service quality? Tactics on other transit systems vary, and it is not unusual to find “on time performance” including an accepted deviation elsewhere. However, this is accompanied by a sense that “on time” matters at more than the terminal, and that data should be split up to reveal effects by route, by location and time of day.

Some systems, particularly those with frequent service, recognize that riders do not care about the timetable. After all, “frequent service” should mean that the timetable does not matter, only that the next bus or streetcar will be reliably along in a few minutes.

Given that much of the TTC system, certainly its major routes, operate as “frequent service” and most are part of the “10 minute network”, the scheme proposed here is based on headways (the intervals between vehicles), not on scheduled times.

In this article, I propose a scheme for reporting on headway reliability, and try it out on the 29 Dufferin, 35 Jane and 501 Queen routes to see how the results behave. The two bus routes use data from March 2021, while the Queen car uses data from December 2020 before the upheaval of the construction at King-Queen-Roncesvalles began.

This is presented as a “first cut” for comment by interested readers, and is open to suggestions for improvement. As time goes on, it would be useful for the TTC itself to adopt a more fine-grained method of reporting, but even without that, I hope to create a framework for consistent reporting on service quality in my analyses that is meaningful to riders.

Continue reading

Billions Promised for Toronto Transit

May 11, 2021, brought a shower of money, or at least promises of money, onto plans for rapid transit in Toronto. The federal government announced a total of $10.7 billion to fund a 40 per cent share in the Ontario, Scarborough, Yonge North and Eglinton West projects.

May 12 brought another, albeit smaller, promise of $180 million each from the federal and provincial governments to fund expansion of the streetcar fleet on which Toronto already planned to spend $208 million.

On May 13, a funding announcement for the Hamilton LRT line is expected. This is a project the province had tried to kill.

Combined with their recently announced national transit funding program, the federal Liberals are making a real splash in the transit pond, at least for big-ticket capital projects.

Before we all head out for a socially distanced beer or champagne celebration, there are important caveats.

Why 40 Per Cent Isn’t Necessarily 40 Per Cent

When the federal government agrees to fund a project, the dollar value is (or more accurately will be) “as spent” dollars without any provision for inflation. If Queen’s Park says that the Ontario Line is going to cost $10.9 billion, that’s what the 40 per cent is calculated on. Add-ons or inflation will be entirely on Ontario’s dime, unless a future federal government takes pity.

The last time a subway project ran out of money due to a hard cap on the “commitment” was with the Sheppard Subway’s terminus at Don Mills. Ironically, it was a conservative provincial Premier, Mike Harris, who capped spending on that project, and Toronto did not have enough money to continue east to Victoria Park, much less beyond to Scarborough Town Centre.

Cost overruns on the Vaughan subway extension were shared by Toronto and York Region.

The announced costs for the four Ontario key projects in Toronto are:

  • Ontario Line: $10.9 billion
  • Yonge North: $5.6 billion
  • Scarborough: $5.5 billion
  • Eglinton West: $4.7 billion
  • Total: $26.8 billion

“The federal government is contributing 40% of each project, up to a total of $10.4 billion” according to Infrastructure Canada’s announcement. This could give leeway for allocations to move between projects, but sets a total on the group.

This puts all four projects in a box, and will make adding costs to them very difficult because there will be no matching federal dollars. The dubious nature of the spending, notably on the Eglinton West underground alignment, appears to be of little concern to the feds who do not want to be seen as interfering in local decisions.

That stance takes an odd turn when we see that there are conditions on this support, although I suspect that many are window dressing.

The federal government understands that every taxpayer dollar invested in public transit must have multiple benefits including creating good jobs, building more equitable and inclusive communities, and tackling climate change. That is why the federal government’s funding is dependent on satisfying conditions including demonstrating how the investments will drive down emissions and build resilience, substantive environmental reviews, ensuring affordable housing along the line, incorporating accessibility, mitigating local concerns, maximizing benefits for communities including through Community Benefit Agreements, and meeting employment thresholds for underrepresented communities including Black, Indigenous and people of colour, and women.

Just what is meant by “substantive environmental reviews” and “mitigating local concerns” is anyone’s guess especially in light of Canada’s rejection [22 MB PDF] of a requested environmental review of the Ontario Line. In brief, the feds hold that there are provincial and municipal processes in place to address concerns, and moreover that there are few areas of federal jurisdiction touched by the Ontario Line.

Metrolinx projects already provide accessibility and include Community Benefit Agreements. These “requirements” simply reinforce what they are already doing.

The Ontario Line is under fire in at least two locations, Riverside and Thorncliffe Park, because of intrusions on the community. In Riverside, the debate is over underground vs at grade construction, as well as the proposed alignment, and Metrolinx’ possible misrepresentation of the combined GO Transit and Ontario Line corridor from the Don River to Gerrard. In Thorncliffe Park, the proposed maintenance yard requires the expropriation of a group of offices and shops that form a community centre. A Mosque is also affected, although it plans to move to another building nearby.

Changing the design in either of these areas will almost certainly raise costs, and the project cap will be used to counter any such proposals. Oddly enough, this was not an issue on Eglinton West which is going undergound at a cost of nearly $2 billion so that the good people of Etobicoke do not have to see streetcars in their neighbourhood. That decision is now baked into the project cost, and Metrolinx is on the verge of awarding the tunneling contract.

The planned alignment of the Yonge North extension under the Royal Orchard neighbourhood is also under fire, although Metrolinx claims that the line will be so deep it will have no effect on the residential community above. That is an intriguing claim given that the tunnel portal is in the GO rail corridor and the trains will not leap instantly from deep underground to the surface.

The Scarborough decision has long been a fait accompli, but the current announcement commits the feds to a 40 per cent share of the expanded project.

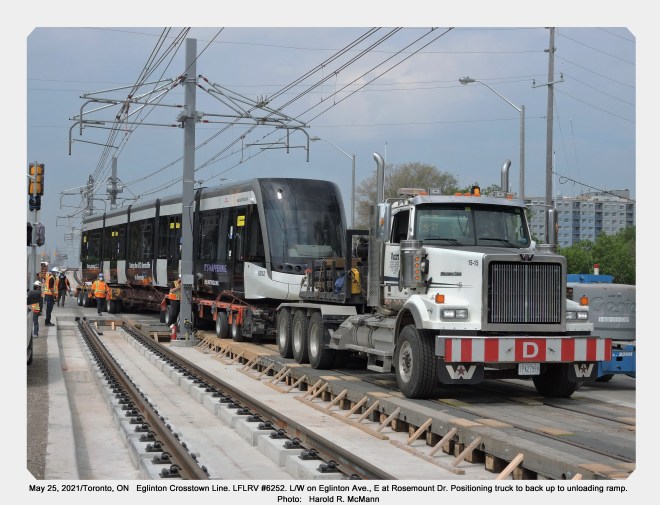
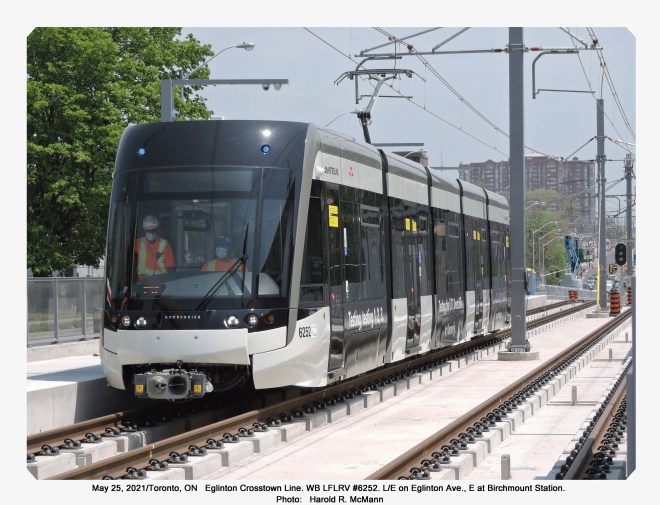
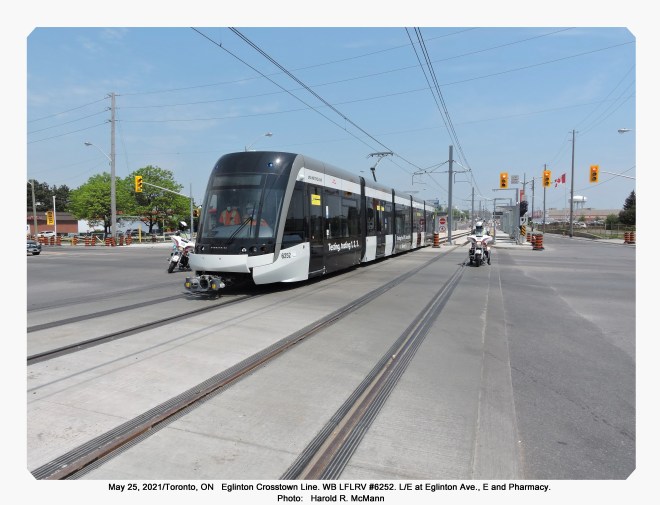
More Streetcars for Toronto

In 2020, the TTC proposed that the streetcar fleet be expanded by 60 cars, and the City signed on to fund 13 of these. The remaining 47 are now funded by contributions from the other governments, a move that will keep Thunder Bay happy with a vehicle order to keep the now-Alstom (formerly Bombardier) plant going. Some work will also go to the Alstom plant in La Pocatière, Québec.

The subway extensions will also need new cars, but unlike the streetcar fleet, there is no open contract to simply be extended. It will be interesting to see how additional cars for Line 1 and a new fleet for Line 2 will be tendered, and what political machinations will bear on the vendor selection.

The expanded streetcar fleet will not all fit in existing facilities at Leslie, Russell and Roncesvalles. The TTC plans to renovate Harvey shops at Hillcrest as a small carhouse serving (at least) the 512 St. Clair route. The existing streetcar maintenance facilities at Hillcrest were designed in the 1920s for standard sized streetcars and could only host a few Flexitys at a time during the early testing and acceptance period.

Now that the full order for more cars has funding, the Hillcrest renovations can proceed.

Left at the Altar

Important projects which might benefit from federal funding are still sitting in limbo including:

  • Eglinton East LRT to UTSC and Malvern
  • Waterfront East LRT to Broadview
  • Line 2 Bloor-Danforth Automatic Train Control and fleet renewal
  • New Line 2 maintenance facility west of Kipling Station (Obico yard property)

There is a separate federal program to fund transit, but that is already partly earmarked for electrification of the bus fleet and garage upgrades. How much will be left for other projects remains to be seen.

With all of this new money for Toronto transit, the TTC needs to update its Capital Plan to reflect the current status of project funding and the remaining budget shortfall. We might have billions worth of promises, and even a few celebratory bottles to drink, but there is a long way to go thanks to decades of deferred investment.

TTC Board Meeting: May 12, 2021

The TTC Board will meet at 10:00 am on Wednesday, May 12. The agenda is short, but contains a few major items.

After the Board meets, I will update this article based on their discussions and staff presentations.

Continue reading

HotDocs 2021 Part I

HotDocs 2021 began on April 29 and runs officially to May 9. For the hard core doc fans, the unlimited access pass gives an extra 10 days to watch films stretching the online festival out to May 19. I will post reviews of films here from time to time over this period.

Most films are still available to ticket buyers until May 9. Even after that viewing period, the good films are worth watching for if they show up on streaming services, TV channels like TVO or PBS, or, when we can return to them, real live theatres.

The films reviewed here were screened on Thursday, April 29 through Saturday, May 1.

Apologies to those looking for transit articles. I’ve been at the movies!

Reviewed here:

Continue reading

The TTC CEO’s Report: Old Wine in New Bottles?

The April 2021 TTC CEO’s Report came in a new format, and with that a hope that the long-promised improved content had arrived, not just better graphics. The new report looks good, but it continues to over-simplify key details and omits measures of major system components.

Back in January, I reviewed the then-current version in Measuring and Reporting on TTC Operations: Part I and planned a Part II that would look at how metrics used in other cities might be applied in Toronto, and what they would reveal. That article has been sitting in rough draft for a while. Building alternate views of the TTC requires some data crunching I just have not brought myself to do yet.

I recommend that earlier article to readers if only to avoid reiterating the shortcomings of past reports here.

A key point is that the report tells us what the TTC did, not what it might do if its assets were fully utilized. For years the combined tropes of “we have no buses” and “we have no garage space” were used to rebuff calls for more service when the real problem was underfunding on both the capital and operating side. More service means not just more buses, but hiring enough drivers to take as many buses as possible out of garages and onto the streets.

The CEO’s report tells us how successful the TTC was at fielding scheduled service, but is silent on the constraints that prevent the operation of more.

In the pandemic era, it is not enough to say that the TTC provides “98% service hours for 32% ridership” when social distancing fundamentally changes how we think about system capacity. As ridership returns, there will be a balancing act between providing more space (i.e. more service, more seats) and changing crowding standards. We are likely to see a period when the social comfort riders hope to see will exceed the space the TTC can provide due to both financial and fleet limitations. Already service is being shuffled between lower and higher demand routes to address crowding without extra costs.

The eagle-eyed readers will note that the cover photo on King looking east from Yonge includes a 514 Cherry car (a route that was replace by the 504A King to Distillery service in October 2018) and a CLRV (a vehicle retired at the end of 2019).

An important improvement is the presence of a “Hot Topics” section to focus attention on key items of note. That said, a few potential problems come to mind:

  • How does a topic get on this list?
  • What happens when a topic remains “hot” for an extended period?
  • Is there an upper bound to the hot topic count?

Most of the “hot topics” in this report belong in the permanent lists as they represent standing issues, not monthly flashes. If the “hot topics” really are “hot”, they should appear sooner than three-quarters of the way through the report.

The report has no tracking of infrastructure reliability even though, for example, track, power and signals are responsible for interruptions of subway and streetcar service.

Averages vs Details

A common problem throughout the TTC’s presentation of various metrics is the degree of averaging, of consolidating data and thereby missing its variability in time, space and effect on riders. If something “works” 90 per cent of the time, that may sound good, but that other 10 per cent can have a disproportionate negative effect. Moreover, as discussed here many times, it is not enough for “n” vehicles to show up every hour. They must be reasonably spaced to give predictable wait times and crowding levels.

By reporting on average values, the TTC ignores the day-to-day, trip-to-trip experience of riders.

Corporate Views vs Rider Views

Corporate plans look at the world from a corporate view, but the TTC’s job is first to serve riders and move people around the city.

The “core metrics” are now aligned with the corporate plan’s strategic objectives and, in theory, demonstrate how the TTC is advancing that plan’s goals. This approach consolidates metrics that are most important to riders in one category, and shuffles some key ones into an appendix.

There is a particular problem that accessibility issues do not get their own grouping because this is not one of the TTC’s five corporate objectives. Given the TTC’s long history of underserving these needs, metrics of accessibility should be reported as a group and tracked together rather than being scattered through each section of a corporate view.

This does not mean hiving Wheel-Trans off into its own section, but recognizing that there are many aspects to accessibility that affect users of both WT and the “conventional” system, especially now that riders are encouraged to use the “family of services” as much as possible.

Metrics should include items from the capital budget, not just strictly “operating” statistics. Ongoing plans and progress on key projects that will affect system capacity, safety and accessibility should be included even though they may be in the capital budget. It does not matter (and riders do not care) how various parts of the system are funded, only that system improvements are tracked in one place.

This would not preclude the quarterly Financial Report from going into more detail, but the absence of “one stop shopping” in the CEO’s Report weakens its value.

There are five strategic areas plus a group called “Hot Topics”:

  • Ridership
    • Revenue rides (linked trips)
    • Customer boardings (unlinked trips)
    • Wheel-Trans passenger trips
  • Financial
    • Fare revenue
  • People and Diversity
    • (Metrics to be announced)
  • Safety and Security
    • Lost time injury rate
    • Customer injury incidents rate
    • Offenses against customers
  • Customer Experience
    • Customer satisfaction
    • Customer service communications
    • On-time performance (subway)
    • On-time performance (streetcar and bus)
    • On-time performance (Wheel-Trans)
    • Accessibility: Escalator and elevator availability
  • Hot Topics
    • Wheel-Trans contact centre wait time
    • Customer mask use
    • Bus occupancy

Of the three Hot Topics, only customer mask use might be considered as a “topic of the moment” although it will be with us as long as the pandemic and infection are a concern to riders.

Problems with Wheel-Trans booking systems have existed for years. Measures of availability and response time deserve a permanent spot within an Accessibility group.

As for bus occupancy, this is fundamental to the perceived quality of transit service. This has been a pressing issue for years, but is a particularly hot topic in the pandemic era . We often hear about “run as directed” buses, but never see stats to support the benefit they might provide at key locations rather than as a system average. With Automatic Passenger Counters across the bus fleet, the TTC should report regularly on crowding at a granular level including problem routes, locations and times of the day.

Continue reading

Metrolinx Ducks and Weaves in Riverside

Metrolinx held one of their online consultations on April 22. This time the subject of the Ontario Line between the Don River and Gerrard Street. Normally, I would not review meetings like this in detail. However, I had proposed an alternative alignment and have worked with community groups on this. A reply to statements made by Metrolinx at the meeting is, sadly, essential because of the misdirection and misinformation in their presentation.

The presentation deck for the meeting is available online as is the video of the session on the event page. I will not rehash all of this material and leave these to interested readers.

It was quite clear that Metrolinx thought that they had a presentation to answer the community’s questions, and they launched into it in their usual confident style. However, as the session progressed, and especially during the question-and-answer period (which require a meeting extension to fit everything in), things started to come unglued.

A common tactic would be for Metrolinx to reply to a question with either a partial response, or with a discussion of an issue that had not been asked. I could be generous and assume that they just didn’t hear the question properly, but this happens too often to be pure chance (or mere incompetence). This suggests a deliberate misrepresentation of questions by providing an answer to something that was not asked.

Many questions were submitted in advance on the event page, and these were bundled by the moderator for Metrolinx’ answers. I have consolidated responses from different parts of the session to group related comments together.

Readers of previous articles will be pleased to see that Metrolinx has produced a map with North at the top where it belongs.

The original hoopla about this portion of the Ontario Line included the alleged virtues of the “straddle” design with OL tracks bracketing the GO tracks to allow cross-platform transfers at East Harbour. Metrolinx has now discovered that this brought extra cost and design disadvantages, and they now tout the side-by-side alignment’s benefits. Metrolinx plans are immutable, at least until they embrace a better idea.

Presentation deck, p. 6
Continue reading