In recent days, Mayor Tory has announced, twice, a ten point program to address crowding on the TTC. The effectiveness of this program is limited by years of bad political decisions, and the hole Toronto has dug itself into is not one from which it will quickly escape.
This article is a compendium of information about the three major portions of the “conventional” (non-Wheel-Trans) system: subway, bus and streetcar. Some of this material has appeared in other articles, but the intent here is to pull current information for the entire system together.
Amendment February 15, 2018 at 5:30 pm: This article has been modified in respect to SmartTrack costs to reflect the fact that over half of the cost shown as “SmartTrack” in the City Manager’s budget presentation is actually due to the Eglinton West LRT extension which replaced the proposed ST service to the commercial district south of the airport. A report on SmartTrack station costs will come to City Council in April 2018. Eglinton LRT costs will take a bit longer because Council has asked staff to look at other options for this route, notably undergrounding some or all of it.
The SSE itself is not on the agenda, but it has been the subject of much recent debate over when the projected cost and schedule for the extension will be released.
In the November 2017 CEO’s Report, the project scorecard included a schedule showing that 30% design would be complete in the second quarter of 2018, and an RFP [Request for Proposals] would be issued in the third quarter. Even when this report came out, former CEO Andy Byford was hedging his bets about a spring 2018 date saying that more work would be needed to verify and finalize the figures. A key note in this scorecard states:
EFC [Estimated Final Cost] was approved in 2013 based on 0% design. With the alignment/bus terminal now confirmed by City Council, the project budget and schedule will be confirmed as design is developed to the 30% stage, factoring in delivery strategy and risk. The performance scorecard will continue to report relative to the project’s original scope, budget and schedule, as approved by Council in 2013, until the project is rebaselined at the 30% stage in late 2018.
In other words, neither the schedule nor the projected cost reflected the evolving and expanding design of this project.
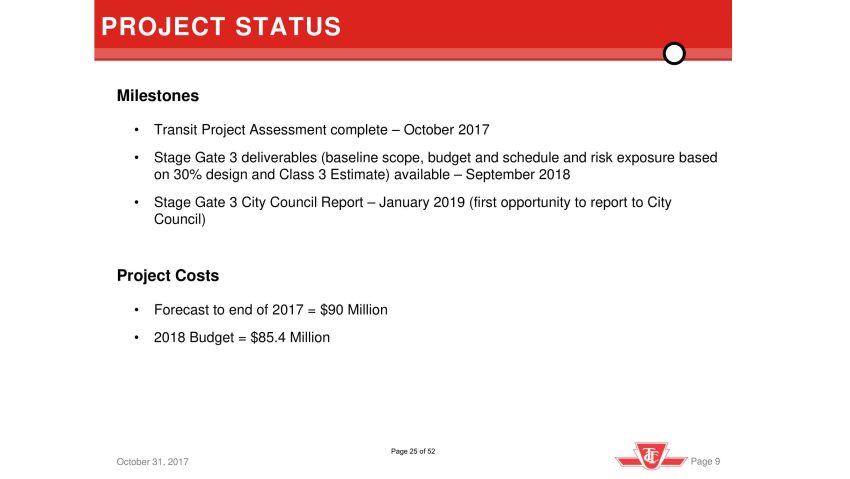
Jennifer Pagliaro in the Star wrote about the result of a Freedom of Information Request that revealed a briefing to Mayor Tory in September 2017. That briefing included a statement that the cost estimate for a Stage 3, 30% design, would be available in September 2018.
Because Council will not meet until 2019, numbers that might have been available before the election would not be released until after the new Council takes office. After the story appeared, City staff replied:
The cost information referenced in page 9 of the October TTC briefing deck refers to the planned timing for initial cost inputs from TTC engineering staff. These are not the full cost estimates necessary for consideration by Council. Further work will be required to appropriately account for financing, procurement model, market assessment and other critical factors. The final cost estimate, subject to the variability ranges noted below, will include these inputs.
This additional work will be undertaken by various TTC staff as well as city officials from corporate finance, financial planning, city planning and other divisions. [Tweet from Jennifer Pagliaro, February 7, 2018]
I wrote to the TTC’s Brad Ross about this conflicting information, and particularly about the question of how an RFP could be issued in 3Q18 when Council would not be approving that the project pass beyond “stage gate 3” until 2019. He replied:
No RFP will be issued until after Council approval. You will note in the Key Issues and Risks section of the scorecard from November reads, “The performance scorecard will continue to report relative to the project’s original scope, budget and schedule, as approved by Council in 2013, until the project is rebaselined at the 30% stage in late 2018.”
To be consistent with the report to Council in March 2017, only the revenue service date was revised in the scorecard (from Q4 2023 to Q2 2026). The TTC recognizes and acknowledges that this has led to confusion. The TTC will be taking steps to ensure greater clarity in its next CEO Report in March 2018. [Email of February 9, 2018]
The February CEO’s report states:
Work continues to progress design towards Stage Gate 3, expected in fall of 2018. At this time, the project will provide initial cost inputs from the TTC team (includes detailed costs for the Scarborough Centre station, tunnel, Kennedy station, systems, property and utilities). Further work is underway by the new Chief Project Manager with key stakeholders within TTC and the City to define the activities, approval process and timelines to arrive at the final Class 3 Cost Estimate, Level 3 Project Schedule, and associated Risk Analysis.
As requested by City Council, a report will be presented at the first opportunity to the Executive Committee, TTC Board and City Council, which is expected to be Q1 of 2019. [pp 15-16]
The debate, as it now stands, is about releasing whatever material will be available in September 2018 so that it can inform the election debates. Additional costs as cited by the city would sit on top of the September numbers, but at least voters and politicians would know whether the SSE’s cost has gone up just for the basic construction, let alone factors related to financing and procurement that would be added later.
Meanwhile, SSE promoter Councillor Glenn De Baeremaeker speaking on CBC’s Metro Morning said:
I don’t think it matters what the costs are.
This has been taken to read that money is no object, and that well may be the political reality in Scarborough – there is no way the many politicians who have so deeply committed to the subway project can back out. De Baeremaeker continued:
Whether the costs go up or the costs go down, people who have tried to sabotage the subway and stop the subway, will continue to try to sabotage it, they’ll continue to try to stop it, and they will never vote for it. So I would challenge the Councillors who say “I want to see the cost”. My response is and if it’s a reasonable cost, will you support the subway? Well, no. [At 3:26 in the linked clip]
What De Baeremaeker does not address is whether he has an upper limit beyond which even his enthusiasm might be dimmed. Also, on the question of a “reasonable cost”, what has been lost here is the fact that the subway “deal” was sold on the basis that the $3.5 billion included the Eglinton LRT extension to UTSC Campus. What had been a $2 billion-plus subway when it was approved as a compromise by Council, quickly grew to $3 billion-plus, and the LRT extension is left to find alternate funding. One could reasonably ask whether the LRT was ever really part of the deal, or was simply there as a sweetener that pulled in wavering supporters who now see just how gullible they were.
A related issue that has not yet surfaced is the question of whether building the SSE for a 2026 opening will require concurrent changes in timing and/or scope for the planned renewal of the Bloor-Danforth subway including a new signalling system and fleet. A report on the renewal is expected in April 2018, although this date has changed a few times over past months. The TTC/City capital budget and ten year plan do not reflect this project, at least with respect to timing, and probably with respect to total cost.
Changes are coming to TTC routes in February with the most significant being on the streetcar network. I provided an overview of the streetcar changes in a previous article, but the details of headways and running times are in the spreadsheet linked below.
On the bus network, there are several tweaks to running times and headways.
Extra running time for Metrolinx construction projects will be provided on 36 Finch West, 63 Ossington and 71 Runnymede.
Evening service on the 12 Kingston Road bus will be modified so that trips after 10:30 pm on weekdays and 5:30 pm on weekends run via the 12B routing along Kingston Road instead of dodging north to serve Variety Village.
Service on 121 Fort York-Esplanade will lose one bus during weekdays all day except the AM peak, and weekend evenings. This route has chronically erratic service that affects demand, but that is not addressed in the change.
Minor service cuts and/or running time adjustments will widen headways on:
17 Birchmount (AM peak)
37 Islington (Midday weekdays)
40 Junction (Saturday morning)
79 Scarlett Road (PM peak)
111 East Mall (AM peak and midday)
Minor improvements and/or running time adjustments will shorten headways on:
40 Junction (Sunday afternoon)
42 Cummer (Weekdays)
102 Markham Road (AM peak)
On 1 Yonge-University, all crew change will now occur at Wilson Station rather than being split between Wilson and Eglinton Stations due to pending construction at the latter.
Updated February 8, 2018: The TTC has announced details of changes to bus and streetcar services on the west end of the 501 Queen route. This information has been added below in the section on that route.
The February 2018 schedules will bring major changes to the streetcar system. I will include these in a coming article with all of the details for the new schedules, but with the scope of the streetcar changes and the interest in this topic, here is a wrap-up of what is planned for these routes.
King Street Corridor
The current schedule calls for trippers to operate, primarily buses and in the AM peak, over the entire 504 King route. These will be replaced with four ALRVs (articulated streetcars) operating from Sunnyside Loop to Broadview. As actually operated, the AM trippers are already using CLRVs (regular sized streetcars) swapped from the 505 Dundas route. Four more ALRVs will be used as standby “run as directed” cars to supplement service on King as needed.
January Schedule
January Actual
February Schedule
AM Peak
CLRV
33
33
33
CLRV Tripper
7
ALRV Tripper
4
ALRV Run as Directed
4
Bus Tripper
7
PM Peak
CLRV
33
33
33
CLRV Tripper
2
ALRV Tripper
1
1
4
ALRV Run as Directed
4
Bus Tripper
2
The tripper schedules have been changed so that they better cover the peak periods.
The 503 Kingston Road Bus which now operates from Bingham Loop to York & Wellington during peak hours only will be replaced by a streetcar with service on weekdays peak and midday. This will replace the 502 Downtowner bus which changes to peak-only operation.
During the peak periods the 12′ headway of buses will be replaced by a 12′ headway of CLRVs on the 503 service, and it will be extended west to loop via Spadina, Adelaide and Charlotte Streets. Midday service will operate every 9′ replacing the existing 10′ service on the 502 Downtowner bus. This removes 6 buses/hour from Queen Street, and adds not quite 7 cars/hour to the section of King east of Spadina.
According to the TTC, track construction is planned on Wellington east of Yonge in May. It is not clear whether, when this is complete, the 503 will revert to its usual York street terminus as this would remove the added service between York and Spadina. Whether the Wellington Street work actually occurs remains to be seen as there were plans to defer this until 2019 to avoid complications with the King Street Pilot. The track recently became operational with the restoration of overhead on the one missing section between Church and Yonge westbound.
Service on 514 Cherry during the midday and early evening will be improved from every 15′ to every 10′ to provide added capacity on the King corridor. On Sundays from 10:00 am to 7:00 pm, service will improve from every 15′ to every 11′. (The 514 Cherry route is notorious for irregular headways at its terminals and so the scheduled headways may not match actual experience. This will be the subject of a separate article.)
In combination, these changes will increase the level of service on King Street with the effect concentrated downtown. In particular, there is little AM peak relief for riders inbound from Parkdale, Liberty Village and Bathurst/Niagara beyond a change in the timing of the trippers, whatever benefits the “run as directed” cars might provide and the gradual replacement of runs now operated with CLRVs by the new Flexitys as they become available.
501 Queen & 502/503 Kingston Road
As noted above, the 502 Downtowner midday bus service from Kingston Road to Queen & University will be replaced by the 503 Kingston Road streetcar operating to Spadina & King. Peak service on the 502 bus is not changed, and peak 503 streetcar service will operate at the same frequency, every 12′, as the former bus service. Midday service on the 503 streetcar will be slightly better at 9′ than the 10′ headway now on the 502 bus.
The 501 Queen schedules were written on the basis that Humber Loop would re-open, but work there will not be completed until later in the spring. The planned service would have seen 501 Queen cars operating from Neville to Humber with the 501L Queen bus running from Long Branch to Windermere. Pending the completion of Humber Loop, the streetcars will turn back at Sunnyside Loop, and the 501L buses will operate east to Roncesvalles. 501L buses will no longer run east and south to Dufferin Loop.
The looping and transfer arrangements for the 501L bus at Roncesvalles, and later at Windermere, have not yet been announced.
When 501 Queen streetcar service to Humber Loop resumes, the last service stop will be at South Kingsway because there will be no connecting services at Humber.
The 501M bus service via Marine Parade will be dropped because of low use. The 66 Prince Edward bus is available as an alternative, and it will continue on its diversion routing.
The 301 Queen night service is unchanged with two branches continuing to operate from Neville to Sunnyside (streetcars) and from Dufferin Loop to Long Branch (buses). This will be modified with the April schedules (details not yet announced).
Service on 501 Queen streetcar will be scheduled to operate with a mix of CLRVs and ALRVs on a more frequent headway than the current schedules that presume all ALRVs and their capacity. This has been a long-standing problem for Queen street where smaller cars attempt to handle demand on a service designed for larger vehicles. The improvement is about a 10% increase in cars/hour in the peak, and a 20% improvement off-peak.
Updated February 8, 2018
The planned changes to routes on the west end of Queen is different from that originally described in the service change memo. The following information is taken from the TTC Service Advisory page.
Effective February 18:
Streetcars will operate between Roncesvalles and Neville as originally planned.
501L buses will operate between Long Branch and Dufferin/Queen looping via Gladstone, Peel and Dufferin instead of running south to Dufferin Loop as they do now.
301L night buses will continue to run between Long Branch and Dufferin Loop.
The 501M Marine Parade shuttle will be discontinued as originally planned.
Effective April 1:
Streetcars will operate between Humber and Neville. However, Humber Loop will not be ready to reopen as a transfer point with bus routes, and so the connection to the 501L service will be at Windermere (if the information in the service memo still holds).
Effective early June:
Streetcars will return to the full route from Long Branch to Neville.
Work now underway at Humber Loop includes:
new streetcar tracks including new spur track
accessible platforms
new/wider pedestrian tunnel walkway
new sub-station building and underground conduits for electric cables
realignment of all existing overhead wiring in the loop and in the tunnel leading to Lake Shore Boulevard West
According to the TTC notice:
Track installation and some overhead adjustments for the Queen turn-back will completed by April 1, 2018, weather permitting. Remaining work, including passenger platform renewal, track renewal and overhead adjustments for the Lake Shore turn-back, as well as a wider pedestrian tunnel walkway will be completed by early June 2018.
506 Carlton & 505 Dundas
Service on both the 506 Carlton and 505 Dundas routes will be converted to bus operation. In addition to the streetcar shortage, several construction projects will affect these routes in coming months:
Track construction on Broadview from south of Dundas to Hogarth (north end of Riverdale Park) beginning in May
Track construction at Parliament/Gerrard in May
Track construction at Broadview/Dundas and Broadview/Gerrard in the summer
Track constuction at Dundas/Lansdowne in September
Water main construction on Dundas from Bathurst to Huron in September
Main Street Station construction through the summer
506 Carlton buses will run to Keele Station as their western terminus rather than to High Park Loop.
The bus replacements for streetcar service vary in the ratio of buses to streetcars depending on the time of day.
Dundas Streetcar
Dundas Bus
Carlton Streetcar
Carlton Bus
AM Peak
18
27
32
45
M-F Midday
18
27
28
36
PM Peak
19
30
29
42
M-F Early Evening
14
20
18
25
M-F Late Evening
10
12
14
18
Sat Early Morning
10
10
14
15
Sat Morning
16
20
18
22
Sat Afternoon
25
28
25
30
Sat Early Evening
11
14
16
20
Sat Late Evening
10
10
13
16
Sun Early Morning
9
9
11
12
Sun Morning
14
17
12
17
Sun Afternoon
19
20
18
22
Sun Early Evening
10
11
12
13
Sun Late Evening
9
10
11
12
Night Service
3
3
511 Bathurst
The 511 Bathurst route will revert from bus to streetcar operation using CLRVs. All service will operate between Bathurst Station and Exhibition Loop.
Service on weekdays will generally be less frequent with the streetcars than the buses reflecting their larger capacity, although peak service south of King and west to Exhibition will improve with the elimination of the short turn 511C bus service.
Weekend streetcar schedules are the same as those used in November 2015. Saturday daytime service will be at similar headways with the streetcars as with buses reflecting demand at those hours. Sunday afternoon and early evening service will be slightly less frequent with the streetcars.
509 Harbourfront, 510 Spadina and 512 St. Clair
There are no changes to the schedules for these routes.
Roncesvalles Carhouse
This carhouse will close until late 2018 for construction in the yard. Service will be operated from the east end carhouses as below:
My thoughts on the TTC’s 2018 Ridership Growth Strategy were originally published on the Torontoist website on January 23, 2018. That publication is defunct, and the text is here for reference.
Why ridership has plateaued and what can be done about it?
After many years of growing demand, the Toronto Transit Commission’s system hit a plateau of 535 million rides in 2014. Give or take a few million, the TTC has been stuck there ever since. Toronto may be the envy of other cities with a great economy and a highly-touted transit network, but that system has been losing the travel market share. Even before 2014, the growth rate was falling, but this went unnoticed.
No transit growth in a booming city whose population rises every year is a red flag–the TTC is in trouble. This is not the message managers and politicians celebrating a fresh award as “2017 Transit System of the Year” want to hear.
How did the TTC lose its momentum, and what can they do about it?
A History of Strangled Growth
Both the subway and streetcar systems have been capacity-constrained for years. On the subway, signalling technology limits the number of trains per hour that can operate. Both Yonge-University (Line 1) and Bloor-Danforth (Line 2) have run the most scheduled service that will fit for many years. The streetcar system has a declining fleet of 30-to-40 year old cars, with the recent addition, well behind schedule, of Bombardier’s new Flexitys. The SRT fleet, itself over three decades old, runs below full capacity while trains are rebuilt for service into the mid 2020s when the Scarborough Subway will open.
Only the bus fleet has been free to grow, but even that has its limits thanks to budget cuts.
Date
Era
AM Peak Buses
January 2006
2nd Miller term begins
1,328
October 2010
2nd Miller term ends
1,468
March 2011
Start of Ford cuts
1,478
January 2015
Start of Tory term
1,504
January 2018
Today
1,528
Very little bus service was added to the system during the Ford years, and not much more during Tory’s either despite claims that more buses were funded. Yes, they were purchased, but the extra vehicles went mainly to increasing the maintenance pool and to back-filling on the streetcar system.
Because the TTC had some leeway in its service capacity, the Ford and Tory constraints did not hurt ridership in the short term, although growth when it came tended to be more in the off-peak periods when vehicles had more room than during the peak. As off-peak demand grew, the TTC burned through its spare capacity, and little was added to peak periods.
Recent gains in ridership have masked an underlying problem in the bundling of statistics. Increases in student, senior and (free) children’s riding has been offset by a loss of adult and other riders (mainly day passes).
Even when the totals were rising, the TTC was losing its primary rider type, adults. There are now about 20 million fewer adult rides, about 4.5%, than in 2014. [Source: TTC Ridership Analysis 1985-2017]
Fare Type
2014
2017
Change
Adult
437.3
417.6
-19.7
Student/Senior
69.0
78.0
9.0
Children
10.8
25.0
14.2
Other
17.7
12.5
-5.2
Total
534.8
533.2
-1.6
Waiting for a Strategy
In March 2016, Councillor and TTC Board Member Shelley Carroll moved:
That TTC staff report back to the Commission by the third quarter of 2016 with a development plan for a comprehensive multi-year strategy to address current ridership stagnation and to achieve a steady rate of ridership growth annually thereafter.
Despite former CEO Andy Byford’s focus on customer service, TTC management did not rush to complete the report. Fall 2016 came and went, as did all of 2017. Eventually a preliminary report appeared in December. The delay was so long that some events overtook the “strategy” with a TTC/GO co-fare announced by Queen’s Park, and the TTC Board and Mayor Tory embracing the two-hour transfer, subject to Council approval.
During this long wait, TTC concentrated on the APTA Transit System of the Year award.
The last five years have seen significant improvements and modernization efforts in all areas of the TTC. This transformation has been acknowledged by customers, who report a significantly improved satisfaction score, and the organization’s American Public Transportation Association peers who awarded the Outstanding Public Transit System of the Year Award to the TTC in 2017. [p. 4]
This award’s primary focus was on organizational turnaround through Byford’s five-year plan, work that was needed to position the TTC to move forward. However, during this period, the budget marching orders from City Hall were to keep down expenses and limit the demand for greater subsidy. This continues into 2018 when any improvements will come by shifting resources between routes, but with no overall service growth.
2018 Ridership Growth Strategy
The Ridership Growth Strategy (RGS) flags three strategic objectives for the TTC’s future.
1. Retain current customers 2. Increase transit rides per current customer 3. Attract new customers to the system [p. 4]
None of these is surprising, but the challenge will be to decide which approaches will yield the greatest effect. Although the RGS contains many proposals, it is not clear on the benefits these will bring to each of the objectives.
Past studies have shown that retaining existing customers and encouraging more trips by them is cheaper than wooing new riders to transit. Current riders have already decided to use the TTC, while new face the biggest change in their travel style moving from a personal vehicle. If the TTC can lure them in, new riders have the potential to generate lots of new rides, but how much will it cost to get them?
The subway extension to York University and Vaughan was a big event, especially for those directly served by the new line. There is no question that the quality of transit service has improved for those who use the extension, but much of the city receives no benefit. Riders far from the subway corridor can only look on with envy at the new service. As for ridership growth, that will be limited to net new riders, and demand projections indicate that most riding on the extended subway will be by people who were already on the TTC.
Rapid transit projects have a role in transforming how transit is perceived in the newly served areas, but they cannot address demand issues across the city, especially in the short term. The TTC might have high customer satisfaction scores, but more is needed to shift auto users to transit.
The TTC’s five year plan includes rapid transit changes–Eglinton Crosstown and Finch West LRTs–but these are actually Metrolinx projects and they will not contribute new ridership in the short term. Many other projects are planned further out–Waterfront, Scarborough, SmartTrack, Richmond Hill, Relief line–but all of these lie outside of the planning horizon. Even the Bloor-Danforth renewal project gets only a passing reference in the plan even though it is critical to rejuvenate and improve Line 2 service and operations.
Census data shows that more people in Toronto are commuting via transit, but that growth is not reflected in TTC statistics. The King Street Pilot shows that there is a latent demand for better transit service even when the measured change appears to be less than what riders perceive. King cars are packed, and the TTC is caught flat-footed with limited additional capacity. For system-wide growth, there must be system-wide change, and this will not be easy in a climate where higher spending does not fit the prevailing political mindset.
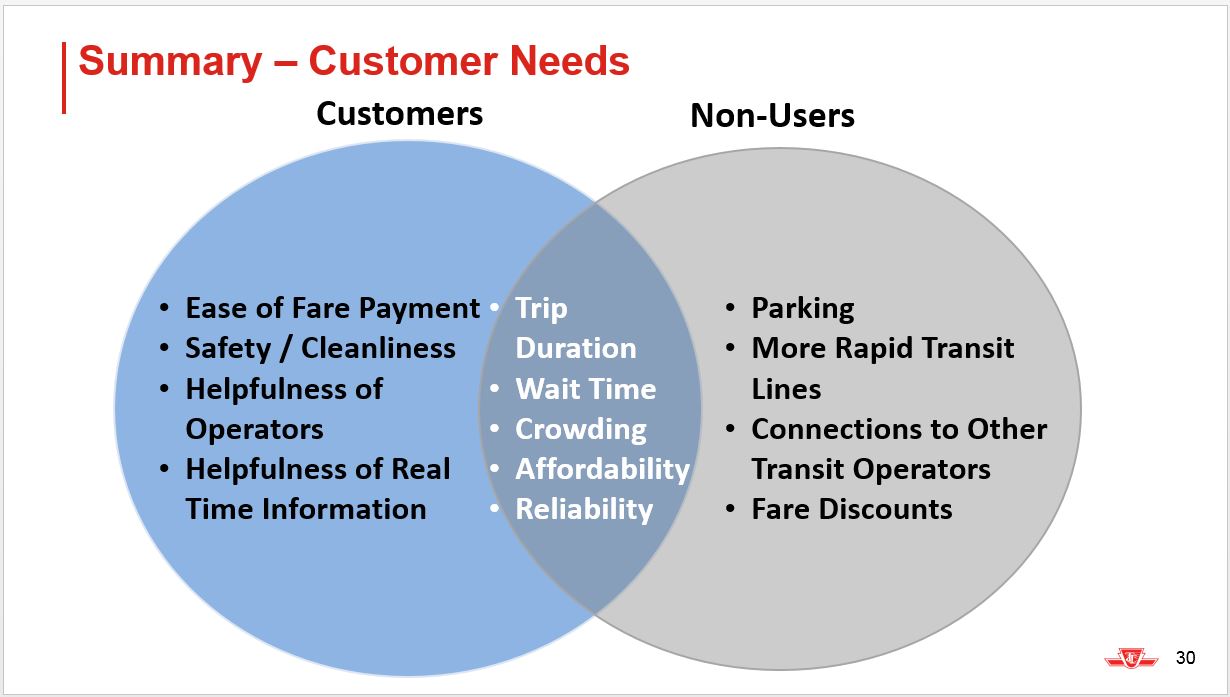
A key chart in the RGS report shows the factors affecting customer satisfaction.
Riders-specific items address system usage from the point of view of someone who is already a customer, while non-users factors affect speed and the absence of boundaries that are invisible to auto users. Any proposed improvement must be measured against the common transit basics–total trip time, comfort and cost. The relative importance and benefits must be considered too. Real time information and fare discounts are “good to haves”, but without service people can and want to use, they are window dressing.
The first big challenge will be to know and understand existing ridership. For decades, the TTC counted riders on its vehicles infrequently, and a major route like 501 Queen could go years between updates of riding data. Published route-by-route counts are now four years old. Recent technology can change this.
PRESTO’s data will provide the TTC with insights into travel behaviour that will assist in transit planning and budgeting, while the implementation of automatic passenger counters on the TTC’s surface fleet will increase the frequency of ridership counts. Thereby allowing the TTC to respond more quickly to changes in demand. [p. 6]
One might ask whether City Council is prepared to fund better service if actual demand today and potential demand tomorrow are greater than the TTC can handle by shifting a few buses between routes.
An issue for TTC and Council is that there are two ways of looking at “ridership”. This was evident during staff responses in a recent TTC Board meeting debate. For Service Planning, ridership is “bums in seats”–real riders counted either by hand (the old way) or with new technology (automatic passenger counters and Presto). For the financial folks, ridership is really a revenue question, but it is this measure that is commonly reported. Revenue figures drive budget debates about service levels, not actual counts of passengers.
The problem will grow with the move to two-hour fares where a “ride” as we know it ceases to exist, replaced by a limited time pass. Passengers might take more “trips” on the TTC, but the link between “trips” and “fares” will be tenuous. Reporting of actual demand on routes will be vital to understanding where there are shortfalls in service.
The split between claims of flat ridership while actual rider experience is of growing crowding clouds the funding debates, and out of date counts have masked growth. The TTC quite recently updated its ridership estimate for the King Street corridor from 65,000 to 71,000 daily even without the effect of the transit priority pilot. How many other routes suffer from out of date counts, and what latent demand would push these even higher if only service were improved? Riding counts see only passengers on vehicles, not would-be customers who give up waiting.
What’s In Store for 2018?
The focus for 2018 is on consultation, and this kicks major decisions on transit improvement beyond the election. However, some pending reports will inform debate.
On fares, the principal changes are already in the works–the co-fare with GO Transit and the two-hour transfer. A report is planned in the first quarter of 2018 on a “framework” for implementation of a post-secondary student “UPass”. The RGS is silent on the “Fair Fare” proposal within the city’s Poverty Reduction Strategy, but the TTC advises:
As the report indicates, the RGS is a live document subject to further stakeholder consultation. The Fair Pass is very much part of the strategy and will be added in. [Email from Stuart Green, TTC Communications, January 23, 2018]
A potential landmine in the regional fare debate is the Metrolinx Fare Integration Strategy which is expected in February 2018. With a provincial election in the offing, Queen’s Park might prefer that substantial changes be left for the future. A big step to “integration” would be a funding scheme to allow cross-border recognition of two-hour transfer privileges between the TTC and the transit systems in the 905. This would have obvious benefits for TTC ridership, and the TTC plans to work on its development and implementation this year. However, budget considerations put this option in 2019 or beyond, according to the TTC’s Stuart Green.
On service, a report in the second quarter will analyze the RGS initiatives including changes to the crowding and wait time standards, and a review of weekend service.
Aside from the operating cost, this will take the TTC into thorny debates about increasing the bus fleet and providing a new garage. With current facilities already overcrowded, this has been put off for too long, and the ability to run more service is limited by the space available to store and maintain buses.
The TTC will open the new McNicoll Bus Garage in 2020. The new total design capacity of for the eight garages will be 1881 and the new total buses available, by design, for service will be 1554.
When McNicoll Bus Garage opens, the TTC will continue to operate above capacity with reduced spares ratio beyond 2020 to accommodate service requirements. The planned overcapacity will accommodate 2007 buses at the eight bus garages with 1673 buses available for service. The TTC is assessing locations and available properties for a ninth bus garage. [Briefing Note, p. 6]
The design capacity of 1,554, even with McNicoll Garage, will be only slightly higher than the current peak requirement of 1,528. This is not mentioned in the RGS.
The TTC also plans reports on area studies considering how routes in various parts of the city can be reorganized to better serve riders, but the RGS does not list the affected areas.
The streetcar system will gain some capacity from the continued delivery of new cars by Bombardier, but this will be partly offset by retirement of old ones. The TTC’s budget, keyed to staffing and vehicle hours of service, does not provide for a net increase in the total number of vehicles on the road.
The Briefing Note [p. 4] lists the routes where improvements are planned for fall 2018. Unless you are a customer of these routes, don’t hold your breath waiting for more service.
7 Bathurst
56 Leaside
113 Danforth
11 Bayview
72 Pape
122 Graydon Hall
23 Dawes
79 Scarlett Rd.
165 Weston Rd. North
25 Don Mills
88 South Leaside
185 Don Mills Rocket
26 Dupont
91 Woodbine
195 Jane Rocket
29 Dufferin
96 Wilson
199 Finch Rocket
36 Finch West
107 St. Regis
43 Kennedy
109 Ranee
Notable by their absence is the proposed expansion of the Express Bus Network. This is directly linked to the bus shortage, and the TTC does not expect to begin implementation until 2019.
Between 2019 and 2021, we’re planning new or enhanced Express Bus service on 13 routes, and other routes have been identified as candidates for our Express Bus Network in 2022 and beyond. [Five Year Corporate Plan, p. 67]
Advance the implementation of service enhancements that are currently planned in 2020 to induce ridership growth (i.e. express bus services, new services etc.) [Briefing Note, p. 6]
Transit Priority on Streets
An important part of any plan for the surface routes is a transit priority plan.
Create a Transit Surface Priority Plan in collaboration with City staff that allows buses and streetcars to operate more quickly and consistently on key corridors [RGS, Attachment II, p. 2].
Initiate plan development
Implement transit signal priority on key corridors
Implement up to three queue-jump lanes
This will also include “engagement” with the Toronto Parking Authority “to align parking strategies to support transit.” This will inevitably run headlong into protests from businesses and councillors about the removal or restriction of on-street parking along transit routes, a delicate issue in many wards.
Queue-jump lanes, bypass arrangements for buses at key locations, have been on the TTC’s wish list for years, but they address only local pinch points and require reconstruction of roadways.
How much Toronto will progress beyond having a plan remains to be seen. The proposed plan does not include any rights-of-way, only improved priority on existing streets. Changing the way streets worked was an integral part of the 2003 RGS, and that evolved into the Transit City LRT plan.
A main feature of the strategy is the construction of surface rapid transit rights-of-way on major roads and “Avenues” as identified in the City’s Official Plan. These partially-exclusive transit rights-of-way, in the centre of major roads, will allow surface transit services to be provided on key corridors at speeds and reliability comparable to the subway, and very competitive with the automobile. The strategy highlights the need for the City to act to improve transit operational efficiency on the street system. The City has identified this need, in its work on the Official Plan, and the City must now operationalize its Official Plan by implementing effective policies and regulations to improve surface transit operations. [2003 Ridership Growth Strategy]
Accessibility
Several projects are listed in the RGS although they already exist outside of it:
The Easier Access Program continues with completion of elevators at St. Patrick Station, and start of work at Wilson, Runnymede and Chester. Elevator retrofits are a multi-year plan stretching into the mid 2020s.
A study of subway platform gap reduction and a wayfinding pilot involving electronic beacons for the blind will begin.
The Wheel-Trans “Family of Services” roll out will continue. This is a challenge for the TTC to execute because of variation in the levels of service and physical infrastructure around the system. Politically, the pressure is to cap the growth of expensive services and shift riders onto the “conventional” TTC network wherever possible.
Stop location and design will be reviewed.
As part of a comprehensive review and improvement effort for surface stops across Toronto:
With consultation and support from local councillors and communities, review and optimize stop spacing to improve safety, accessibility, and reliability at approximately 300 bus stops across the city.
Make additional stops on different routes accessible to meet AODA mandated standards.
Continue to support City staff in adding shelters and improving shelter amenities at transit stops across Toronto [Attachment I, p. 1].
Consultation, Communication, Commitment
The RGS includes an extensive consultation plan, although who will be included varies greatly from topic to topic. Councillors and communities are essential not just for advising on components that might go into the plan, but as key players who must understand what might be happening.
There will also be communication both about the studies and about changes already in the pipeline, notably Presto, but communication is no substitute for real change. Without that, there will not be much to tell would-be riders and lure them onto the transit system.
For 2018, there is not much on the table because the Mayor and Council decided in 2017 to continue on their tax-fighting ways. We do not yet know how many of the proposals for 2018, notably the fare changes and the limited amount of service expansion, Mayor Tory and his crew will support. The provincial election in June could bring further complications depending on whose view of transit funding, operations and importance rules at Queen’s Park for the next term.
Toronto is at a point where it must decide whether continued austerity in the quality of municipal services will bring the future city we see in announcements and photo ops.
The core of a Ridership Growth Strategy is not simply to have a document, but to integrate advocacy for better transit throughout the organizational and political debates. Just getting by should not be an acceptable way to run the transit system. Those who tout cutbacks by whatever name should be called out for their true role in undermining the network’s future.
Why We Need Ridership Growth
Transit is an essential part of moving many, many people around the city. Without it, they would be forced into the extra expense of driving, or face much more limited choices of where to travel. Congestion, already bad, would be intolerable.
The change would not be overnight, but a deliberate decision for “business as usual” would bring a gradual decline in transit use, and a concentration on two markets: those who live and work along major corridors and will support whatever service remains to bursting, and those who have no option but to use transit no matter how bad it is.
This would skew political support and hamper the ability to build a network of services beyond high capacity, commuter oriented lines. For someone who is not a transit user, the primary desire would be “to get those (expletives deleted) streetcars/buses out of my way”. They might support a new subway if they would use it, or if they perceive that it would reduce congestion on their commute, but there is no guarantee. Indeed, many who live in Toronto work in the 905, and new subway proposals offer little incentive for them to support transit spending.
In a regional context, if transit cannot work in a city where the population and travel demand is growing, why hope that it can make a difference outside of Toronto?
The more people who use transit not from necessity but because it truly is “the better way”, the more political support there will be to build on that success.
The King Street Pilot has been a success in reducing travel times for streetcars through the core area with knock-on benefits to the outer parts of the route in reduced short turns and more reliable service especially outside of the peak period.
Headway (the space between vehicles measured in time, not distance) is a big issue for riders, and it also affects crowding levels.
If a service is scheduled to show up every 4 minutes, and actually does so, then on average each car will have a similar load (subject to surges that will upset this), and riders can expect an average waiting time of half a headway. Even if they just miss a car, they know fairly certainly that the next one will be along soon, and it might even be in sight.
A chronic problem on all transit services is the bunching of vehicles that can yield two (or more) cars or buses close together followed by a long gap. When cars bunch, riders inevitably pack onto the first one. This is not simply a lemming-like desire to rush the first car, but the effect of years of experience telling riders than when there is a bunch, some of the cars will be short turned. If they are on the first one, they can at least drop back one car when this happens. If they are on the second or third in the parade, they may get dumped off and face the next big gap.
Some transit systems implement time points along a route where vehicles will hold for a scheduled departure time. A more sophisticated version of this is to hold in order to space out service regardless of the schedule. Riders do not care if a car (and its driver) are “on time”, only that the headway is close to the advertised value. It is the transit system’s problem to sort out operator crewing with schedules that can be achieved most of the time, but which are not excessively padded to the point service dawdles along a street. The latter has been a problem on some TTC routes where extra running time overshot the mark leading to annoyingly slow service and congestion at terminals where vehicles arrive early.
With the removal of much of the downtown congestion, and hence the variability in travel times for that part of the route, there was hope that headway reliability would improve. Results to date leave a great deal to be desired. There has been some reduction in the most annoying of wide gaps, but bunching remains a problem.
To be fair, when the scheduled headway is under 4 minutes, some bunching is inevitable. Even if cars leave the termini like clockwork, demands at stops vary as does the traffic enroute, and cars will get slightly off schedule. The follower will catch up, in part because of the lighter load from its shorter headway.
The TTC has a service quality target that all vehicles will leave their termini no more than 1 minute early or up to 5 minutes late. This is the only point on the route where schedule reliability is measured. (Until early 2015, the value was measured at several points along the route to provide a blended score, but this practice was dropped.) There are three basic problems with this scheme:
A terminus is the simplest place to monitor and dispatch service, and headway variations should always be the lowest at these points.
When the scheduled headway is small, the allowed 6-minute window for being “on time” permits vehicles to depart in bunches and still be “on time” because they remain within the allowed variation.
A perfect four minute headway would depart a terminal at 0, 4, 8, 12, 16, 20, 24 … minutes past the hour.
The same vehicles operating in pairs at 0, 7, 8, 15, 16, 23, 24 … would be “on time” because the alternate cars in the sequence are only three minutes late.
This problem is worse for wider scheduled headway because until the “five minutes late” line is crossed, the service is on time.
0, 6, 12, 18, 24, 30, 36 … and 0, 11, 12, 23, 24, 35, 36 … are both “on time” but the latter actually provides a 12 minute headway of vehicles in pairs.
The TTC has, in effect, constructed a target for “on time performance” that considers bunched service to be acceptable even at a terminal. The problem with this is that as vehicles move along the route, the headway variations get bigger and bigger. It is ironic that even with this generous standard, actual service across the system does not achieve anywhere near the target on the streetcar or bus networks. The streetcar network itself went into a long slide through 2017 thanks to declining vehicle reliability and the proliferation of construction projects.
An important issue for the King Street Transit Priority pilot is the rising demand on that corridor. Previous TTC stats showed a total of 65,000 riders using the 504 King and 514 Cherry lines combined, but this has now been updated to 71,000 even before the pilot began. Further growth comes from riders attracted to the improved service, and the line is now crowded beyond capacity at some times and locations.
The TTC has announced “improvements” from time to time on the King route, but this masks declines in service capacity.
The service design for the am peak period uses a base service about every 4 minutes overlaid by peak “trippers” that bring the headway down to about 2 minutes. However, the number of trippers has fallen over the years and in practice, the “wave” of very frequent service now lasts only about half an hour. This comes eastbound on King at Dufferin 6:50 and 7:20 am, westbound at Broadview between 7:45 and 8:15 am, and eastbound again between 8:55 and 9:25 am.
There are now seven trippers where once there were sixteen, and for some time streetcars on the trippers were replaced by buses at a lower capacity. Recently, peak vehicles were swapped between 504 King and 505 Dundas so that the trippers could revert to streetcar operation.
When buses began operating on 504 King, the TTC claimed that this was a service improvement. This was true for a time when buses allowed the service to build back to its previous high point, but over time the number of bus trippers fell.
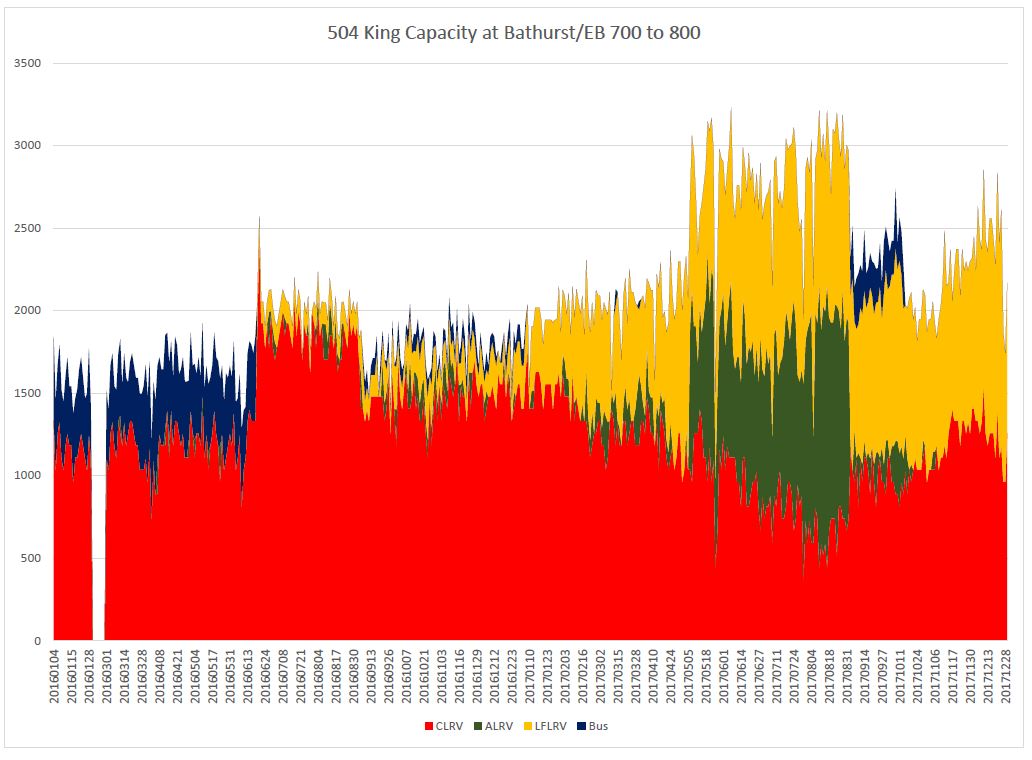
Using the TTC’s vehicle tracking data, one can plot the actual capacity operated at various points and times on King Street. These are actual, not scheduled, capacities, and they reflect the day-to-day fluctuations in service and vehicle types. For the purpose of the charts here, the Service Standards planning capacities are used. These are not the crush capacity of vehicles, but a target level in Board-approved TTC standards for an average level of crowding that should not overwhelm the service with loading delays and severely uncomfortable conditions. Whether the TTC actually achieves this is another matter, but the numbers give an indication of the relative levels of service operated over time.
The Service Standards for peak period vehicle capacity are:
Here is an example of one chart showing capacity eastbound at Bathurst & King between 7:00 and 8:00 am from January 2016 to December 2017 (note that February 2016 data are missing).
The capacity provided here was at its height in the spring and summer of 2017 when ALRVs normally used on 501 Queen were redeployed to 504 King. In fall 2017, service levels were reduced because of the change in vehicle type.
Noteworthy in this chart is the growth in capacity provided by Flexitys first on 514 Cherry (building up to full low-floor operation by mid 2017) and more recently with the addition of the new cars to 504 King. Although they do not make up half of the vehicles operating on King, they account for half of the capacity in the central section.
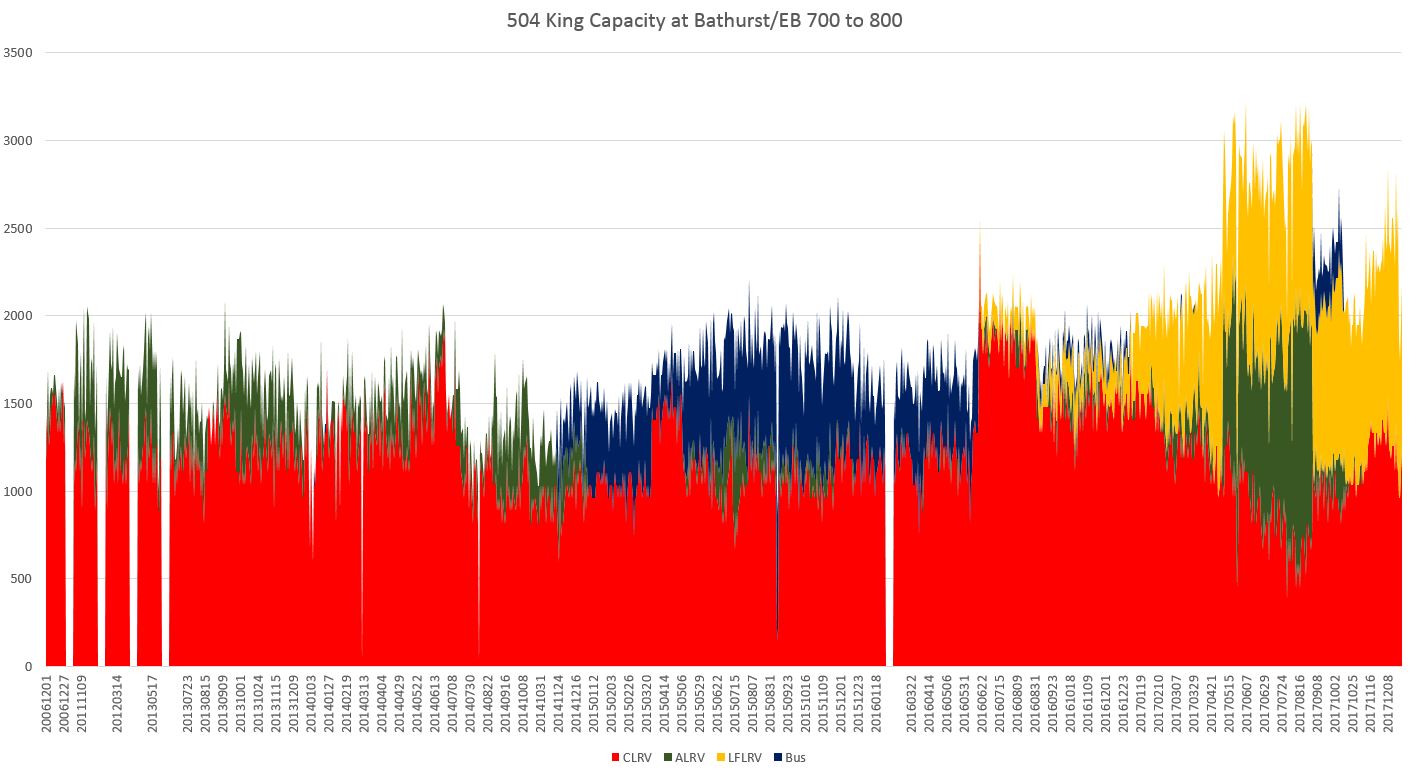
For a longer-range view of capacity, here is the same chart with data (where I have the details) going back to December 2006. This illustrates the long period during which the capacity provided on 504 King was static even as land along the route redeveloped. This is a chronic problem on the streetcar routes because an order for new cars and a larger fleet was delayed so long.
The sets of charts below illustrate capacities at five locations and times. Each set contains four charts covering the peak periods from 6-10 am and 3-7 pm depending on which period is illustrated.
Service eastbound at Jameson does not include the 514 Cherry cars which enter the route at Dufferin. Flexitys appear here only after their recent addition to 504 King. Note how the capacity provided here drops in the hour from 8-9 am compared to those on either side of it.
The PM peak service design is different from the AM in that there are few or no trippers (depending on which schedule one considers), and so this location has been less affected by cutbacks in that part of the service. However, service capacity has not changed much over the past two years especially during the peak 5-6 pm hour.
The situation at Bathurst is similar to that at Yonge, although it can be affected by cars short-turning at Spadina. After the 503 service is added in February, the capacity at Yonge will be slightly higher than at Bathurst.
The capacity of service outbound west of Dufferin is, if anything, lower now than it was in past years. This reflects the concentration of service east of Dufferin with the coming of the 514 Cherry route.
In summary, riders who believe that service, as measured by capacity, has been better in the past are in many cases correct. An important part of the King Street Pilot will be to determine how much latent demand can be attracted to the route through the combination of lower travel and wait times, and greater route capacity.
On the Torontoist, I wrote an article reviewing experience with the King Street Transit Pilot and some of the preliminary claims and reactions to it. This piece is the first of the technical follow-ups to that article with more detailed data about the behaviour of transit service on King.
Note that this analysis only covers the operation of transit vehicles, not of general traffic. For information on other data collected by the City of Toronto, please refer to the “data” page on the project’s site.
This article deals with travel times on various parts of the King route both inside and outside of the Bathurst-Jarvis pilot area. Following articles will address capacity and service reliability.
For a review of operations up to the end of November 2017, please see:
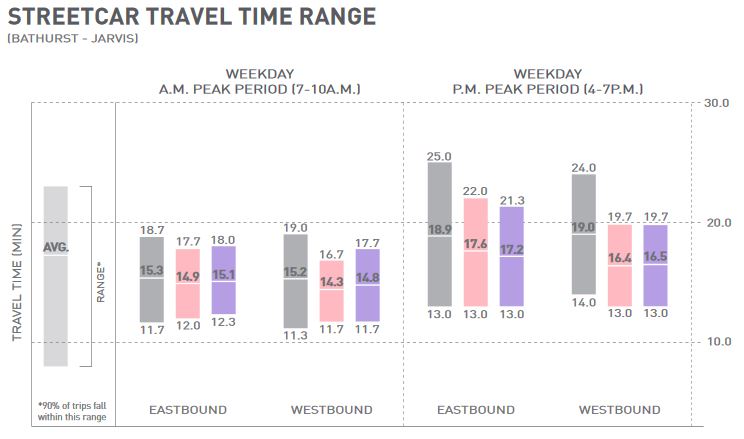
In reporting the change in travel times, the City of Toronto cites averages, maxima and minima for the “before” and “after” conditions. For example, in the chart below, eastbound trips in the PM peak before the pilot ranged in length from 13.0 to 25.0 minutes with an average of 18.9.
However, the “before” numbers omit some of the worse cases for travel times:
The period of the Toronto International Film Festival from September 7-17, 2017. During early days of TIFF, service was diverted via Spadina, Queen and Church adding greatly to travel times. Even after King Street nominally reopened, service was interrupted from time to time with unannounced diversions.
The period of track construction at Queen and McCaul Streets from October 16-27, 2017. This period saw 501 Queen streetcars shift south to King adding turning movements at Church eastbound and Spadina westbound that took place generally without any transit priority. Some traffic spillover from Queen to adjacent streets occurred, but this was not measured.
Gray: Pre-pilot Pink: November Mauve: December
Although omission of these two periods puts the best possible light on the “before” conditions and avoids criticism that the project is making a worst/best case comparison, it is a fact of life that service and travel times on King are routinely affected by various projects including construction and special events. A valid test for the pilot will be the street’s operation during a Queen Street shutdown for an event at City Hall or at Much Music. How will transit service and other traffic behave when part of the downtown network is taken “offline”? This remains to be seen.
The averages are the most commonly cited data in the press and in political comments. However, these averages hide a great deal.
Travel times vary considerably from hour to hour, and from day to day.
A three-hour average over the peak period includes many trips that occur under less-than-peak conditions, and this pulls down the averages.
Averaging data for several weeks smooths out the effect of daily variation.
Averaging over the entire pilot area merges data from areas where the pilot’s effect is small with those where it is large.
Averaging over only the peak periods misses the benefits, if any, of the pilot for off-peak operations.
In my reporting of the September 2017 Metrolinx Board Meeting, I reviewed a presentation on Regional Fare Integration. At the time of writing, only the summary presentation to the Board was available, but the full Draft Business Case appeared some time later. This is the sort of timing problem that Metrolinx has vowed to correct.
A basic problem with such a delay is that one must take at face value the claims made by staff to the Board without recourse to the original document. This will mask the shortcomings of the study itself, not to mention any selective reinterpretation of its findings to support a staff position.
In the case of the Regional Fare Integration study, this is of particular concern because Metrolinx planners clearly prefer that the entire GTHA transit structure move to Fare By Distance. However, they keep running into problems that are a mix of organizational, technical and financial issues, not to mention the basic politics involved in setting fares and subsidies. If FBD is presented as the best possible outcome, this could help overcome some objections by “proving” that this is the ideal to which all systems should move.
At the outset, I should be clear about my own position here. The word “Bogus” is in the article’s title not just because it makes a nice literary device, but because I believe that the Fare Integration Study is an example where Metrolinx attempts to justify a predetermined position with a formal study, and even then only selectively reports on information from that study to buttress their preferred policy. The study itself is “professional” in the sense that it examines a range of options by an established methodology, but this does not automatically mean that it is thorough nor that it fully presents the implications of what is proposed.
The supposed economic benefit of a new fare scheme depends largely on replacement of home-to-station auto trips with some form of local transit (conventional, ride share, etc) whose cost is not included in the analysis. This fundamentally misrepresents the “benefit” of a revised fare structure that depends on absorption of new costs by entities outside of the study’s consideration (riders, local municipalities).
The set of possible fare structures Metrolinx has studied has not changed over the past two years, and notably the potential benefits of a two-hour universal fare are not considered at all. On previous occasions Metrolinx has treated this as a “local policy” rather than a potential regional option, not to mention the larger benefits of such fares for riders whose travel involves “trip chaining” of multiple short hops.
One must read well into the report to learn that the best case ridership improvement from any of the fare schemes is 2.15% over the long term to 2031, and this assumes investment in fare subsidies. Roughly the same investment would achieve two thirds of the same ridership gain simply by providing a 416/905 co-fare without tearing apart the entire regional tariff. In either case, this is a trivial change in ridership over such a long period suggesting that other factors beyond fare structure are more important in encouragement or limitation of new ridership. Moreover, it is self-evident that such a small change in ridership cannot make a large economic contribution to the regional economy.
Specifics of the Board Presentation
The Board Presentation gives a very high level overview of the draft study.
On page 2:
The consultant’s findings in the Draft Preliminary Business Case include:
All fare structure concepts examined perform better than the current state, offering significant economic value to the region
Making use of fare by distance on additional types of transit service better achieves the transformational strategic vision than just adding modifications to the existing structure, but implementation requires more change for customers and transit agencies
More limited modifications to the status quo have good potential over the short term
“Significant” is the key word here, and this is not supported by the study itself. Ridership gains due to any of the new fare structures, with or without added subsidies, are small, a few percent over the period to 2031. The primary economic benefit is, as the draft study itself explains, the imputed value of converting park-and-ride trips to home based transit trips thanks to the lower “integrated” fare for such services, encouraged possibly by charging for what is now free parking.
A large portion of automobile travel reduction benefits come from shift from park and ride trips to using transit for the whole trip – highlighting the importance of exploring paid parking to also encourage a shift from automobile for transit access. (p. xiv)
However, local transit (be it a conventional bus, a demand-responsive ride sharing service, or even a fleet of autonomous vehicles) does not now exist at the scale and quality needed, and this represents a substantial capital and operating cost that is not included to offset the notional savings from car trips.
Fare by distance does perform “better” than the alternatives, but none of them does much to affect ridership. Moreover, the fare structure, to the limited extent that the study gives us any information on this, remains strongly biased in favour of cheaper travel for longer trips. An unasked (and hence unanswered) question is whether true fare by distance and the sheer scale of the GTHA network can exist while attracting long-haul riders and replacing their auto trips with transit.
On page 3, the presentation includes recommendations for a step-by-step strategy:
Discounts on double fares (GO-TTC)
Discounts on double fares (905-TTC)
Adjustments to GO’s fare structure
Fare Policy Harmonization
This is only a modest set of goals compared to a wholesale restructuring of the regional tariff, and it includes much of what is proposed by “Concept 1” in the study – elimination of the remaining inter-operator fare boundaries, restructuring GO fares (especially those for short trips) to better reflect the distance travelled, and harmonization of policies such as concession fare structures and transfer rules.
Further consultation is to follow, although as we now know, the first of the four steps has already been approved by TTC and Metrolinx.
On page 6:
Without more co-ordinated inclusive decision making, agencies’ fare systems are continuing to evolve independently of one another leading to greater inconsistency and divergence.
This statement is not entirely true.
The GO-TTC co-fare is an indication of movement toward fare unification, although the level of discount offered on TTC fares is considerably smaller than the discount for 905-GO trips. That distinction is one made by the provincial government as a budget issue, and it cannot be pinned on foot-dragging at the local level.
Assuming that Toronto implements a two-hour transfer policy later in 2018 (and the constraint on its start date is a function of Presto, not TTC policy), there will be a common time-based approach to fares across the GTHA. All that remains is the will to fund cross-border acceptance of fares (actually Presto tap-ons) regardless of where a trip begins.
Without question, there should be a catalog of inconsistencies across the region, and agreement on how these might be addressed, but that will involve some hard political decisions. Would Toronto eliminate free children’s fares? Would low-cost rides to seniors and/or the poor now offered in parts of the 905 be extended across the system? Will GO Transit insist on playing by separate rules from every other operator as a “premium” service? These questions are independent of whether fares are flat, by distance, or by some other scheme as they reflect discount structures, not basic fare calculations.
Pages 6 and 7 rehash what has come before on pp. 2-3, but the emphasis on fare by distance remains:
Fare by distance should be a consideration in defining the long-term fare structure for the GTHA. [p. 7]
“A consideration” is less strong language than saying that FBD should be the target framework. If this is to be, then Metrolinx owes everyone with whom they will “consult” a much more thorough explanation of just how the tariff would work and how it would affect travel costs. The draft report is quite threadbare in that respect with only one “reference” tariff used as the basis for a few fare comparisons, along with a caveat that this should not be considered as definitive. That is hardly a thorough public airing of the effects of a new fare structure.
No convincing rationale has been advanced for moving to a full fare by distance system, including for all local travel, and it persists mainly because Metrolinx planners are like a dog unwilling to give up a favourite, long-chewed bone. At least the draft study recognizes that there are significant costs, complexities and disruptions involved with FBD, begging the question of why it should be the preferred end state.
On page 8:
Amend [GO Transit fares] to address short/medium trips and create a more logical fare by distance structure based on actual distance travelled instead of current system to encourage more ridership.
This is an odd statement on two counts:
Lowering fares for short trips will encourage demand on a part of the GO system that overlaps the local TTC system, and will require capacity on GO that might not be available, especially in the short term before full RER service builds out.
True FBD will increase long trip fares on GO and discourage the very long haul riders whose auto-based trips GO extensions were intended to capture. The reference tariff implied by sample fares in the draft report is most decidedly not FBD with short haul fares at a rate about four times that of long hauls.
In other words, the goal as presented to the Board does not match the actual sample fare structure used in the draft study.
On page 14:
GO/UP uses tap on/off, other agencies are tap on only. Emerging technological solutions may allow tap on-only customer experience while maintaining compatibility with fare-by-distance or –zone structures.
The technology in question, as described in the study, would require all Presto users to carry a GPS enabled device that could detect their exit from vehicles automatically without the need to physically tap off. This requires a naïve belief that all riders will carry smart mobile devices to eliminate the congestion caused by a physical tap on/off for all trip segments, and is is a middle-class, commuter-centric view of the transit market.
On page 15:
Completely missing from the discussion is any consideration of loyalty programs such as monthly passes or other “bulk buy” ways of paying fares. Already on the TTC, over half of all rides (as opposed to riders) are paid for in bulk, primarily through Metropasses. GO Transit itself has a monthly capping system which limits the number of fares charged per month, and software to implement the equivalent of a TTC Day Pass through fare capping is already in place on Presto. (It has not been turned on because of the possible hit to TTC revenues if riders were to start receiving capped fares without having to buy a pass up front.)
Several issues are listed here that reflect the complexity of a system where the lines between local and regional service have already started to blur, and where simplistic segmentation of classes of service simply do not work. The argument implicit in this is that only a zonal or distance based fare will eliminate many of the problems, but there is no discussion of the benefits obtained simply by a cross-boundary co-fare plus time-based transfer rules to benefit multiple short-hop trips. This demonstrates the blinkered vision at Metrolinx and a predisposition to distance-based “solutions”.
For those who will not read to the end of the detailed review, my concluding thoughts:
There are major gaps in the analysis and presentation of the Draft Report. By the end of the study, it is abundantly clear that the target scheme is FBD and future work will aim in that direction. Metrolinx’ FBD goal has not changed, and this begs the question of how any sort of “consultation” can or will affect the outcome.
The remainder of this article examines the 189-page Draft Report and highlights issues in the analysis.
14 Glencairn is the latest of many routes to get additional running time compensating for the Crosstown LRT construction. Oddly, the end date shown for this change is December 2022 where all other Crosstown-related end dates are in 2021.
Supplementary service on 32 Eglinton West is being reorganized. There are currently several Service Relief buses operating from Mt. Dennis during most operating periods. These will be replaced by peak-only buses from various garages.
75 Sherbourne trips at the start and end of service are being changed to begin/end at Sherbourne Station rather than at South Drive in Rosedale.
The official route and stopping arrangements for various lines serving Finch West and Pioneer Village Stations have been clarified for periods when these stations are closed.
The TTC has already confirmed through the media that due to the late delivery of Flexitys from Bombardier, there will be bus substitutions on 505 Dundas and 506 Carlton starting with the February 18, 2018 schedules. This is also related to service reorganization to boost capacity on King Street. I will report the details when they are available.
(Bus trippers originally planned for 504 King are now actually operating on 505 Dundas replacing CLRVs that have been redirected to King Street for extra capacity.)
It should be noted that due to track construction on Broadview planned in 2018, there will be effects on the Carlton, Dundas and King routes that will probably last two schedule periods.