
This post arises from a Twitter thread in the early evening on Saturday, October 17. Photos of crowded TTC buses are not rare these days, and one appeared from the 35 Jane bus. Intrigued, I took a look at NextBus to see whether bunched service might be the culprit.
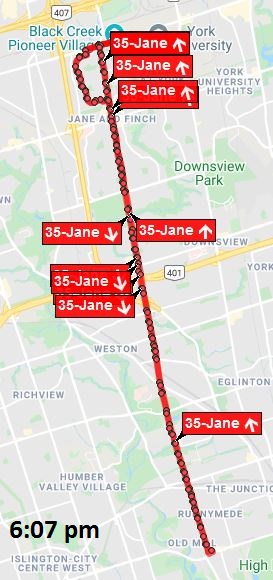
The first snapshot at 5:09 pm was what I found. All of the buses on the route were clustered in three groups with wide gaps between them. Oh well, I thought, maybe the route supervisor will sort this out at the terminals by spacing the service, or possibly by short turning a few buses. This was not to be.
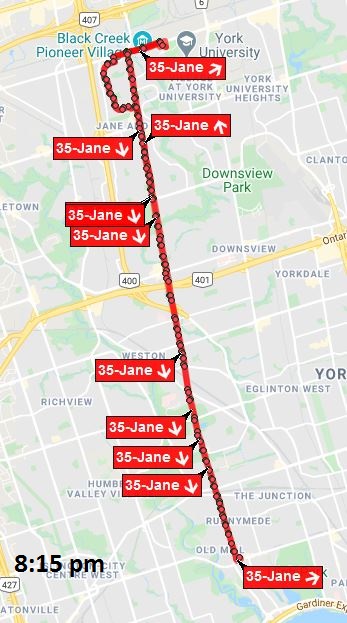
Half an hour later, at 5:41, the only change was that the three groups of vehicles had rotated positions on the route, and this continued for the next hour. It was not until 8:15 pm that I came back to see what was happening, and found that almost all of the service was running southbound with an enormous gap northbound.


Regular readers here will remember that I wrote about route 70 O’Connor which had a chronic problem with buses bunching late on Saturday afternoons.
- Analysis of Route 70 O’Connor for October 2019
- Analysis of Route 70 O’Connor for November 2019
- An Example of Service on Route 70 O’Connor December 20, 2019
At the TTC Board meeting of December 12, a motion by Commissioner Brad Bradford asked staff to report back in the first quarter of 2020 on my findings. The pandemic emergency intervened, and there has never been a report.
The situation on 35 Jane on October 17 prompted me to look at vehicle tracking data for past months. Because this is a route with a proposed reserved lane similar to the BRT red lanes recently installed in the Eglinton-Kingston-Morningside corridor, I have been collecting data for it for several months.
Scheduled Service
As part of an overall review of headway reliability, I reviewed 35 Jane in a previous article published in August 2020. This concentrated on weekday service which was not good, but I did not review weekend service because there were fewer schedule changes on weekends when the TTC cut service in the spring.
The TTC will tell anyone who asks that they have been running about 85 per cent of pre-pandemic service. However, that is a system wide average. The numbers for 35 Jane are nowhere near that level during many periods, notably on Saturdays when the 935 Jane Express was removed.
To compensate for removal of the express service, the weekday schedules were changed to include “trippers” that operated for extended AM and PM “peak” periods with a roughly three-hour gap between.
| Weekday Service | Mar/20 Headway | Mar/20 Buses/hr | June/20 Headway | June/20 Buses/hr | Ratio |
|---|---|---|---|---|---|
| AM Peak | Before noon | ||||
| 35 Jane | 4’40” | 12.9 | 3’30” | 17.1 | |
| 935 Jane Express | 7’30” | 8.0 | |||
| Combined | 20.9 | 17.1 | 82% | ||
| Midday (*) | Noon to 3pm | ||||
| 35 Jane | 7’00” | 8.6 | 7’00 | 8.6 | |
| 935 Jane Express | 9’30” | 6.3 | |||
| Combined | 14.9 | 8.6 | 58% | ||
| PM Peak | 3pm to 8pm | ||||
| 35 Jane | 5’00” | 12 | 4’22” | 13.7 | |
| 935 Jane Express | 9’40” | 6.2 | |||
| Combined | 18.2 | 13.7 | 75% | ||
| Early Eve | |||||
| 35 Jane | 8’45” | 6.9 | 5’00” | 12 | |
| 935 Jane Express | 9’00” | 6.7 | |||
| Combined | 13.6 | 12 | 91% | ||
| Late Eve | |||||
| 35 Jane | 9’00” | 6.7 | 9’00” | 6.7 | 100% |
The tripper adjustment was not made to the weekend schedules, and they simply lost their express trips resulting in large service cuts when they would have operated. If demand in the pandemic era is even half of its former level, the crowding will be unchanged because there are only half as many buses.
| Saturday Service | Mar/20 Headway | Mar/20 Buses/hr | June/20 Headway | June/20 Buses/hr | Ratio |
|---|---|---|---|---|---|
| Early AM | |||||
| 35 Jane | 8’30” | 7.1 | 9’00” | 6.7 | |
| 935 Jane Express | 10’30” | 5.7 | |||
| Combined | 12.8 | 6.7 | 52% | ||
| Late AM | |||||
| 35 Jane | 10’00” | 6.0 | 10’00” | 6.0 | |
| 935 Jane Express | 11’00” | 5.5 | |||
| Combined | 11.5 | 6.0 | 52% | ||
| Afternoon | |||||
| 35 Jane | 7’30” | 8.0 | 8’00” | 7.5 | |
| 935 Jane Express | 10’00” | 6.0 | |||
| Combined | 14.0 | 7.5 | 54% | ||
| Early Eve | |||||
| 35 Jane | 7’00” | 8.6 | 7’30” | 8.0 | 93% |
| Late Eve | |||||
| 35 Jane | 8’30” | 7.1 | 8’30” | 7.1 | 100% |
| Sunday Service | Mar/20 Headway | Mar/20 Buses/hr | June/20 Headway | June/20 Buses/hr | Ratio |
|---|---|---|---|---|---|
| Early AM | |||||
| 35 Jane | 30’00” | 2.0 | 30’00” | 2.0 | 100% |
| Late AM | |||||
| 35 Jane | 10’00” | 6.0 | 10’00” | 6.0 | |
| 935 Jane Express | 10’00” | 6.0 | |||
| Combined | 12.0 | 6.0 | 50% | ||
| Afternoon | |||||
| 35 Jane | 10’00” | 6.0 | 10’00” | 6.0 | |
| 935 Jane Express | 10’00” | 6.0 | |||
| Combined | 12.0 | 6.0 | 50% | ||
| Early Eve | |||||
| 35 Jane | 7’00” | 8.6 | 8’00” | 7.5 | 87% |
| Late Eve | |||||
| 35 Jane | 9’30” | 6.3 | 10’00” | 6.0 | 95% |
Headway Reliability
The first month I reviewed was September 2020, the most recent period for which I have tracking data. What I saw was not merely bad, but appalling.
Each dot in the chart below is one bus. The colour designates the date, the horizontal position indicates the time, and the vertical position indicates the headway (time between buses) for each vehicle.
Although the trend lines through the data lie at roughly the scheduled headways, the individual values vary wildly with many cases over 20 minutes.

The same data presented as monthly averages with standard deviations are shown below. This chart tells two stories. First, the average values look just fine and if that were the only measure one checked, all would appear to be well. However, the standard deviation values climb through the morning showing that the service is becoming bunched, and the SD runs close to the average until mid-evening. This is a very bad sign, a warning that much of the service is scattered over a wide range of headways.

Looking at the same data as bar-and-whisker charts shows how the headway values stay tightly clustered in the morning, but the range widens substantially through the day. In the chart below, the central green and blue blocks contain half of the service (the 2nd and 3rd quartiles) while the red and purple lines (the “whiskers”) contain the other half. Those very short red whiskers are not a good sign because they show that one quarter of the service is running on very short headways.

Saturday, September 12
Digging under the covers brings us to a detail chart of the service operated on September 12 (the yellow dots in the headway diagram above). In these charts, each line represents one bus. Time runs from left to right, and the route from south to north vertically. Where lines are evenly spaced, so is the service. Where they run close together, buses are running in packs of two or more.
Even at 10 AM, some bunching is evident, but this gets worse as the day goes on.

Just after 3 pm, the service was interrupted by a collision. Here are the service alerts:
- 35 Jane: Detour northbound via Falstaff Ave, Keele St and Wilson Ave due to a collision. Last updated Sep 12, 2020 15:27:36
- 35 Jane: Regular service has resumed northbound at Falstaff Ave. Last updated Sep 12, 2020 16:43:00
However, the service was already bunched before this incident, and it did not affect the parade of six southbound buses that arrived at Jane Station at abut 3:30 pm.

The parade returned north, and on its return two of the six buses short turned at Lawrence. However, bunching continued to be a problem.

In spite of some short turns, bunches and gaps continued into the evening with one particularly wide gap of 40+ minutes just after 7PM northbound from Jane Station.

Well, one might say, of course the service is a mess. There was an accident. Unfortunately (a) the accident only affected the line in one direction for about an hour and (b) the erratic service was well-established before it occured.
Saturday, September 19
Moving one week later, the service was not quite as bad, but still had a lot of bunching as well as that same big gap around 7PM northbound from Jane Station.
The day begins well enough, but shortly after noon, some bunching appears.

This continues through the early afternoon with more and more buses operating in pairs and a few triplets. There is a small amount of congestion northbound approaching Wilson, but nothing on the scale of the previous week’s diversion.

By late afternoon there is a large group of buses starting at about 4:40PM northbound fromJane Station follwed by gaps after 5:10PM.
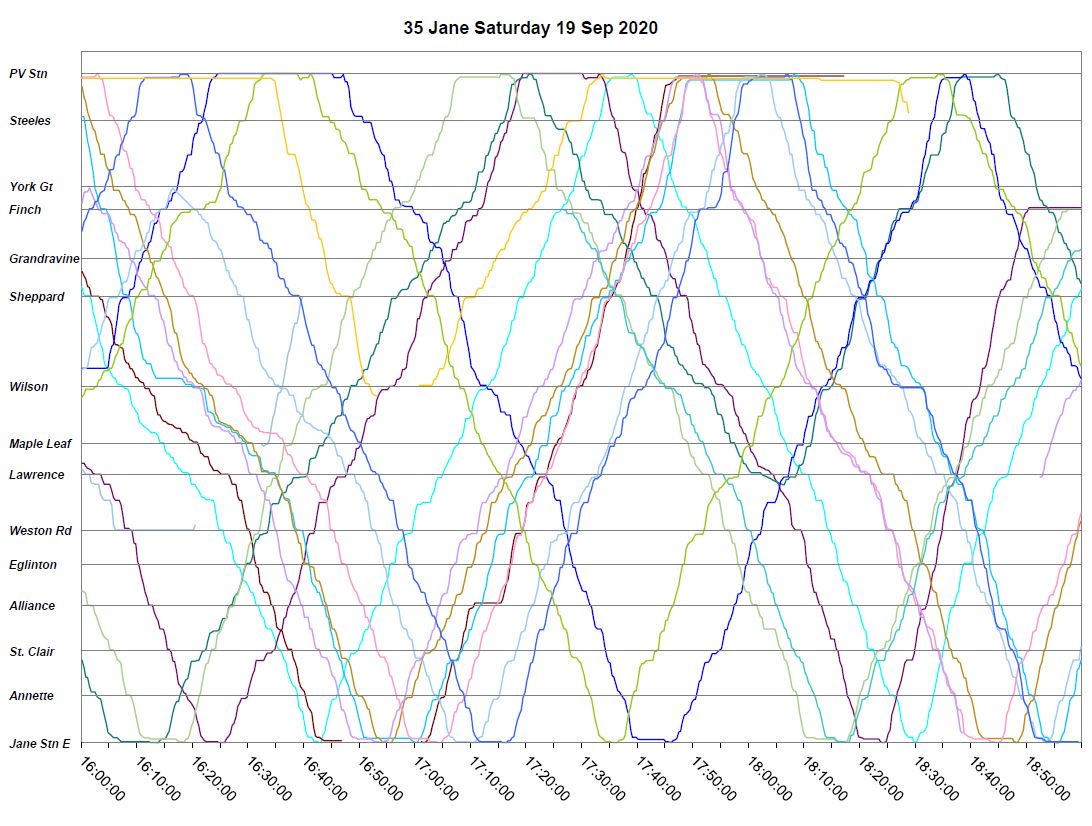
Just after 7PM there is a 40 minute gap in service northbound from Jane Station. Note that several buses short turn at Lawrence southbound. Service returns to a more normal state later in the evening, albeit still with some bunching.

Saturday, September 26
The next Saturday proved somewhat better than what went before, but the late afternoon bunching is evident.

Once again there are wide gaps in service at Jane Station.

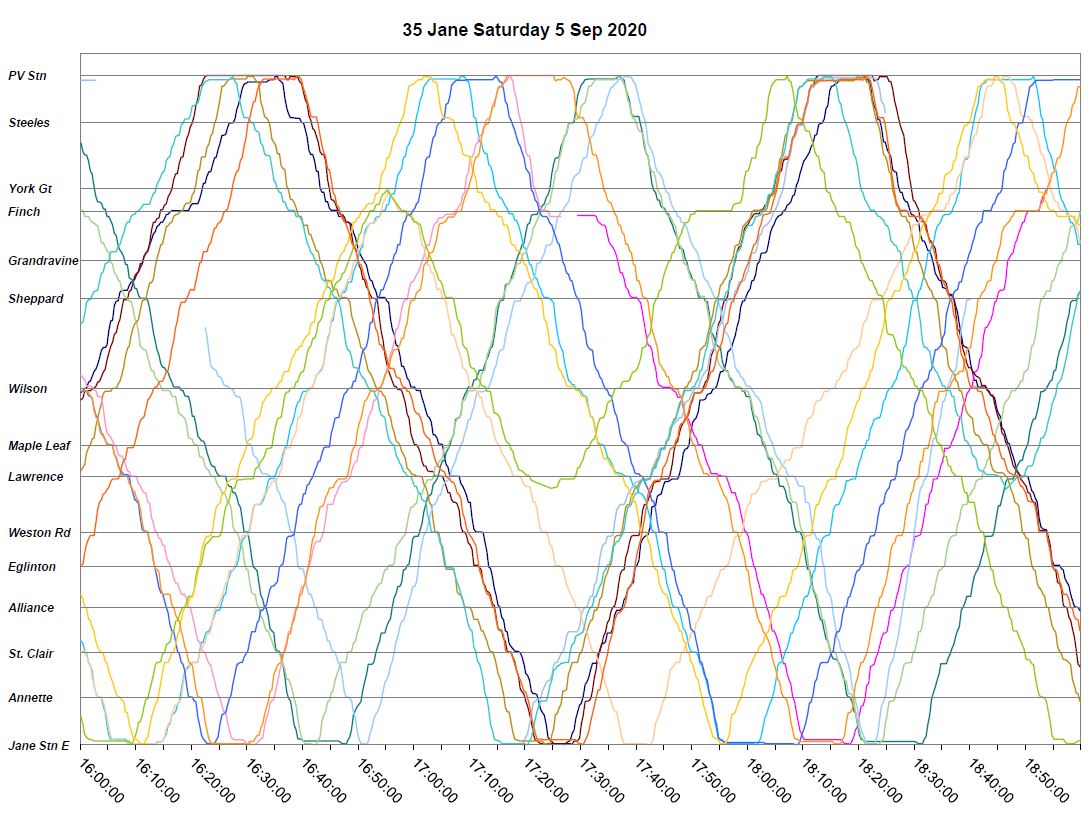
Saturday, September 5
I went back to the Labour Day weekend, but there was no respite. The familiar bunch forms up mid-afternoon and persists into the evening. These are not one-time events that can be explained away by collisions, congestion, weather or plagues of locusts. They are inherent in the line’s operation.

Summer 2020
OK, OK, maybe September was a bad month. No. August was just as bad.

July was better, but there is still a fair amount of bunching as shown by the short headways (dots near the x-asis).

June managed to achieve a very large gap of 48 minutes on the 20th. It is our old friend the late afternoon parade compounded by a collision that held two buses southbound near Lawrence at about 5PM.


At this point I will stop, but will note that this problem has been around for a long time, definitely pre-pandemic, with Saturday service on the Jane bus.
Full chart sets:
- June 2020 Saturdays
- July 2020 Saturdays
- August 2020 Saturdays
- September 2020 Saturdays
- September 5, 2020 Service Chart
- September 12, 2020 Service Chart
- September 19, 2020 Service Chart
- September 26, 2020 Service Chart
No Short Turns?
The TTC, and more particularly its Board, has a fetish about short turns. Councillors don’t like them because their constituents complain. This has been an issue for as long as I have been involved in Toronto’s transit politics.
The problem is that short turns are only part of the overall quality of transit service. If buses and streetcars show up several at a time after a long gap, the effect is similar to a short turn, but it affects the entire line, not just the area beyond the common turnback point. (Woodbine Loop on the Queen is a perennial favourite.)
Only one metric is reported to the Board: how many short turns there were per month. For August 2020, management proudly reports that there were none at all on the bus system. This is very, very hard to believe considering what is obvious in the service charts such as those above. Far more likely, the short turns simply are not reported either to shield management from embarrassment or because they are initiated by drivers without supervisors ordering them.

Headway reliability and bunching are serious problems on many routes, and riders know this quite well. That bunching contributes to crowding which the TTC sloughs off with advice to just wait for the next bus. Sometimes that bus is not just down the street.
The chronic bunching on a route like 35 Jane, just as was the case last year with 70 O’Connor, shows that nobody is minding the store. Problems like this, whether they stem from schedule inadequacies or chronic congestion at certain times and locations, should be well known by route supervisors and should feed into operational changes, not persist for months.
The TTC claims that they supplement service with unscheduled extras that are not tracked. Well, that’s just peachy, but they also provide no report of where and when these buses are used.
In any event, when a route has most of its service running in a few clumps or all headed in the same direction, this is not a question of needing extra service, it is a matter of having buses where they are supposed to be.
The pandemic gave management a holiday from explaining away problems with day-to-day service because the emergency took every bit of attention. Now, however, a major concern is that transit not be overcrowded, and delivering that service is an important part of rebuilding trust in the TTC as a relatively safe way to travel.
TTC managers need to wake up and provide better service, the TTC Board has to get off its collective butt and demand that good service in these difficult times is a top priority. Self-serving metrics claiming that all is well, on average, do not serve the transit system nor its riders. It is time the TTC reported service quality as riders actually see it and acknowledge the importance of reliable service in limiting crowding during this difficult era.

The idea that short-turns are always wrong is crazy and to have only 2 on streetcars and zero on the buses is simply crazy. Short turns, if used and authorised properly, show that someone in Transit Control is actually monitoring routes and adjusting things as “stuff happens”, as it invariably does. To see virtually no short-turns for a whole month (October) clearly demonstrates that there is no route or headway management. It is certainly NOT a positive indication.
In fact, the TTC’s target for short-turns on streetcars was 296 so, despite the green tick-mark it does NOT meet their standard. For buses the target was 1350. If targets do not mean that that this is a figure to be aimed for, are they simply a figure that one expects to exceed and thus make your department or “management” look good! The “targets” for short-turns need to be realistic and should certainly not be Zero. A ‘fail” would be given if they were above OR below the target by x%. (Interestingly, in 2016 the targets were expressed as 50% less than 2015 but it would probably be better to say that x% of all ‘runs’ ought to short-turn.)
LikeLiked by 1 person
I’m so thankful to you Steve that you continue to monitor service throughout the TTC system and especially bus route #35. This has been long under-served and, I would venture, under-supervised.
While the TTC has not managed to fix the bunching and frequency issues on this route in the 25 years I’ve taken the #35, it is difficult to understand how this has been allowed to continue. Could it be that many of the customers (I’d say the majority) are BIPOC and without the time, energy, and/or language skills to rattle the cages at TTC Customer Service or their councillor at City Hall?
I wonder what the racial breakdown is on the TTC service in affluent neighbourhoods compared with the transit service in less economically-advantaged areas of the city.
Have you ever come across this data in any of your research into TTC service?
A 61 year-old long-time regular TTC customer.
Steve: The closest to what you see would be in the ward profiles the City publishes, although they were more detailed when we had more wards. I would disagree to some extent about supervision and service quality versus demographics. The problem of poorly regulated and inadequate service is pervasive as I showed in recent articles.
I think that what we do see now much more clearly is that the recovery of ridership has been faster in areas where people are more transit dependent, and I think some of the TTC attitudes about the service betrays an outlook from people who don’t use that part of the system. That said, there is a long-standing problem that TTC tends to present operational data on an average basis and this masks a lot of problems. I am not sure that some of those who tout those numbers understand their limitations.
A good example is the “we’re running 85% of pre-pandemic service” line when, as I showed in the table of before-and-after service levels on Jane, this is not true at the individual route and time period level. Also, in a previous article I noted that the “92% of buses are not crowded” number misrepresents what is happening. That 92% refers to trips that are under half full, NOT nearly empty. Obviously a bus that is half full minus one passenger will start to feel crowded in current circumstances, and loading variations caused by uneven service will easily push such trips over the 50% mark.
There is one good example of special service for the well-off in the 14x series of Downtown Express buses which have a very high cost per passenger, even allowing for the double fare they charge. All of them served well off neighbourhoods and carried people to downtown jobs: Beach, Don Mills, Mt. Pleasant, Avenue Road, Humber Bay. Not only did these cost a lot to run, they consumed peak period buses and operators. The 2021 Service Plan proposes that they be cancelled, and this is likely to be approved.
One could also argue that the subway with its core orientation is classist, and this is behind a lot of the “xxx deserves a subway” arguments. Without getting into that whole debate, I would argue that the question should be “where do people in xxx want to go and how can we serve them well”. Too much of the suburb-to-suburb travel is difficult on transit, and given the demographics that works against people of lower income whatever their ethnicity.
There is a real danger that transit will be presented as a service of necessity for the less well-off, the workers who cannot sit at home with their laptops, thereby further driving the perception that transit is for people who don’t count as much as those in power. This sort of comment has been made by several including Mayor Tory to justify high spending to retain service for the past months, but it is a dangerous outlook if transit is seen as for “them”, not for “us”.
LikeLike
For me, worth repeating:
The City government is headed by the Mayor and City Council. The current Mayor and Council don’t understand Public Transit and fail to enforce management oversight. The TTC is only mandated to provide operational service. Steve’s information derived from TTC data suggests even the TTC metrics must show poor service.
The Mayor and City Council are failing in their oversight for strategic transit planning which is with the Planning Division. The pathetic transit plans in the Official Plan are also the fault of the Mayor, City Council and the City Manager. Operations and strategic planning should be run under one department head who is accountable for all of Public Transit.
LikeLike
Hi Steve,
Looks like this week was not different than last regarding the bunching on the 35 (see this tweet.
Just curious: Does the TTC ever get back to you on why issues like these occur and what they will do to fix them, or do they just get some TTC spokesperson to downplay the situation and present some overly inflated fact, such as service levels are 99.9999999% on time or we have 0 short turns, etc?
Steve: Generally speaking, no. The stock answer these days is that the gaps I chart in service were filled on the fly by “run as directed” buses which, for technical reasons, do not show up in the Vision tracking data. The crowds in photos people post show quite clearly that there are gaps in service, and these are easy to see on NextBus. The benefit of RADs has become this year’s catch-all excuse replacing “traffic congestion” which doesn’t wear very well these days.
The problem with tracking RADs is known to and a concern within the TTC too because without their data, it screws up their stats on service actually operated. Both the TTC staff and I are working on trying to sort this out. Of course if Vision had been designed to allow for this type of service in the first place, we might not have this sort of problem.
Finally, last fall, there was a report request from the TTC Board to reply to my analysis of 70 O’Connor. That is stuck in limbo because the pandemic came along. The initial response then was, wait for it, RAD buses were filling the gaps. This did not explain how all four buses on the route could be reliably found at Coxwell Station every Saturday afternoon at the same time.
I am currently working on an article about visualizing the quality (or not) of service in a way that (a) matches standards the TTC has approved and (b) does so in a way that makes the shortcomings immediately obvious. Stay tuned!
LikeLike
Hi Steve,
Looks like this Saturday was no different than last Saturday. The gaps in service on the 35 were so big today that the TTC’s offical twitter notices account published a tweet at 4:42PM stating “Delays of up to 15 minutes between Jane Station and Pioneer Village Station due to traffic congestion” when in fact it appeared to be regular traffic on Jane as is the case every Saturday afternoon that I take this route.
From my observations this past Monday, it appears that several Queensway RAD buses are sent on the 35A to help out in the afternoons, but they usually just catch up to the bus in front and run in packs with the regular 35 buses and result in even bigger packs (upwards of 4-5 buses are common now, up from the usual 2-3 I’ve seen on Jane in the past).
Steve: Yes, I saw that notice. In about a week I will have the tracking data for October and Jane is obviously a route I am following. We will see what the congestion problem looks like week by week there. The November service change memo is not out yet, and so I don’t know if there are plans for new schedules, notably for the restoration of the 935 express service, on Jane for November, or if that will come in a later change.
LikeLike