The Board spent considerable time on the proposed shutdown of the SRT. Please see my original article Bye, Bye Scarborough RT on this issue which has been updated to reflect their debate and decision.
On February 10, 2021, the federal government announced a $14.9 billion plan for transit infrastructure over the period 2021-2028. Spending would start at a relatively low level with $5.9 billion spread over the first five years, but would then ramp up to $3 billion annually in what is supposed to be a permanent program.
The ink was hardly dry on the announcement when there were great huzzahs! from various circles that finally these was going to be federal money in transit. Suspicious soul that I am, I went looking to the backgrounder with more details, but came up dry.
For as long as anyone can remember, there has been a huge problem with the difference between announcements, “commitments” and actual spending. Following the money can be like a game of Three-card Monte where you’re never sure if there was a Queen on the table to begin with. The gullible marks believe that they can follow the Queen and are astounded when she is not there.
Before Toronto starts to spend billions, it is important to understand two things:
This is a national program. Assuming that the pot is divided based on population, Ontario will get about 40% of this or $6.36 billion over eight years. Toronto proper (as opposed to the GTA or the Census Metropolitan Area) is about 20% of Ontario. This leaves the City with about $1.27 billion. This would build a few subway stations at current prices.
The feds usually defer to the provinces in allocating funding, and so Ontario would control which projects were favoured. Queen’s Park could choose to spend all of Toronto’s share on “Ontario” projects built within the City, notably the Ontario Line and the Scarborough Subway Extension.
Rummaging around in Infrastructure Canada’s website, I came upon an interesting pie chart for an earlier program, the Investing in Canada Infrastructure Program, or ICIP for short. Although about $6.8 billion is earmarked for Ontario, $6.12 billion is unallocated. The basic problem is that the feds cannot approve spending if the province does not make an application.
A not-uncommon problem with funds like this is that they don’t really exist until something is approved, and if they are not spoken for by a drop-dead date (usually the end of a fiscal year), the funding evaporates. Note that according to this chart the cutoff date for intake of projects was in October 2019, and only 16 applications with a value of $651 million are awaiting review.
This led me to download the project list to see where the approved money went. Here is a subset of all projects with an approved value of $1 million or more in descending order. The list includes all projects under the five headings above although the lion’s share of the funding is in the transit group. It also includes two projects funded through the Infrastructure Bank (which is a separate source) for completeness.
The largest allocation is to the GO Transit ON-Corr (formerly RER) program, followed by the Ottawa LRT Stage 2. These are the only two items above $1 billion.
Toronto rapid transit projects are not well represented on this list. The only substantial amount ($333 million) is allocated to the Finch West LRT. Smaller amounts for design work are allocated to the Relief Line, SmartTrack, Eglinton West and Eglinton East. There is a lot of money for GO expansion.
I wrote to Infrastructure Canada asking for clarification of the relationship between various programs and to determine whether any of them overlapped such as funding this week’s announcement with unspent money from an earlier program.
I asked:
Is any of the $14.9 billion already earmarked for previously announced projects such as the Scarborough Subway?
What is the status of the unallocated $6.12 b in the ICIP? Is it still available, over and above the $14.9 b, to fund projects?
Does this announcement have any effect on the federal gas tax which flows to provinces now in support of transit projects?
In reply to the first question, Infrastructure Canada replied (in an email of February 12, 2021) that the $15.9 billion is all new money.
1. The announcement for a permanent public transit funding made on February 10, 2021 provides $14.9 billion for public transit projects over eight years, which includes permanent funding of $3 billion per year for Canadian communities beginning in 2026-27. This funding is separate from funding currently available under integrated bilateral agreements in place with provinces and territories, and will complement the efforts of the Canada Infrastructure Bank.
In the first five years, $5.9 billion will be made available starting in 2021 to support the near-term recovery of Canadian communities by:
Building major public transit projects and provides dedicated planning funding to accelerate future major projects.
Supporting the deployment of zero-emission vehicles and related infrastructure, complementing the work of the Canada Infrastructure Bank.
Meeting the growing demand for active transportation projects, including by building walkways and paths for cycling, walking, scooters, e-bikes, and wheelchairs.
Helping Canadians living in rural and remote areas travel to and from work more easily and access essential services, by working with rural, remote, and Indigenous communities to identify and create transit solutions that meet their needs.
This is new funding for public transit. Further details on the near-term funding announced on February 10, will be shared in the coming months.
The funding announced also delivers on the government’s commitment to provide $3 billion annually in permanent support for public transit. This funding will become available in 2026.
Over the coming months, the government will seek to facilitate partnerships between all orders of government, Indigenous communities, transit agencies, and other stakeholders to develop an approach to permanent public transit funding that offers the greatest benefits to Canadians.
With respect to the unallocated ICIP funds:
2. Under the existing Investing in Canada Infrastructure Program, which is delivered through bilateral agreements, provinces and territories are responsible for submitting their infrastructure funding priorities to the federal government for funding consideration and approvals.
The unallocated funding under the Investing in Canada Infrastructure Program continues to remain available to Ontario communities for their funding priorities.
Infrastructure Canada continues to work with the Government of Ontario on their priority transit projects.
As for the gas tax allocated to provinces:
3. The recent announcement for permanent public transit funding has no bearing on the federal Gas Tax Fund or communities’ allocations under the Fund.
As part of COVID-19 response efforts, the Government of Canada delivered its full annual federal Gas Tax Fund allocation early this year to provide $2.2 billion quickly to local communities so they have the resources available to start projects now that will create jobs and help revive local economies.
It is good to know that funding from other sources is not affected, but equally important to note that Ontario is still sitting on (in the sense that the money is not yet applied for) $6.12 billion in ICIP, an amount close to all they will received under this week’s announcement over the next eight years.
Infrastructure Canada concluded by saying:
Infrastructure plays a vital role in promoting economic growth, creating jobs and improving our quality of life. This is why we continue to work closely with the Province and ask that Ontario prioritize its projects and submit complete funding applications in a timely manner, so that we can get investment funds moving and get Ontarians working this construction season.
Hint. Hint. Ontario. Apply for this money so that we can actually get people to work.
There is a basic problem with stimulus programs because the desire is to spend as soon as possible to get the effect of new money flowing to jobs. The big projects like new subway lines are still in the design stage, and much construction will not begin for several years. Indeed, Toronto once faced a problem where it could not spend all of its allocated stimulus funding, and the TTC soaked up this money by making a huge purchase of buses. This sort of ad hoc spending does not establish priorities based on need, but simply on the speed at which cash can be shovelled out the door.
There may be $6.12 billion looking for a home, but spending it soon will be a challenge.
The bottom line in all of this is that the federal announcement’s heart is in the right place, but the money that will come to Toronto and the GTHA is small compared to our needs. Every bit helps, but the danger now is that with an announced program, the federal taps will be turned off.
Lurking in the background is Metrolinx, an organization not exactly noted for sensitivity to local concerns. After beginning some years ago with work on a “transformational” change that would have robbed riders within Toronto to fund lower 905/416 cross-border fares, Metrolinx backed off. However, they are now back at “transformational” planning which could impose a fare-by-distance scheme on the entire GTA.
In particular, we do not know whether this will be a truly collaborative design and reflect the input of local transit agencies, or will be imposed by fiat from Queen’s Park making any work the TTC and others do now irrelevant.
This article will not propose a new scheme. That would imply I somehow have access to stone tablets with the One True Word on the subject, and that I am already wedded to one scheme in spite of the plethora of ways one might calculate and charge fares. There are many variables and issues such as the level of subsidy available, the scope of a unified system, and the goals transit is supposed to achieve.
We cannot simply propose a new scheme without debating these underlying issues, and anyone who avoids the policy debate is leaving out the most important, foundational part of a study.
This article is intended to tell some of Toronto’s history, and to look at the many options for constructing a new tariff.
Fares are a sensitive topic, and the details bring out more of the “dark side” about how each type of riders would be affected, and what the implementation and operating costs and procedures would entail. A common problem is that proponents of new schemes inevitably present their “solution” in sunnier terms than detailed review might justify.
The fundamental question of any fare system must answer is this: what are we trying to achieve? Transit has many goals, but actually paying for itself is not the only one. There are economic issues (social equity, mobility), development issues (transit enabling and/or requiring density of jobs and housing), and environmental issues (trip diversion from autos, reduction of road-building). Some of these have a quantifiable value, others have soft benefits and costs such as avoided personal expenditures and the value of commuting time.
There is no one “right” way to charge fares without also being very clear about which of these goals are important, and how the tariff will address them. Benefits and penalties are inherent in any fare scheme, and these should be recognized, not papered over to “sell” any model.
Some goals will produce conflicting results. For example, if we wanted to shift people out of cars, there would be good, inexpensive transit reaching into the commuter shed well beyond downtown. This could involve free parking, reduced fares on (or subsidies to) local transit for “last mile” links, and a lower fare-per-km than a strict fare-by-distance model might otherwise bring. All of this would confer benefits on (usually) affluent commuters in the name of an environmental good, while placing a relatively higher cost on transit for shorter trips. Such conflicts are inevitable and they require openly and honestly balancing the goals of the fare system.
A vital question separate from how one builds the tariff is what proportion of system revenue should come from fares, and what from the public purse? This is directly related to service quality because the amount of revenue, wherever it might come from, affects the level of service that can be provided. If transit agencies are fighting for every dollar, then any move that might affect their revenue stream will be resisted. Conversely, riders will not take kindly to fare increases if they do not also see better service.
The complexity of the tariff in any city has a lot to do with the maturity of the technology used and the political decisions about how much riders will pay. Every city’s fare structure has a long history affected by geography, political organization, technology and business climate. “Our way” of doing things makes sense, or at least is an accepted practice, in each location, the result of decades of evolving trade-offs.
The Evolution of Toronto’s Fare Structure
In Toronto the two primary fare structures are flat fares and zones as a rough version of fare-by-distance.
Flat fares are charged for local travel in the City itself (aka the “416”), and in the regions around Toronto (primarily the “905”). There are free transfer arrangements within each region, but not across the 416/905 boundary. That is the motivation for a lot of talk about “unfair” transit fares. (There are no remaining zone fares in the 905’s transit network.)
Local fares include various schemes to make transit more attractive:
cheaper fares for riders who make many journeys (e.g. passes or their equivalent),
cheaper fares for specific classes of rider (seniors, students, children, low-income),
simplification of transfer rules to eliminate penalties associated with trip chaining (multiple short journeys).
Toronto’s fare structure evolved together with its history. The original single fare within what was then Toronto was a condition of the franchise granted to the Toronto Railway Company in 1891. As the city expanded and with the creation of the Toronto Transportation Commission in 1921, the single fare zone covered what we now think of as the “old City”. Service beyond was operated on a few radial lines with their own fares (such as the line to Lake Simcoe, later cut back to Richmond Hill), and by some suburban bus companies. Remember that most of what we now think of as the “inner suburbs” was then farmland and a collection of small towns.
With the creation of Metropolitan Toronto in 1954 (itself still a cluster of former towns and cities), the renamed Toronto Transit Commission’s service territory expanded to roughly its present boundary. Zone fares applied outside of the old City and fragments of the inner suburbs that were blended into the “Central Zone” to simplify the layout. Suburban zones 1-5 covered the territory beyond the old City, although there was not much of a network there in 1954.
By the early 1970s, the suburban zones had been collapsed so that Zone 1 was the old City (formerly the Central Zone) and Zone 2 was everything else within Metropolitan Toronto. Zones 3 and beyond were for a few outside-Metro services such as buses to Richmond Hill, Woodbridge and Port Credit, remnants of the former radial railways. Special tickets provided a cheaper cross-boundary fare than two individual adult tickets (33 cents vs 40 cents in the example below), but there was still a premium for that crossing.
With the TTC needing greater subsidies to operate into a much-expanded suburban area, politicians and riders were annoyed that they contributed to the TTC through their taxes, but paid a higher fare when crossing the boundary with the old City. The situation was further complicated by the subway’s growth beyond Zone 1 with its 1968 extensions pushing that zone further out, provided one did not transfer to a bus route. The physical layout of several stations once in Zone 2 reflects provision for fare lines that no longer exist.
Zone 2 vanished on January 1, 1973 and ever since, travel across the entire City of Toronto has been based on a single, flat fare with free transfers. Monthly passes were introduced in 1980. The two-hour transfer, in effect a limited-time pass, replaced the complex rules for transfer validity in 2018. This brought Toronto into line with transfer rules in many 905-region agencies.
The intent was to encourage multi-hop trip chaining, but an unlooked-for side effect was a fare increase on those riders whose trips actually take more than two hours. I will return to this later in the article.
GO Transit, operated since 1967 by the province of Ontario, always used a zone-based fare structure that is nominally distance based, but which has many idiosyncrasies that built up over years as their network evolved. Co-fares are provided between GO and local systems in the 905, but their purpose is to lure riders onto transit rather than driving to GO’s extremely large inventory of parking. There is a point where building more parking simply is not a viable way to build demand. Moreover, parking addresses only one type of rider – the classic suburb-to-downtown commuter with their own vehicle.
Over the years, GO’s fare structure, although nominally distance-based, has been gerrymandered for various, changing goals including:
cheaper trips for long-haul riders,
cheaper trips for short-haul riders,
cheaper trips for “frequent flyers”,
free parking,
reduction of the cost to riders of transfers between GO and local transit, and
reduction of the cost to the public purse of supporting co-fares for transfers.
It is self-evident that these changes cannot address the same goals.
There are built-in assumptions to any fare structure, and similar issues, albeit with different solutions, can be found in many cities:
Is the transit system and any zones or distance-based fare organized around trips to and from a core area?
What is the granularity of zones or of distance increments, and are they a holdover from the complexity of fare calculations in the era before GPS and smart cards?
How long is one “trip” in time or space? When should a new fare be charged?
Are transfers free, or provided as a surcharge, or simply not available between some or all routes and modes in a network?
What is the relative cost of single fares and various discount levels?
Who is entitled to how great a discount?
Is the regional (usually rail) network truly integrated in the local fare structure, or is it separate?
Do fare calculations require some form of “tap off” to establish trip length?
There will be few service changes in February 2021 in anticipation of the reassignment of bus services with the opening of McNicoll Garage at the end of March.
Weekday service will be trimmed in response to passenger demand on the following routes:
2 Bloor-Danforth
509 Harbourfront
510 Spadina
512 St. Clair
The 9 Bellamy and 913 Progress Express routes will be changed to operate via Progress Avenue. Bellamy buses will no longer serve stops on McCowan Road, Corporate Drive and Consilium Place (these are served by other routes).
The service changes are summarized in the table linked below.
Overhead and station construction work on the east end of 506 Carlton.
Overhead reconstruction on various parts of 501 Queen.
The King-Queen-Queensway-Roncesvalles project.
Reconstruction of Dundas West Station Loop including expansion of streetcar platforms.
Between the construction projects and the reduced streetcar service, the peak scheduled streetcars now number only 126 (AM) and 127 (PM). Out of a fleet of 204 cars, this leaves a lot of room for “maintenance spares”. We must hope that when the TTC puts the entire network back together again late in 2021 that they will have enough working cars to operate it.
In spite of the considerable surplus of streetcars, there are still bus trippers scheduled on 505 Dundas and 506 Carlton.
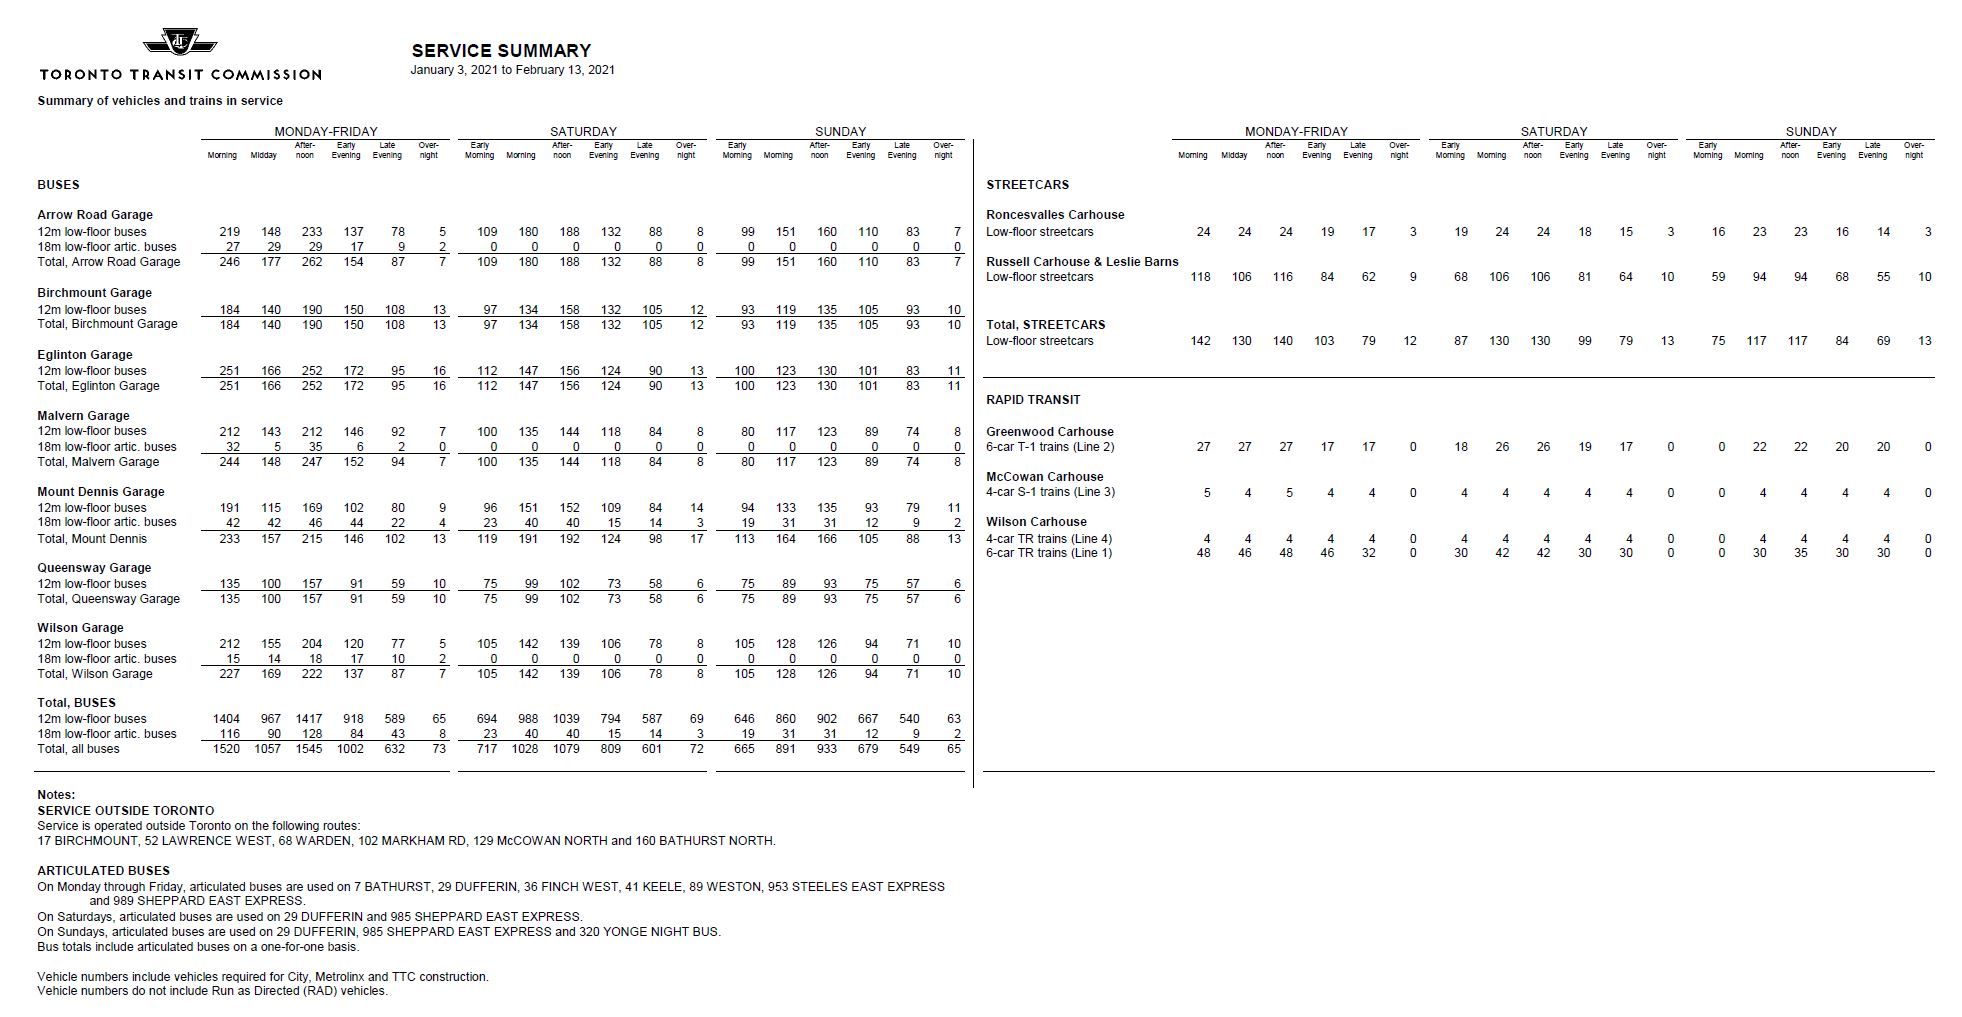
The bus fleet will operate at less than capacity with a scheduled peak service of 1,520 vehicles compared to the garage capacity of 1,675 and a fleet size of over 2,000. Run-as-directed (RAD) buses are not included in this total, although there are fewer of them now that “regular” service levels have been restored on many routes.
The project list also includes some items for 2022 from the City of Toronto’s map of planned construction work, TOInview. This includes:
Completion of the KQQR project from Queen to Dundas (stop modifications).
Reconstruction of Broadview Station Loop. The status of a proposed expansion of streetcar platforms is not yet known.
Track construction on College from Yonge to Bathurst, and at the intersection of Church & Carlton. Whether the TTC will add curves in the southeast quadrant here to simplify diversions is not yet known. In a previous project at Broadview & Gerrard, the “institutional memory” forgot that there were plans to add a north-to-west curve, and a once in 25 year opportunity was missed.
Replacement of the intersection of King & Shaw.
Reconstruction of Adelaide Street from Charlotte to Yonge. It is not yet clear whether this will only involve the removal of long-inactive track or the restoration of Adelaide as an eastbound bypass for King and Queen service between Spadina and Church.
Updated January 29, 2021: The reference to Metrolinx fare integration studies has been updated to include a link to their late 2017 Draft Business Case and to my commentary on it.
The TTC has a study underway to look at future fare options that will lead, in about a year’s time, to a Five Year Fare Policy and Ten Year Outlook.
The study includes a questionnaire seeking feedback about what people would like to see in a new fare system. Curious fellow that I am, I took the study to see what questions might be posed, and whether there was any inherent bias in the options offered.
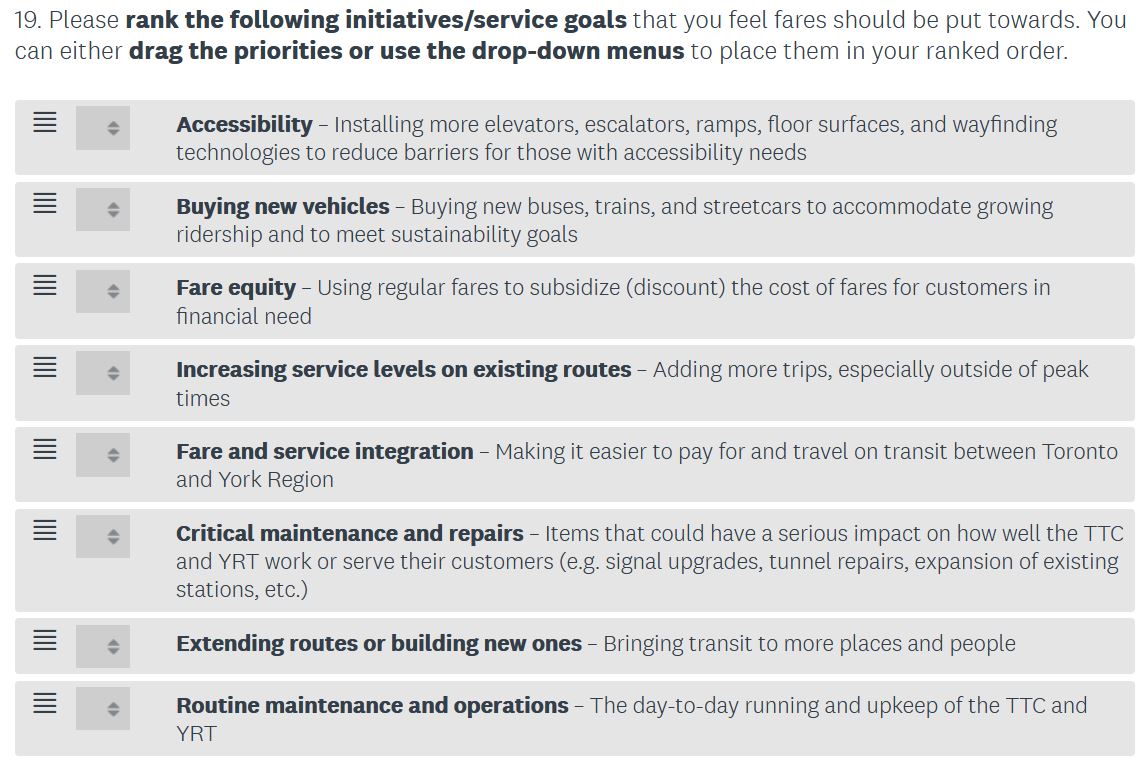
Imagine my surprise when I saw the list of things I might prioritize as a new way to spend fare revenue.
What is mind-boggling is the presence of four topics that are clearly part of the capital, not the operating budget, and which are never funded from the farebox:
Accessibility: New elevators, etc.
New vehicles
Critical repairs: All items shown in the list above are capital repairs.
Extending routes or building new ones: With the exception of bus routes where there is little infrastructure, these are substantial, multi-year commitments of capital often with subsidies from other governments.
Of particular note here is that the dollar value of each type of work is not shown, and so a respondent has no way to know what the effect on fares would be if these items were charged to fare revenue.
For example, in the 2020 Budget year, before the pandemic slashed ridership and revenues, the anticipated farebox take was $1.25 billion. This is less than the total capital spending, some of which is not yet funded, in each year for the coming decade. A big rise in fares would be required to make a substantial contribution to capital.
To put this in context, a five per cent fare increase (taking the adult Presto fare from $3.20 to $3.36 with proportionate increases in other fares) would generate about $62.5 million per year (with no allowance for lost ridership due to the higher cost).
The City’s property tax bill for 2021 includes a 1.5 per cent increase for John Tory’s City Building Fund, and this tax will increase at an additional 1.5 per cent each year to 2025. The new revenue it will generate in 2021 is estimated at about $50 million. This fund is intended to underwrite over $7 billion worth of the City’s share of various transit and housing projects. Most if not all of the projected funding is already allocated.
Is the TTC considering fare increases that would help fund the Capital Budget, and if so, how much do they hope to raise? What type of projects might be funded out of this new revenue stream?
Even more critically, what operational improvements such as better service would not be funded because fare revenue was paying for things like new signal systems and vehicles?
Two other topics also beg the question of just what riders are expected to pay for out of the farebox:
Fare Equity
Fare and Service Integration (Regional)
These are noble goals, but they should be funded from general revenues as City and Provincial priorities, not by taxing riders with a fare increase.
Many riders complain today that service in parts of the network is crowded and unreliable, but the TTC claims to be operating service at close to historic levels. Moreover, the classic TTC claim is that service levels are bounded by the size of the fleet. Both of these are not entirely true.
Because the traditional peak periods have yet to return on most routes, service operates at lower than historic levels.
The total scheduled peak vehicles (see table below) is well below the size of the fleet.
In the case of the streetcars, this is partly due to construction projects and to major vehicle overhauls that take advantage of reduced vehicle needs during 2021.
In the case of the buses, the requirements include the replacement of streetcars on some routes, but these vehicles will become available as construction projects wind down later in 2021. Even allowing for this, the fleet is substantially bigger than would be needed for industry-standard maintenance allowances.
Source: TTC Scheduled Service Summary, January 3, 2021
The bus fleet now numbers over 2,000 vehicles, and there are 204 streetcars. Buses required to substitute for streetcars are:
501 Queen: 46
504 King: 19
505 Dundas: 8 (*)
506 Carlton: 22 (*)
Total: 95
(*) Of the 30 buses on Dundas and Carlton, 12 of them also serve as trippers on bus routes.
The primary constraint on running more service is the provision of staff and the associated budget (or subsidy) to run more of the buses more of the time. There is some headroom for more “peak” period service, and outside of those few hours a day, there is much capacity for better service if only Toronto had the will to fund it. If new money is found anywhere for transit, that is where it should go. “Service” is what riders pay for.
Notable by its absence from the survey is any mention of a new fare system based on the distance travelled. Various proposals have floated from quarters such as Metrolinx and the Toronto Region Board of Trade.
Although Metrolinx has not shown its hand publicly, they are still set on imposing a distance-based model on the GTHA to entrench their view of how fares should be calculated. This fits nicely with the prevailing political wisdom of “user pay”, but it utterly ignores other policy goals for transit and the long-standing fare structures in local transit systems.
In the Metrolinx view, rapid transit lines are considered as “premium” services and should attract a higher fare just as GO trains do today. Short trips would pay a flat rate, but at roughly 10km, fares would increase proportionate to distance travelled. The two-hour transfer would almost certainly disappear. Such a scheme would make long trips within Toronto more expensive, and reinstate the penalty on a series of short-hop trips or “trip chaining”. The goal? Subsidize cross-border trips to and from the 905 regions.
Metrolinx presented three schemes back in early 2016, and prepared to launch public consultation, but that was short-lived. I wrote about this situation at the time:
A big problem in Metrolinx fare proposals was their hope for a “zero sum” solution where new revenues (from riders lured to transit by cheaper fares, and higher fares charged to some existing riders) would offset losses (from cheaper rides for some existing riders, and lost ridership from fare increases on some trips).
[Added January 29, 2021] By late 2017, Metrolinx published a Draft Business Case for fare integration exploring various alternative fare structures, and I reviewed this in The Bogus Case for Fare Integration. In this report, Metrolinx at least acknowledges that there are two options: one is the zero sum arrangement of 2016, and the other requires “investment” (read “subsidy”) to offset new, lower fares for those who are penalized by the existing arrangement.
In due course, work on this appeared to stop, but it has not been forgotten.
The Board of Trade’s scheme uses a zonal system that is designed to allow trips inside Toronto, as well as short trips across the 416/905 boundary, to be taken for one fare, while longer trips (e.g. inner 905 to central Toronto) would pay more, although less than today’s completely separate fare on each side of the boundary. In this scheme too the two-hour transfer would probably disappear.
The fundamental problem here is that none of this is discussed in the TTC’s fare study. One of the most important questions riders might be asked is not even in the survey, nor is there any discussion of what various potential new fare schemes would do to riders’ day-to-day costs.
The TTC risks conducting a grand study without discussing a critical effect of “regional integration”. The problem is compounded by muddying the question of fares with potential support for capital projects and policy options that should not be funded from day-to-day operating revenue.
Does the TTC Board, and behind them the City of Toronto, have a hidden agenda to stiff riders for the cost of system and fare policy improvements? Or is this simply a case where nobody is paying attention?
The TTC reports on its overall performance through the monthly CEO’s Report. This document is rarely discussed in detail at Board meetings, and often is the underpinning for “good news” about how well the TTC is doing, not about how it could be even better.
Regular readers here know that I often despair over the quality of the metrics used in this report. A few months ago, during a Board meeting, CEO Rick Leary mentioned that the metrics in his report were to be updated. This article is the first in a series discussing of what might be done to improve things. Future articles will review practices in other major North American transit systems, as well as the state of TTC service seen through a more rigourous reporting standard.
The pandemic era fundamentally changed the environment where the TTC operates. Ridership is down, but demand for reliable service is as strong as ever because social distancing is a new requirement. In past years, riders might complain about crowding, but this could be fobbed of with the usual excuses that things were not too bad on average – in any event, we could not improve service because either we had too few vehicles or too little budget room to operate more.
Plans were always tailored to available subsidy funding and the on-and-off-again political desire to “improve” transit by freezing fares. In spite of repeated requests from some TTC Board members, staff would never produce an aspirtional budget showing how much it would cost to plan for overall service improvement beyond a minimal level. That was the approach in the Ridership Growth Strategy, now almost two decades old, and hard fought-for in its time.
Today, a crowded bus represents more than an inconvenience – riders see crowding as a safety issue in this pandemic era.
Looking ahead in 2021 and beyond, there is a potential for resurging transit demand at a time when government support for emergency funding could wane. This could force cutbacks just at a time when transit needs to at least hold its own, if not improve.
The TTC reports superficial measures of its service that do not tell us much about rider experiences even though that is the “shop window” of the transit business. Far too few data are reported at a granular level where the variation in experiences is evident. Little data is available online for review, and much of that is not up to date.
The Tyranny of Averages
Riders do not consume “average” service. Getting to work on time, on average, is not an option. Riders have to assume that the service will be bad and build padding to compensate into their plans.
Riders usually board the first vehicle that shows up after an indeterminate wait compounded by potential crowding. Even if they allow for irregular service, they have no control over whatever shows up day-by-day. Both the physical environment and the need to be somewhere on time can add anxiety to their journey.
Many routes and trips are not crowded, considered on an all route, all day basis, but some are. A major problem here is how we count things.
If we count crowded buses, we might find that, over the day, ten percent of vehicles are crowded. However, there are more passengers on those buses and so the experience of crowding affects proportionately more riders. The same applies to long waits before a trio of buses appears at a stop. The “average” service might match the scheduled buses/hour, but the true experience is of a long wait followed by a crowded journey.
This is the basic reason why management can claim that “on average” service is pretty good, even in these difficult times, while riders complain bitterly that it is not. Service metrics are needed to reveal the variations, how often and how badly the TTC misses its targets, as well as the number of affected riders.
Big Data vs Big Reports
Over the decades, the CEO’s Report (formerly the Chief General Manager’s Report reflecting the position’s earlier title) varied in volume and complexity. This depended on the interests of the then-sitting Board and the style of the then-current management. For a time, it included detailed project status reports on everything from major subway construction all the way down to routine system repairs, but with no interpretive summary to flag problem areas.
Only the most dedicated would read every page, and the report accomplished its objective of appearing to inform while overwhelming with raw detail. Much more information was available about capital project status than day-to-day operations.
At the other extreme, performance data are consolidated to a level where Board members can digest them, but with a loss of detail.
In our time of Big Data, there is a danger of information overload. Readers who follow my route performance analyses know of the volume of charts and data published here, and those are only the tip of a very large iceberg. Nobody would read a monthly description of every route.
The point should not be to read all of the detail, but to have a summary that flags problem areas with the detailed information as a backup. If the same problems show up every day, they are systemic issues, not ones caused by occasional disruptions. The Board should know about them and about what management is doing to correct and improve affected areas. This is Management 101.
From an accountability viewpoint, riders and politicians are interested in their route, in their wards, but those responsibile for the entire system should be able to verify that overall behaviour is not consolidated beyond recognition into a meaningless average. This requires two important changes in how performance data are presented:
The granularity of analyses in time and space (e.g. by route and location) must be sufficient that it can be related to the experience of a rider making a specific trip at a specific time.
Exception reporting of problem areas should flag these for action and be tracked in overviews like the CEO Report, but the detail should be available online on a timely basis.
Those points as written are aimed at service reliability, but can easily apply with modifications to areas such as equipment and infrastructure.
Why Do We Measure?
The reasons for measuring things are summed up in this quotation from an extensve report on the subject that is now close to two decades old:
Agencies collect … measures to help identify how well service is being provided to their customers, the areas where improvement may be needed, and the effects of actions previously taken to improve performance. In these cases, agencies use performance measures to help provide service as efficiently as possible, monitor whether agency and community goals are being met, and—over time—improve service so that it attracts new riders. Changes in policy, procedures, and planning can result from an understanding and appraisal of certain measures.
… [D]ecision-making bodies, such as transit boards and funding bodies, need to have access to accurate information to help them make decisions on where and when service should be provided and to support actions designed to improve performance. The public is also interested in knowing how well service is being provided and may need convincing that transit provides a valuable service, for them, for someone they know, or for the community as a whole.
Performance measurement data provide transit agency management with objective assessments of current circumstances, past trends, existing concerns, and unmet needs.
Eagle-eyed readers will notice that I have not mentioned financial issues like fares, subsidies, cost control and “efficiency”. Too many transit discussions start with the question “how can we reduce costs” before asking “what quality do we want and are we providing it”. However, if the publicly reported data are spotty and do not address specifics rather than general averages, any political discussion of funding will be hobbled.
What might be “efficient” transit service depends on our goals, and use of that term typically implies that there is some way to do more with less, and that we should aim lower. “Good service” may not be viewed as a public good in some political circles except when the time comes to woo voters.
Finally, we must beware of metrics that allow management to “game the system” by hitting easy targets, or by measuring and reporting in a way that puts them in the best possible light.
Objectivity is another aspect of reliability. Those involved in developing measures, obtaining data, and analyzing performance should not permit their self-interests to affect the accuracy of the results. Performance measures should not be selected on the basis of which measures will make the agency look good and avoided where those performance measures make an agency look bad. Rather, selection of performance measures should be based on how accurately and fairly those measures assess agency performance and whether they can be used as a tool to measure goal achievement.
A revised version of the service change memo has been issued by the TTC. This article is updated to reflect new information.
Introduction
This article has been delayed from its usual publication a few weeks before changes go into effect. Schedule changes were still in flux, and information on what would actually operate was inconsistent.
There are many sources for service information:
An internal memo from Service Planning detailing the pending changes for a coming “board period” (usually a six-week interval). This exists in draft form a few months ahead of the implmentation date, but a final version is issued two-to-three weeks ahead of time. By this point, everything is more or less frozen in place because operators have picked their crews based on the new schedules. This is the memo on which I base my regular articles detailing pending changes.
At roughly the same time as the final version of the planning memo comes out, the TTC publishes electronic versions of schedules through the City of Toronto’s Open Data Portal. These are in an industry-standard format called GTFS (General Transit Feed Specification) used by agencies to publish their schedules for use by trip planning applications.
A separate version of the schedule data is created for NextBus which has its own format different from GTFS. On occasion the conversion process goes awry and NextBus does not have correct info.
The TTC’s own publicly posted schedules on its website appear to be generated from the GTFS data, although this conversion process can also run into problems.
Finally, there are the Scheduled Service Summaries. These come from Service Planning and they give an overview of service on all routes. Under normal circumstances, a new summary is published on the TTC’s Planning page just after new schedules go into effect. With so much service operating ad hoc through crew cancellations and RADs through 2020, these summaries did not fully reflect what was going on. In practice they could not because their structure is intended for simpler times. Some periods had no published summary.
Throughout the pandemic period, and especially at its outset, the TTC service planners had to make many last-minute changes including the conversion of express operations to “tripper” local runs, selective cancellation of crews, and creation of a pool of “run as directed” [RAD] buses and streetcars. The RADs were used both to fill schedule gaps and to supplement service where needed.
A useful factor in this was the automated passenger counting (APC) data that could be mined to locate routes with capacity issues. Many would argue that the TTC did not do enough to deal with crowding problems on some routes, but a related issue often discussed on this site was service regularity. On paper, a route might have enough service to handle demand at acceptable crowding levels, but in practice if service is badly bunched some vehicles will be badly crowded while others run with light loads.
In 2021, Service Planning hopes to get back to schedules that are properly constructed for reliable service rather than ad hoc responses to the pandemic.
The January 2021 schedule change encountered problems because of last minute-changes that caused the various sources of information to go out-of-sync.
As of January 3, the GTFS schedules reflect plans in mid-December (their posting date is December 21), and plans for some routes have changed.
The information on TTC schedule pages appears to reflect more recent changes to plans implying the existence of a refreshed set of GTFS data. This has not yet been published.
For reasons that are not yet clear, the NextBus versions of the January schedules were both incomplete and included outdated routing information. This caused NextBus to display little or no data for many routes until mid-afternoon on Sunday, January 3. Some late-breaking changes/corrections to TTC plans do not yet appear in the NextBus versions of the schedules [as of January 3].
The generic Service Change page does not list all of the changes because (a) it appears to be based on the original version of the service memo, and (b) because some changes, notably major restructuring of streetcar routes, have been missed. This is complicated by the TTC’s placing notice of one change, the restructuring of Queen services, in the Route Diversions page, not together with the list of service changes. There is no notice of changes on 504 King or 506 Carlton which now operate as split routes.
This situation reflects problems of last-minute decision-making, of multiple sources for data, and of fragmentation of responsibility for managing updates into (at least) three groups: Service Planning, IT and Communications. When a lot is changing on the fly, some things slip through the cracks. This is not to criticize staff, but rather to point out a structure where co-ordination problems can occur.
I will update this article as additional information becomes available.
Updated January 7, 2021: Comparative service level charts have been added for routes 53/953 and 60/960 showing changes between the November 2020 and January 2021 schedules.
Updated January 5, 2021: Information about express routes 953 Steeles East, 960 Steeles West and 984 Sheppard has been updated in the route summary. Comparative service charts will be added for weekday service on 953 and 960 in a separate update.
Updated December 26-28, 2020: This article has been extensively updated with charts to illustrate the change in service levels on corridors that have or had 9xx Express services. I will turn to other routes in a separate article.
Some of you have probably been wondering where my list of bus service changes for January 2021 has wandered off to.
The problem is that some of the information in the TTC’s service change memo is inconsistent, and a new version to be issued after Christmas. Some information about planned schedule changes is available through the City of Toronto’s Open Data Portal which has the electronic versions of all schedules for use by various trip planning apps.
Because the difference between some new and old schedules is not as straightforward as usual, I have added charts comparing service levels by time of day rather than the breakdown into peak, midday and off peak periods.
Information here should be considered “preliminary” in case the TTC makes further revisions before the new schedules take effect.
Scheduled Erratic Service
The schedules for many routes suffer from build-in irregular headways. If the route runs on time, the buses are not evenly spaced, and “on time” performance is the metric the TTC uses, for better or worse, to evaluate service. This irregularity arises from several factors that can also interact on the same schedule:
The route has branching services that are not on a compatible headway. For example, it is easy to blend two services running every 20′ to give a 10′ combined service on the common mileage. However, if it is a 25′ and a 10′ headway, this is impossible.
For pandemic-era schedules, some trips were cancelled without adjusting surrounding buses to even out the headways. This might have occurred unofficially, but it would take a lot of work to ensure that spacing stayed ideal even if the buses were not strictly “on time”.
For pandemic-era replacement of express services, “trippers” operated usually on schedules that did not blend with the basic service. These buses were typically in service from 5 am to noon, and from 3 to 10 pm.
Some “Run as Directed” (RAD) buses (aka Route 600 series) operated where needed to supplement scheduled service. These do not appear on any schedule nor in a route’s vehicle tracking logs.
My purpose in looking in detail at the January 2021 changes is to show how all of these factors interact.
Updated November 10, 2021 at 9:00 am: Links to TTC reports have been updated to point to the TTC’s new website.
Updated December 22, 2020 at 1:20 pm: Some illustrations from the Board meeting presentation have been added to this article, or have replaced previous versions with lower resolution from the budget report. Text has been added in some sections notably in comments about the timing of future projects and spending.
This is a companion article to my piece on the Operating Budget for 2021. This year operations will have a big challenge because subsidies are needed to backfill lost fare revenue, and yet politically, spending money on what we already have does not have the allure of announcing yet another subway plan. “Look! Another bus on Dufferin” does not stir the blood in quite the same way although one might argue that the long-suffering riders there are equally “deserving” of attention.
The Capital Budget has its own problems. For many years the true need for transit capital in Toronto was hidden so that the depth of the funding hole would not be obvious. Magically, there always seem to be enough capital to cover current costs, and somehow future years took care of themselves as they became the new present.
That scheme came unglued as TTC capital needs rose and available money went to the flashy new projects: a subway here, an LRT there, and of course an expressway rebuild lest those non-transit riders should be delayed on their vital journeys to and from downtown. A new class of project “below-the-line” was invented to accommodate work that was necessary, but for which money had yet to be found.
However, even getting on that unfunded list required acknowledgement that a project was necessary, and a long list of below-below-the-line work accumulated. In budgetary terms, this tactic was non “sustainable”. One cannot claim to be making a budget while ignoring over half of one’s future needs. Far from being ready to face the future, the TTC had a long queue of projects needed to refresh decades-old infrastructure, but no money to pay for them because they officially didn’t exist in the mind of fiscal planners.
This was not entirely the TTC’s fault. The City of Toronto preferred to have its transit system and appetite for capital look as if everything was in hand. The situation was not helped one bit by the prevailing attitude among some politicians that transit infrastructure, especially subways, is near-immortal while, in fact, lines dating back to the mid-20th century were showing signs of their age.
The situation was simply untenable as what once was “the future” banged loudly on Toronto’s door. In early 2019, a 15 year capital funding outlook was presented to the TTC Board including a $33.5 billion projection of capital needs to 2033.
The capital budget and ten-year plan before the Board on December 21 is not a full update of the 15-year plan, but it shows the transit funding crisis Toronto faces quite starkly. The 15 year plan’s status today is:
… the CIP has been updated and further refined in accordance with Board and Council direction, resulting in a 2021 to 2035 CIP that totals $37.7 billion, of which $10.349 billion is unfunded within the first 10 years and a total of $23.239 billion over the 15-year period. [p. 1]
The total does not in include major expansion projects beyond closeout of the Spadina extension project ($120 million), end-of-life support for the SRT ($47 million), and design work for the Waterfront LRT ($50 million). This is small change on the scale of the 15 year plan’s billions.
Updated November 10, 2021 at 8:50am: Links to TTC reports updated to point to the new website.
Updated December 21, 2020 at 5:50 pm: This article has been updated with additional and replacement illustrations from TTC management’s presentation to the Board at its meeting today. Explanatory text has been added or modified as needed. (The illustrations from this presentation are clearly identified by the date on them.)
Other issues were raised both by deputations and by Board members. I will deal with these in a separate article.
On Monday, December 21, the TTC Board will consider its Operating and Capital Budgets for 2021. This article deals with the Operating budget that pays for day-to-day service and maintenance. I will turn to the Capital budget that pays for major repairs and system expansion in a separate article.
Tracking the budget can be challenging even in normal times because there are so many moving parts. This year we have the collapse of demand thanks to the pandemic, together with an uncertain future for both economic and ridership recovery, not to mention government support to bridge the gap.
The table below shows how the budget has evolved over the past year. It begins, as all budgets do, with the prior year’s budget as a starting point. Normally, there would be much hand-wringing if the probable outcome were off by a tiny amount. Covid has blown such a hole in our finances that projections made a year ago bear no relation to the year as it evolved.
Along the way, there were many changes to operations through the year, but the TTC managed to keep service overall at about 85 per cent of the planned level. This percentage was not uniform across the system. Some bus routes, the very part of the network that suffered the least from ridership loss, saw substantial service cuts through the loss of their express services. As the TTC gradually restores the network, these problems will be reversed, but there is no guarantee that the system will have enough resources to deal with the combined effect of returning demand and a continued desire for social distancing.
The 2021 base budget includes various changes between 2020 and 2021. For 2021 there is a combination of new and enhanced services (a paltry amount compared to the overall budget) and a very large requirement (almost $800 million) to cover for Covid effects.
Fare and other miscellaneous revenue such as commuter parking and advertising will be down about 58 per cent over the 2021 year. This is not as deep as the losses at their worst in 2020, but ridership is projected to grow slowly through the year improving the TTC’s revenue picture, although it remains far from the pink of health.
Absent in the 2021 budget is any provision for a fare increase. Under normal circumstances this would generate about $30 million in added revenue, but fares now account for less than half of their former contribution. Mayor Tory has announced that there will be no fare increase, and this is a year in which that is a comparatively inexpensive decision. A longer-term problem will be a decision on the target level of fare revenue as operations and ridership return to normal in future years especially as covid-related subsidies disappear.
Expenses will rise by 2.4 per cent on the conventional system, although on a dollar basis, this is substantially offset by Wheel-Trans budget cuts in response to reduced demand.
The bottom line is that almost $800 million will be needed to supplement TTC’s normal revenue streams while maintaining service as planned. The arrival of such funding is far from certain, and detailed announcements probably await provincial and federal budgets for the fiscal year beginning April 1, 2021. Committed funding to date only gets the City and TTC to March 31, 2021.
Recent announcements might have sounded as if this were all new money, but in fact the status of transit funding is unknown for three quarters of 2021 starting, appropriately enough, on April 1st.
Unless otherwise noted, all tables and charts in this article come from the TTC’s Operating Budget report or from the Presentation at the Board Meeting of December 21, 2020.