
The TTC is reviewing its Service Standards with consultations of interested groups and the general public. The first public survey is now online until Sunday, October 11, 2026.
The goals, as stated in the introduction to the online questionnaire, are:
- bring more transparency to how we plan, deliver, monitor, and evaluate service
- support better service planning and delivery
- make sure our standards better reflect the perspectives and experiences of customers and front-line staff
Full disclosure: I have participated in earlier reviews of the Standards through the TTC’s Planning Advisory Committee.
This round does not cover all aspects of the Standards, but seeks to gain feedback on some key issues and options:
- Streetcar stop spacing
- Service reliability
- Vehicle crowding
A second round in the Winter (date TBA) will present findings and recommendations, and may address other topics. This process will not reach the point of new standards going to the TTC Board for approval before the 2027 Network Plan or the 2027 Budget, but could affect in-year service changes either as a goal or a constraint.
Although the TTC hopes to develop new or refined metrics by which service could be analyzed, there is little of this in the survey. A challenge with metrics is the need to understand how they work, and in particular what opportunities they provide to “game the standards”. In effect, are gold stars rewarded for indifferent work because the questions and marking scheme are skewed?
Even with its shortcomings, I urge readers who care about TTC service to fill out the survey.
The main part of this article reviews the questionnaire and some of the assumptions behind the options offered.
Streetcar Stop Spacing
The survey introduces this topic by saying:
There are a range of factors that influence streetcar speed and reliability, including traffic, whether there’s transit priority infrastructure (like dedicated lanes or advanced traffic signals), and more. Stop spacing is one of these factors and something the TTC has direct control over.
Other factors the TTC controls are operating policies and permanent slow orders on the streetcar network at intersections and underpasses, not to mention track condition. There is no mention of these in the survey.
Survey respondents can choose between three options:
- No change to the standard
- 400-500m standard
- 600+m standard
Respondents can choose up to three priority items from this list:
- distance to/from stops,
- safety and comfort,
- accessibility,
- service speed and reliability,
- ability to transfer between routes,
- access to important destinations.
The survey claims that with fewer stops, “service may be faster and more reliable”. The trade off would be a 1-2 minute longer walk to a stop for the 400-500m range, and a “noticeably longer walk” for 500-600m.
The important word here is “may”. Reliability is determined by many factors, notably the uneven spacing of transit vehicles, uneven loading, and crowding during off-peak periods when it should not occur according the Standards.
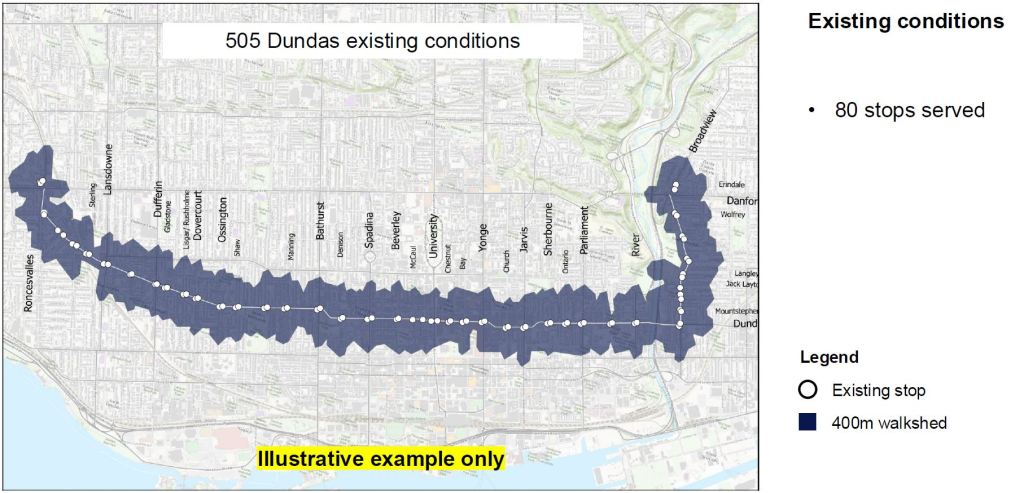
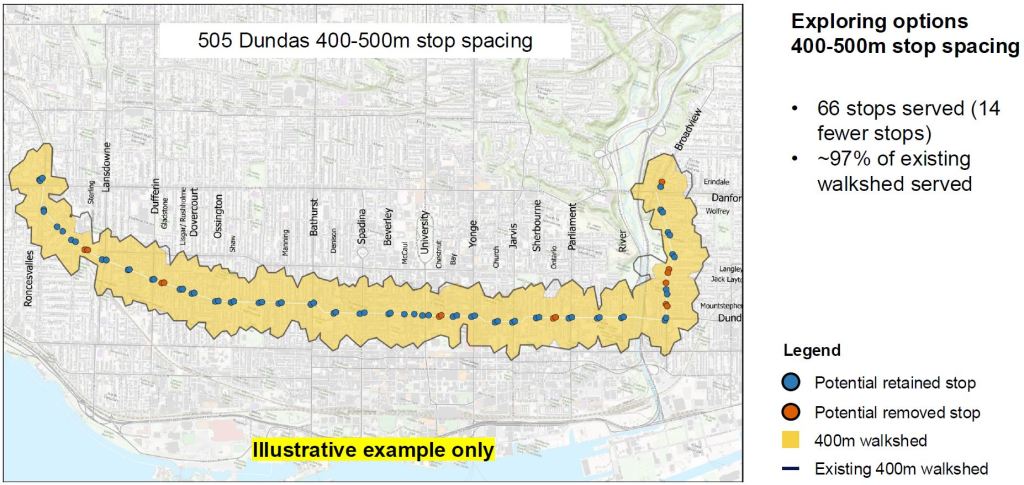
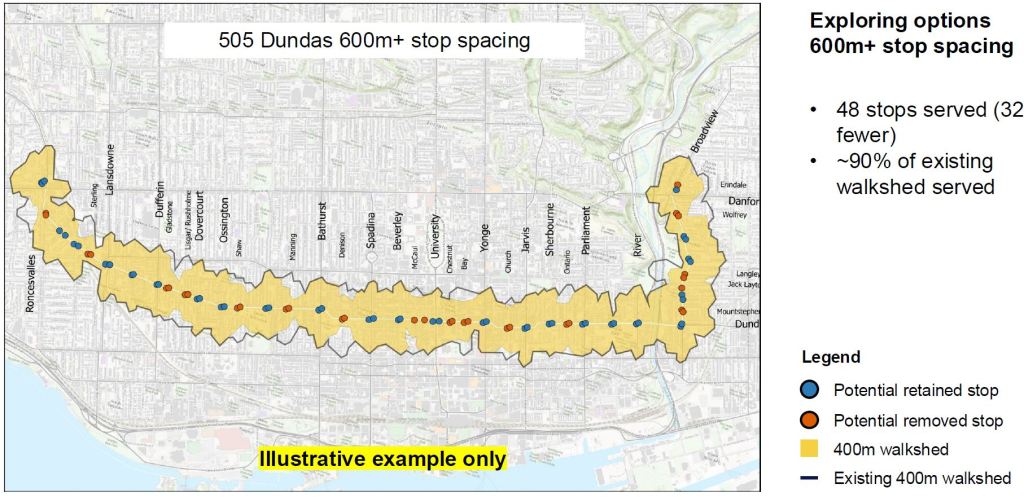
The survey gives no examples of what the wider ranges would actually imply, but maps shown to the Planning Advisory Committee do give a sense of what this would mean for the 505 Dundas car.
On the left is the existing route showing all stops and the area that is within a 400m walk to a stop. If the standard changes to 400-500m, 14 stops are removed (18% of the total), but the 400m walkshed does not change very much. At 600m, many more stops are removed (32, 40% of the total).
A few points are worth mentioning here:
- The 600m spacing shaves more off of the 400m walkshed than the 500m scheme. Note that the size of the walkshed is not part of the Standards, and there would be less sidestreet coverage in suburban areas due to street layouts and more widely-spaced routes. This is not an issue for streetcar routes, but would kick in if the scheme were extended to the bus network.
- The 600m scheme eliminates stops at major intersections such as Bay, Church and Roncesvalles, as well as both sets of stops serving Bridgepoint Hospital (Broadview north of Gerrard). It treats the distance from Yonge to University (630m) as acceptable with no thought of the density of demand along the way.
- Several candidate stop removals are at signalled intersections. Without aggressive transit priority signals there is no guarantee that streetcars would not be held there even without a transit stop.
- There is no analysis of the change in stop service times. For example, one of the longest events for streetcars is a ramp deployment. Assuming that the same number of riders needing the ramp still use the line, deployments will occur more frequently at the remaining stops. There are no stats on stop usage to indicate how many riders would be forced to use the remaining stops adding to dwell times there.
- For the record, the stops on Erindale at Broadview and Broadview at Danforth have already been taken out of service under current standards. All riders must now use Broadview Station.
If the TTC is going to float proposals, they need to show riders (and politicians who might rubber stamp the changes) what the effects are. There are no examples in the survey.
Moreover, this change is applied only to the streetcar system, but not to bus routes. If the TTC really believes that stop spacing is critical to faster operation, why only change the standard for a handful of routes? Why the Queen and King cars, but not the Dufferin, Ossington, Wellesley and Pape buses? Of course on a city wide basis, the reaction would be more substantial.
Pedestrian walking speeds vary with age, physical condition and other impediments. Typical speeds range from 3-4 m/s, less for seniors and others with any kind of impediment. 100m translates to 25-33 seconds more walk time, longer for slower speeds. This does not sound like much, but every 100m adds to total travel time. If a stop is eliminated, service that might have been conveniently nearby moves some distance away.
Is this tradeoff justified by the supposedly faster, more reliable journey? The TTC offers no data to support a claim of increased reliability, and the savings in travel time depend on whether one’s journey involves territory where stops would be removed.
Service Reliability
The survey offers the option of comment on subway service, on frequent (every 10 minutes or less) bus and streetcar service, and infrequent (over 10 minutes) service. The introductory text notes that:
Customers consistently tell us that reliable service is one of the most important parts of their transit experience.
The TTC will review service metrics so that they reflect actual rider experience, help identify issues, are appropriate to the type of service, and “provide metrics that lead to better service, not just better scores”. The last point is telling because if erratic service is regarded as “on time”, this defeats the purpose, but allows management to claim success and get their gold star.
Subway
The survey includes diagrams showing two types of service. In one example, gaps between trains are not smoothed out along the route and bunching can persist. This leads to crowding on the “gap train”. In the second example trains are held enroute to restore spacing. The survey asks about three topics: travel time, operation of full service (i.e. no short turns or missing trains), and train spacing.


The TTC used to automatically space subway service by holding trains at points where the signal system could enforce a stop. These were at stations with crossovers or centre tracks where the signals were more restrictive. This applies today on Line 2, but on Line 1 the Automatic Train Control (ATC) system can enforce a hold anywhere. An shortcoming in the old system was that it was based on scheduled arrivals. Late trains would be dispatched immediately even if they were not evenly spaced. (This could be avoided by manual adjustments from the control room.)
One question asks how comfortable a rider would be with mid-route holds if this meant service had fewer gaps, less crowding and better train spacing. Another asks how much a rider would support a focus on train spacing to improve reliability.
There is a gap in this logic in the introductory text where the survey says:
Today, we consider subway service reliable if trains leave the ends of the lines evenly spaced.
This is not true. The Service Standards provide:
For services that operate better than 6 minutes, the vehicle is considered on-time when the headway deviation is less than 100% of the scheduled headway. For example a service that operates every 3 minutes is deemed on-time if the headway deviation falls between 0 minutes and 6 minutes. TTC’s goal is to have 95% of all trips operated within +-100% of the scheduled headway over the entire service day.
This allows trains to be double the scheduled headway apart but still be “on time”, and there is even an exception allowing 5% of service to exceed the target. This is completely contrary to the concept of reliable service.
The survey does not even mention the chronic problem of slow orders across the subway network, particularly on Line 1. These contribute substantially to travel time.
Another common subway problem, when not beset by slow orders, is excessive scheduled travel time. This causes backlogs of trains at terminals, especially during periods of frequent service.
Frequent Surface Routes
The survey observes:
We have also learned from customer feedback that, on our more frequent service, customers care more about vehicles arriving evenly spaced than according to the schedule.
As with the subway, the survey misleads about the operation of surface route Standards:
Today we consider frequent bus or streetcar service if vehicles leave the first stop according to schedule.
Well, no, that’s not how the standards actually work. From the Service Standards:
For services that operate between 5 and 10 minutes, passengers do not rely on printed schedules, but expect vehicles to arrive at prescribed headways. Therefore, on-time performance for frequent service is measured by how well actual headways correlate to scheduled headway intervals. […]
The vehicle is considered on-time when the headway deviation is less than 50% of the scheduled headway. For example, a service that operates every 6 minutes is deemed on-time if the headway deviation falls between 3 minutes and 9 minutes. TTC’s goal is to have 60% of all trips operated within +-50% of the scheduled headway over the entire service day.
In other words, the schedule is not used to measure service, but the flexibility of using the scheduled headway does not help much either because there is a 50% margin. Services every 6 minutes can actually run with 9 minute gaps, and those on 10 minute headways can have 15 minute gaps. If that isn’t bad enough, 40% of trips do not have to meet any standard. This means that for a 6 minute headway, or 10 cars per hour, 4 cars can be on very wide gaps or running nose to tail with their leader.
The diagrams below are from the survey, and they speak to scheduled vehicle spacing, although the image for headway based management would be similar. The key difference is that line management would not focus on being “on time”, but rather on service reliability.
Note that the proposal is headway-based while the existing operation is described as schedule-based. This is likely closer to the truth of how the TTC manages service in spite of text in the Standards.
Existing:


Proposed.
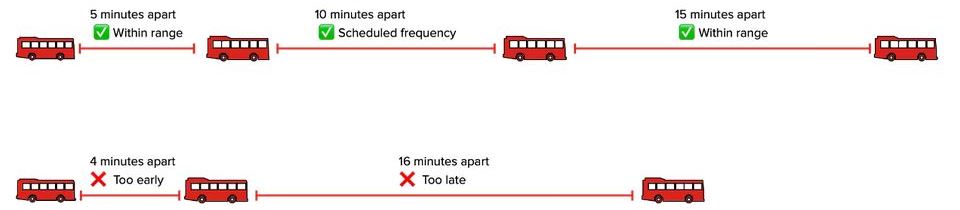
Note that the upper chart explicitly shows the size of a permissible gap. As for the lower chart, this could be “fixed” simply by shifting the middle bus one minute, and a headway pattern of 5-15-5-15 minutes would be considered an acceptable 10 minute service. Ironically, the acceptable pattern for a 6 minute service would be 3-9-3-9 requiring better adherence to spacing.
This pattern can also emerge on a branching route like 504 King where it is common for cars on the 504A and 504B branches to run together as pairs from the points where branches merge (Sumach westbound, Dufferin eastbound). This is not just a question of managing headways at terminals. (The same thing happens on branching bus routes.)
The survey asks if holds within trips to space vehicles would be acceptable. This has operational implications for streetcars because they would, for mixed traffic routes, sit at a stop blocking traffic, possibly including following services sharing the same line. For buses, there would have to be lay-by space where a bus could pull out of traffic.
The survey does not mention that erratic service occurs even on routes that have reserved lanes and should not be subject to congestion or other typical delays, nor does it mention terminal congestion caused by padded travel times in schedules.
Less Frequent Surface Routes
The introduction for this section makes the observation that:
Our operators are familiar with the unique conditions of each route and sometimes need flexibility to respond to changing conditions along the route.
Well, yes, but that is true of all routes, particularly those with diversions or construction projects for which there is no provision in the schedules. The TTC seeks to balance customer needs with operational “flexibility to respond to the conditions on the ground”.
They propose an on-time target at terminals of up to 3 minutes late, and at key points enroute of ±3 minutes. Note that this is more restrictive than for a 10 minute “frequent” service.
The survey asks how well these targets reflect what riders expect, and just as importantly whether leaving a stop 3 minutes early would be acceptable.
If operator experience suggests that buses will habitually be late, then change the schedule promptly, and tell the world.
A related issue here is service operation during significant disruptions or changes that are known in advance. Only on rare occasions does the TTC issue a “mid board” schedule change affecting operator schedules, public information and route signage. Such a change can be picked up more easily by trip planning apps, provided that the information is posted.
For example, the TTC recently began a 501 Queen diversion via King west of Shaw that will run through October. However, they have not posted an updated version of the schedule that would cause trip planning apps to predict service based on the revised routing. The practice should apply to all major changes in routes and schedule provisions for modified time points across the system. This will not catch every rider, but at least the TTC’s website and transit apps would not give riders false information about their service.
New schedules have been posted for the September 30 shift of bus routes to the Scarborough Busway, but the 501 Queen car is still on Queen Street in the schedule. Among other problems, this means that trip prediction apps will not work properly, and incorrect info will appear on the TTC’s 501/301 route pages.
(Detailed schedules are posted in GTFS format on the City of Toronto’s Open Data site. GTFS is an industry standard used so that trip planning and mapping apps have a common format of data in every transit system.)
Crowding
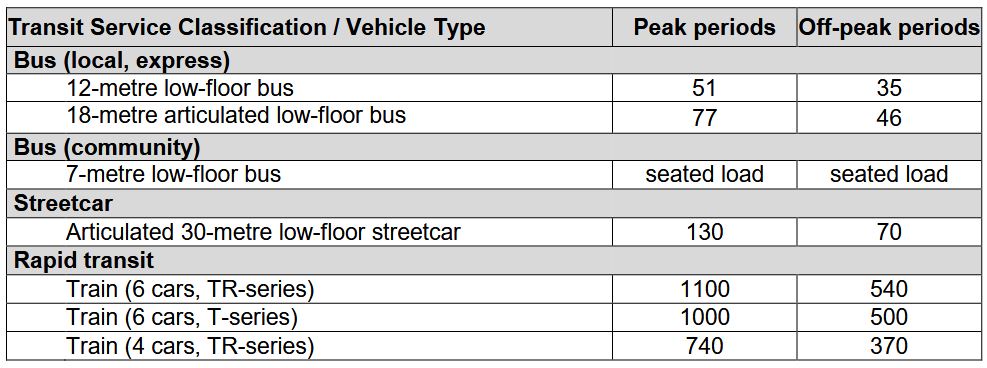
Crowding standards are different for each type of vehicle, and the off-peak standard is based on the premise that there will be no standees. The standard is averaged over a several weeks, and so some trips will exceed the standard. This runs into two major problems:
- Averaging makes problem routes seem less crowded that they might be, in part, due to erratic service, not to mention day-to-day variations in route conditions and demand.
- There will be more riders on crowded vehicles and the average experience will be of crowding even if, numerically, the “average” bus meets the standard. Rider perceptions will be very different from the published stats.
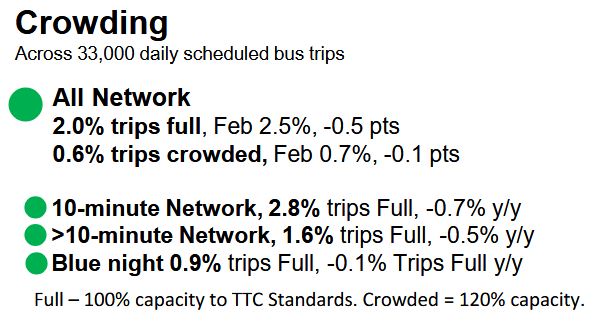
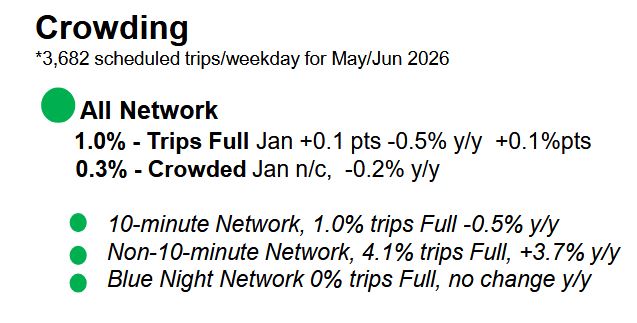
A related issue is that the TTC does not publish detailed stats very often, and there is no way to know, on a day-to-day basis, which routes do not meet their standards. In the monthly CEO’s Report, crowding is reported on a modal basis every four months or so with stats showing only a very small proportion of bus or streetcar trips are at 120% of the loading standard. This is not broken down by route or time period, and is averaged over a full month’s data.
Riders might be forgiven for surprise that less than 1% of trips are “crowded” and 2% of trips are “full” according to TTC stats. The green dots on these charts give comfort to TTC Board members that all is well when, demonstrably, the situation on the street is much different.
The survey does acknowledge that crowding can be a problem:
Despite service meeting the standard overall, some customers will be on crowded vehicles, having less personal space or experiencing a less comfortable trip. In some cases, overcrowding can also make it more difficult for customers to board a vehicle.
The standard does not take into account space lost to large items such as shopping trolleys, baby carriages, bicycles or wheeled chairs. There is some space reserved for bikes and chairs, but this is typically occupied by regular riders. Moreover, the ability to navigate through a vehicle, especially on buses, can be constrained by narrowed or blocked aisles.
Here are the existing standards:
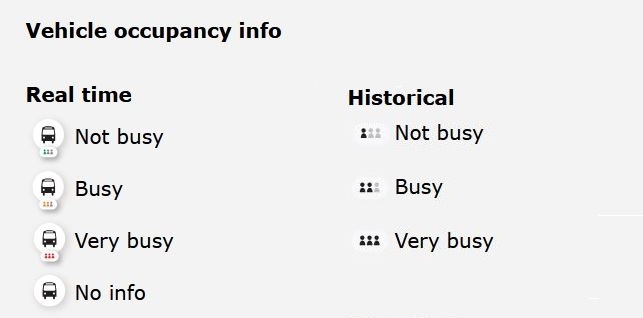
A further question about how TTC presents crowding data lies on their route schedule pages where typical crowding levels are shown. No numeric values are associated with these symbols, and in particular there is no indication of whether off-peak service is measured against off-peak standards.
The survey offers three options:
- Leave the standards as they are.
- Target traditionally overcrowded bus and streetcar trips with extra vehicles.
- Lower the number of passengers under the standards so that, on average, crowding would be less common.
Both the second and third options require more service, and hence more funding, although one could argue that improving reliability might smooth out some of the crowding, assuming that there is capacity to spare.
The survey also asks which conditions make riders feel that a vehicle is crowded in peak times:
- unable to find a seat,
- difficulty boarding full vehicles,
- passengers standing too close together,
- crowding near doorways,
- full vehicles pass by,
- accessibility challenges boarding and moving through vehicles,
- difficulty travelling with children, strollers, etc.
The presence of “difficulty boarding” and “vehicles pass by” in this list implies that overcrowding is more common than the official stats indicate.
The survey also asks about the importance to riders of regularly publishing crowding info by route and time of day.

