
Much discussion in the current election campaign targets TTC fares and proposed changes in 2027. Depending on which candidate you trust, they might go up, selectively, be frozen, or even go down with the effect of future changes to fare capping rules.
Many surveys, including a recent one from Liaison Strategies, show that the key factor in retaining and attracting riders to transit is not fares, but service reliability, frequency, and comfort. This includes many factors, and the “fixes” do not lend themselves to simple campaign slogans.
Drawing lines on maps is a favourite pass-time for politicians and the consultants who feed off their desire for a credible plan. We went through that with John Tory’s ever-vanishing SmartTrack scheme, then later with Doug Ford’s subway plan. They share one thing: nothing needs to be done today, and come tomorrow the plan might shrink thanks to technical challenges and limited financing. The Ford plan survives because of spending (and borrowing) at a level that would never occur without a generous infusion of political ego. Planned spending on the provincial subway plan is on a par with the TTC’s entire state of good repair backlog.
Fare schemes, be they new concession rates, discounts or regional amalgamations, can be quickly implemented at comparatively modest cost, but they do little beyond, possibly, generating added ridership which might, or might not, be translated to added service and capacity. With fare revenue covering only 40% of the operating budget and none of the capital, it is impossible for fare cuts to generate enough new riding and income to pay for service increases.
Toronto has a long-term plan, TransformTO, that seeks “net zero” transportation emissions through complete electrification of transit by 2040. That is comparatively easy to achieve because it is the path the TTC is on already. However, a more ambitious plan originally aimed at a major shift away from autos to transit by 2050, but now has a 2040 target. There is no sense of how Toronto will achieve this.
A technical backgrounder to the 2050 plan proposed, among other things, that Toronto:
- Convert one lane of traffic to exclusive bus lanes on all arterials.
- Increase service frequency on all transit routes:
- bus by 70%, streetcar by 50%, subway off-peak service increased to every 3 mins.
- Tolls of $0.66/km on all arterial roads.
- Free transit. No transit fares.
In the current political climate, it is easy to guess the fate of exclusive bus lanes and road tolls. Free transit would cost over $1-billion annually before accounting for the cost of the additional service.
The TTC Capital Plan includes a long-range, unfunded provision for TransformTO:
- Vehicles (added buses and streetcars): $3.51-billion
- Infrastructure (2 additional garages, upgrades to existing garages and carhouses, expanded terminals to handle higher service levels): $3.82-billion
There is no mention of operating costs for the larger fleets and all of the added service nor is there even an outline of a plan to get from the transit system of 2026 to the hoped-for 2040.
Somewhere in between the aggressive goals of TransformTO and current service levels is likely what riders will actually see. The TTC has not published a detailed analysis of options, and the Board, in spite of having a “Strategic Planning Committee”, has not asked for one.
Any plan to improve transit service must look at the network as a whole, at how routes in many parts of the city can provide better service. This will require decisions about the size of the transit system, growth of the surface bus and streetcar services, and tradeoffs needed in the use of road space.
Toronto’s RapidTO plan, a set of reserved bus lanes, is not progressing quickly in the face of political opposition. Even without that, the pace of change would not bring meaningful improvement to most riders. Shifting travel to transit requires network-wide change that people can see everywhere, not just on a few routes they might not use.
A further problem lies in current service quality. It is one thing to say “make transit more competitive”, but first Toronto must acknowledge transit’s decline and the widening gap between what is offered and what would-be riders will demand. Toronto must acknowledge that gap and acknowledge that just “filling in the hole” would only get us back to the previous decade.
Back in December 2017, TTC staff presented a Ridership Growth Strategy that discussed, among other things, the ridership decline of the mid-2010s and the tactics needed to attract new riders. The first few percent of growth was expected to come from existing riders who would see restored reliability as an incentive. Net new riders would come with aggressive changes including major service upgrades.
Some of this actually happened, but any momentum the plan had was lost with the pandemic era. Substantial change is needed to draw new riders transit, but this message is lost in an era of budget limits and small-scale tweaks to transit service.

This article examines the evolution of transit service, the options and the challenges facing anyone who hopes to improve what the TTC offers.
Subway Service
TransformTO foresees improved subway service only in the off-peak with a boost to trains every 3 minutes. Current off-peak service on Lines 1 and 2 now ranges from every 3’20” to 5’00” depending on the period. There is only a limited capacity to improve peak period service until about 2030 for a variety of reasons, some of which can be traced to poor planning and budget limits in the last decade.
Subway service on each of the three lines is limited by the technology in each case.
In brief, peak improvements on Lines 1 and 2 are constrained by the available fleet. Even though the new ATC signal system allows closer train spacings on Line 1, the TTC does not own the trains needed to improve peak scheduled frequencies over the whole line. Line 2 could see a modest increase but is limited by its signal system. Line 4 could increase peak service from 4 trains to 5, but is limited by its small, dedicated fleet.
Slow orders are a particular problem on Line 1, although they have also affected Line 2. As of October 1, all but 3 of 16 slow orders are on Line 1. Given that many have been in place on and off for a very long time, it is unclear how soon they will be reduced to a much smaller number and how speedily new defects will be repaired. This could provide some headroom for faster operation and more frequent service, but riders have waited a long time to see improvement on that score.
Many types of delay affect subway service. I will turn to these in a separate article.
Bus Service
The peak number of buses in service has floated between 1,500 and 1,600 for over a decade. Although there was some redeployment thanks to the Line 1 Vaughan extension in December 2017, and more recently Lines 6 Finch West and 5 Eglinton, the number of buses in use remained static. Meanwhile the fleet grew substantially without a corresponding increase in service.
In September 2026, the peak scheduled service is 1,580 buses (including 50 running on streetcar routes) out of a fleet of 2,184. That’s a spare factor of 38% (almost 4 spare buses for every 10 scheduled), almost double the industry norm of 20%. Some of those buses have been used as “Run As Directed” extras (or RADs) but the TTC cut back substantially on RADs with the Fall 2026 schedules.
If the spares were reduced to 20%, this would leave 1,820 buses available for peak service, or 240 more than the scheduled peak today. Providing more bus service is not a question of a too-small fleet (a problem common in the early 2000s when growth was limited by vehicle availability), but of under-staffing.
The obvious question is where the buses should be deployed, but that will require the TTC to publish detailed crowding statistics, not the simplistic average values now used. A related question is whether the Service Standards should target a lower crowding level on buses. This is one aspect of a Service Standards review now underway.
There is a catch-22 in reducing what constitutes a “full” bus. Past experience shows that ridership can expand to fill the new capacity, but if the political winds change, crowded buses again become the norm.
The bus surplus could tide us over a period of service improvements near-term, but a long-term plan to expand the fleet is needed, along with the funding to buy and actually operate more buses. The TTC does not even have committed funding for its routine replacement of aging buses, let alone to expand the fleet and build more garages.
Streetcars
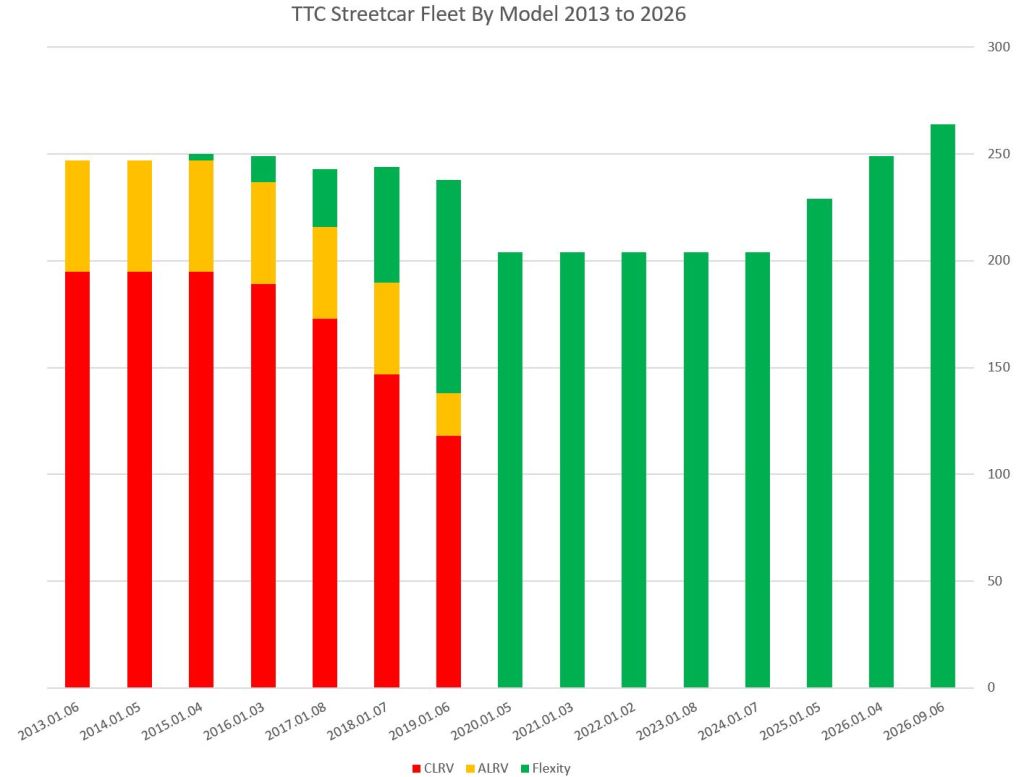
Toronto now has a fleet of 264 Flexity streetcars, bigger than the combined fleet of smaller CLRVs and ALRVs which they replaced. The intent was to improve streetcar service, long constrained by reliability of the old fleets, and provide for system extension with, at least, a Waterfront East line.
Better service is not what riders got. Until recently, most streetcar routes operated with a 10 minute headway, and this was subject to the usual bunching and gaps, but magnified by the wider scheduled space between cars.
In Fall 2025, three routes moved to a 6 minute headway: 505 Dundas, 511 Bathurst and 512 St. Clair. Routes waiting for improvement are 501 Queen and 506 Carlton, the two longest routes in the system, plus 507 Long Branch, 509 Harbourfront and 503 Kingston Road.
(One could argue that the last three might not deserve better service because of route overlaps, but I include them for completeness. 504 King and 510 Spadina already have better than 10′ service.)
The TTC has not published ridership data to show the effect on the three routes with improved service.
A further challenge for streetcar ridership is the frequent service disruptions and diversions thanks to major construction projects. The Ontario Line work at Queen Station is the biggest of these, but a series of road closures for water main and track replacement bedeviled streetcar operations in recent years and with more to come, notably on King and Queen Streets.
The water and sewer upgrades are a special case in that infrastructure over a century old is overdue for renewal. Once the work is done, this scale of upheaval should not recur for a very long time, but getting to that new, stable environment will be painful. This complicates efforts to make streetcar service more attractive even before we talk about service quality and line management, items that are even more critical when routes are disrupted. Projects are planned in 2027 on King Street West, Queen Street East and College Street. (For a detailed view of infrastructure plans, see Toronto’s Infrastructure Viewer.)
Traffic congestion downtown is a major problem for streetcars, although this has seen modest relief with the addition of Traffic Wardens who manage major intersections and minimize “box blocking” that can foul both transit service and general traffic.
Looking at the streetcar system with all routes actually using streetcars (a condition not seen for well over decade), a shift to a six-minute maximum headway on all lines would require about 45 more cars (54 allowing for spares), something that is quite possible within the existing fleet. That is not the 50% increase contemplated by TransformTO, but it is possible with no added infrastructure. Going beyond that line is more challenging.
Service Reliability, Operating Practices and Congestion
In a recent post, I wrote about the TTC’s current review of their Service Standards. They are considering options to improve mid-route performance, but their methodology is flawed before they even begin. First, they assume that vehicles leave terminals “on time”, but this is a very flexible concept allowing erratic service from trip origins. Another possibility is mid-route headway management. This is viable provided there is a location where buses or streetcars can lay over to get back on time.
The basic problem is that TTC metrics are too generous and allow service that riders would consider as bunched to slip within “on time performance” thereby understating the extent of reliability problems. This requires both that the metric be tightened to give a more accurate view of rider experience, and that the TTC accept that some of their operations are not as good as they make out, and work to improve them. Wait time for vehicles is a considerable part of some journeys, especially when transfers are required.
The TTC recognizes that managing the spacing between vehicles on frequent routes might be a better approach than attempting to stay on a schedule, but this is rarely used. They have a bunching and gapping pilot study underway, but it has not yet reported significant benefits or a proposed change in line management practices.
I will not dive into the topic here as reliability problems are examined in other articles in more detail.
Operating practices on the streetcar system lead to slower operation now in 2026 than in years past for various reasons invoked in the name of “safety”. The question, however, is why these became necessary compared to a century of streetcar operations without slow travel through intersections. The TTC is supposed to be studying whether service can be sped up, but they have not yet produced a report.
Traffic congestion is a problem throughout the city, not just on the downtown streetcar system. Partly this could be addressed with more aggressive signal controls favouring transit vehicles, and partly through use of Traffic Wardens to impose order on motorists who prefer to snarl traffic rather than letting intersections work properly.
The big debate, however, is the question about who and what is road space for. Movement or storage? Autos, transit, goods movement, cyclists, pedestrians? This is not easily solved especially on streets where transit service is not frequent and dedication of space and time to the occasional transit vehicle is hard to justify. Moreover, the approach and effects will differ between downtown routes on narrow streets with local parking and suburban routes on wider streets where parking is mainly off-street.
Staffing and Budgets
A common refrain, and not just in Toronto, is that transit operators are hard to find, and once hired, hard to retain. That said, the question for TTC is whether they are trying to grow the pool of operators to run more service, whether they have more operators than scheduled service requires, or if there is a deliberate attempt to cap the workforce.
More workers means higher costs, obviously, but if the unwritten Council and Board direction is to cap costs, that also means capped staffing and with it any flexibility to run more service.
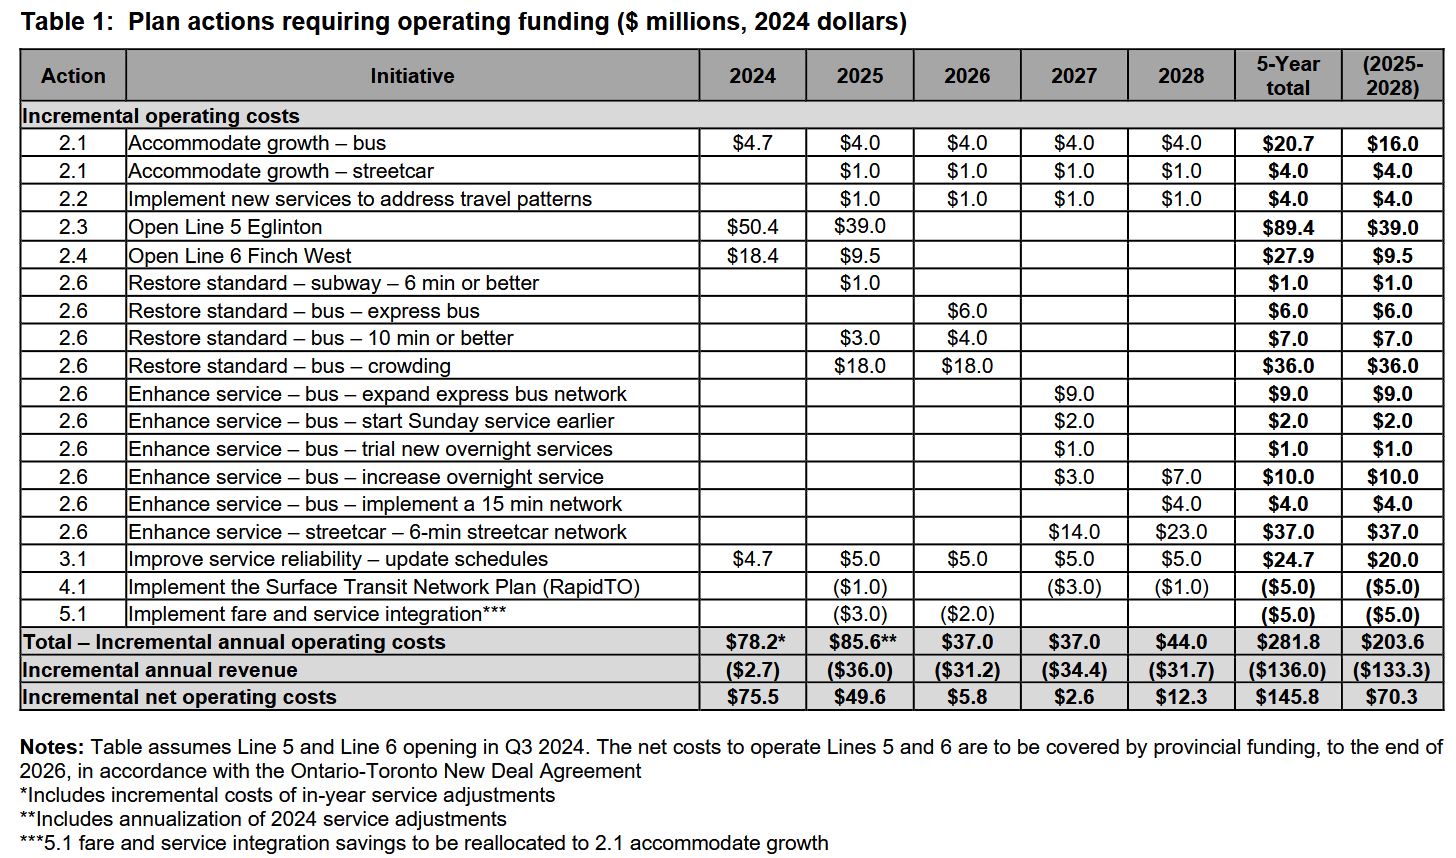
TTC knows that it has problems with crowding, and that it has routes in the “10 minute network” than do not run that frequently. Small provisions exist in the 2024-2028 Five Year Plan address this but with no details.
A major issue for 2027 and beyond is the status of the “New Deal” with Ontario that brought a few years of added operating subsidy to the TTC. It is not clear whether this will be extended, or if a new Mayor, should there be one, even seek the funding.
The Five Year Plan proposes only modest growth. That is official policy, but it is inadequate if transit is to claim a larger share of the travel market. A better, more aggressive plan is needed, even if we are not sure today how we would pay for it. The option for strong growth should be on the table where the City can decide if that is really the future we should pursue.
Further Details
The balance of this article contains greater detail about the three fleets and associated infrastructure for those who are interested in the details.
Subways
Line 1 – Yonge-University-Spadina
Line 1 has the greatest potential for more frequent service as it uses automatic train control (ATC) that allows trains to be more closely-spaced than the prececessor block signals original installed on the line. However, the best possible train frequency is constrained by the size of the fleet, and to some extent by terminal geometry. Current peak service is 150 seconds (2’30”).
The Line 1 fleet comprises 76 6-car train sets of which 63 are scheduled at peak, plus 1 gap train, leaving 12 as spares (19%). If service were improved to the previous peak level of 140 seconds, 69 trains would be needed leaving only 7 spares (10%). The current fleet was sized based on an assumed peak-period short turn at Glencairn that would reduce peak train needs, but result in service every 280 seconds (4’40”) from Lawrence West to Vaughan.
Line 2 Bloor-Danforth
Line 2 is, until ATC goes live there in about 2030, limited by its traditional block signals that make headways below 140 seconds (2’20”) difficult to sustain over the whole line. Current peak service is 150 seconds (2’30”).
The Line 2 fleet comprises 61 6-car trains of which 45 are scheduled at peak plus 4 “gap trains” to fill in for delays, and 12 spares. If service were improved to 140 seconds (the lower limit with existing signals), 48 trains would be required (27% spares).
Line 4 Sheppard
Line 4 has much less service than the other routes with a headway of 330 seconds (5’30”) at all times. It has a dedicated fleet of 6 4-car TR trains of which 4 are scheduled at all times.
A five-train service would operate every 4’24” leaving one train spare.
Future Fleet Plans
Options for added service lie mainly in the future with delivery of additional and replacement trains.
- Line 1: The Richmond Hill extension project includes additional trains, but not beyond the number needed to run current service levels.
- Line 2: The TTC has 55 trains on order to replace existing service, with additional included in the Scarborough extension. As with Line 1, the expanded fleet will provide the current service levels over the extended line, but no more.
- Line 4: There is no plan for additional trains. They would likely be part of a Sheppard extension project if that ever occurs.
Fleet growth requires more storage. A new yard and possible maintenance facility are planned for Richmond Hill, and some storage will be provided on the Scarborough extension. A new carhouse and yard at Kipling is in design, but is unlikely to be built soon. It could be part of a Bloor West extension project, but that is long in the future.
Operational Issues
Terminal operations are affected by close headways and scheduled travel times. TTC policy for many years has been to pad schedules, but this causes terminal bunching when vehicles arrive early. Because subway terminals have space for only two trains at once, queues of trains build up approaching the stations. The situation is even worse if one platform is unavailable with an out-of-service train.
Closely spaced trains require quick crew changeovers so that trains can leave as soon as the track is clear. One person crews complicate this because an operator has to walk the length of a train, in addition to any time needed for a washroom break, in the short time trains are at terminals. The TTC used a “step back” technique so that operators would drop back one or two trains giving them a longer terminal time, but this has recently been dropped or lessened due to staffing constraints.
The most visible problem today is slow orders especially on Line 1. As I write this on October 1, there are 16 slow orders (aka “Restricted Speed Zones” or “RSZs”) in place, 13 on Line 1. It is not clear how much the travel time could be reduced and train frequency improved if there were fewer or no slow orders.
Off peak service improvements do not require any new trains, only more crews to operate them.
Peak service much below 2’20” would trigger both power upgrades (more frequent trains need more power) and station capacity issues.
Bus Fleet Size, Composition and Utilization
This section shows the evolution of the bus fleet from 2013 to 2026 using data from summary tables that are included in the TTC’s Scheduled Service Summaries. Current versions are published on their Planning page, and an archive of them is available on my site.
First, here is the big picture.
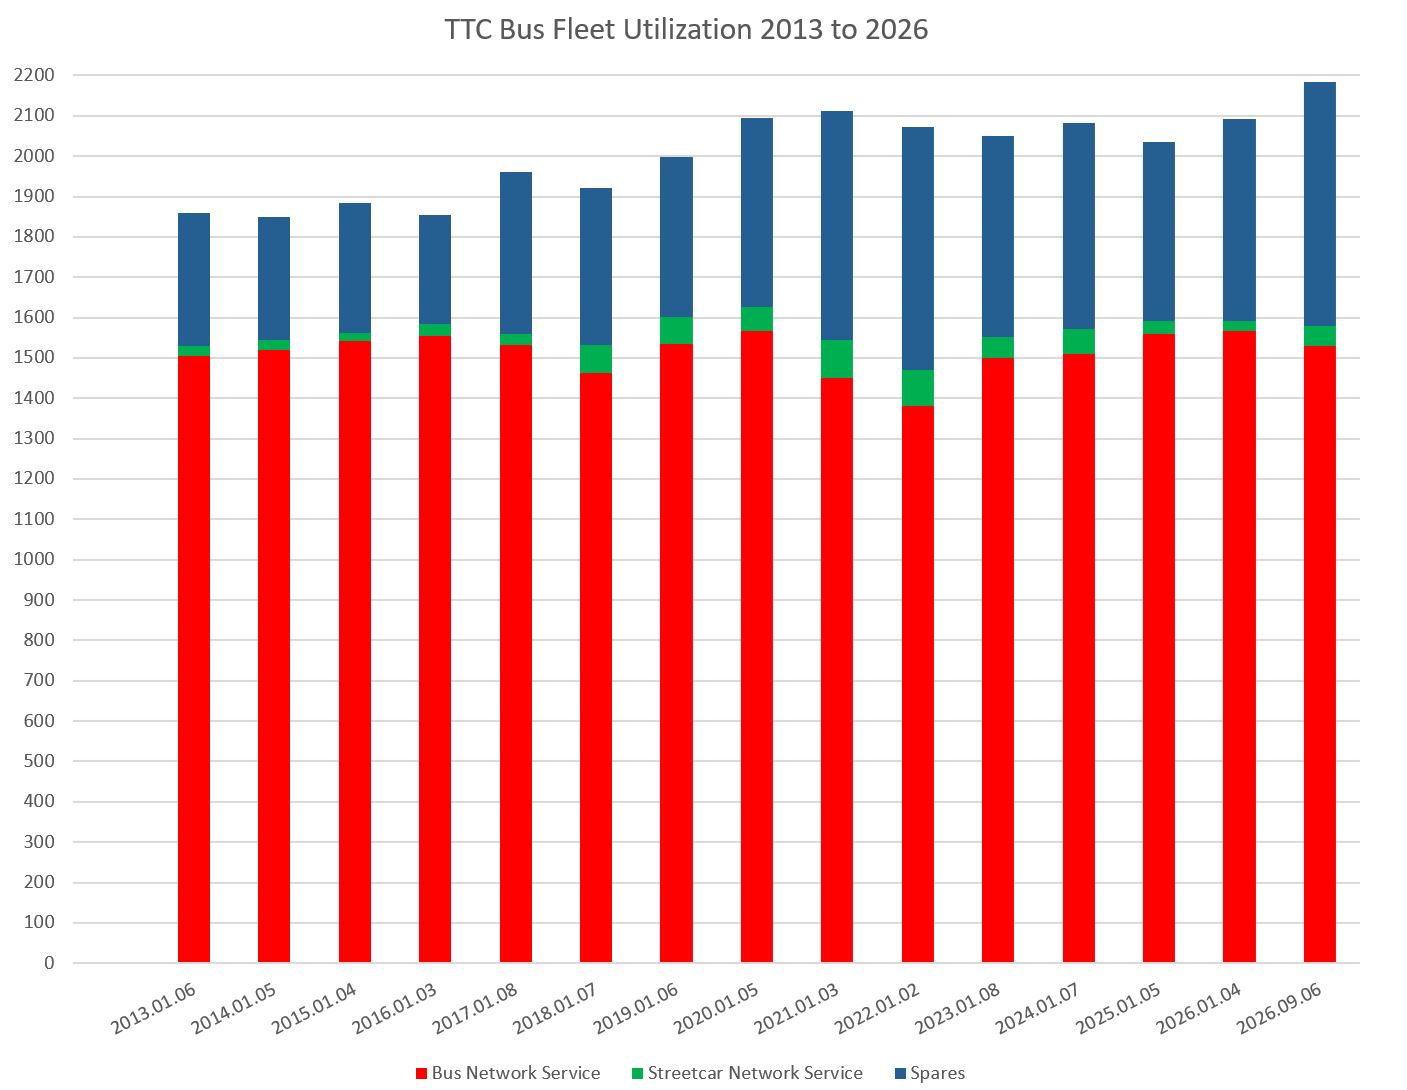
The red section at the bottom shows the peak scheduled service. Note that it has bounced around, particularly in the early pandemic period, but sits resolutely in the 1,500-1,600 vehicle range. There was a drop at the beginning of 2018 corresponding to the Vaughan subway extension opening, and a drop in September 2026 is due in part to the opening of Lines 5 Eglinton and 6 Finch West.
A small additional number of buses (green) operate on streetcar routes for construction projects, and they supplemented the dwindling streetcar fleet before 2020 when the new Flexities completely took over.
The blue bars at the top are the spare vehicles. Industry practice targets 20%, or about 300 buses on top of 1,500 peak scheduled. This was roughly the situation two decades ago. However the spare pool has grown and is now 604 buses on a base of 1,580 peak buses, close to 30%. Moreover, this pool has grown while scheduled service was static or declined.
Those with long memories will remember the mayoral campaign pitting John Tory against Olivia Chow almost a decade ago. Chow argued that more buses were needed for more service, and Tory only relented after his election when he “saw the light” about service shortfalls. 100 new buses were ordered and they arrived in 2017. However, there was little change in scheduled service and these buses simply went into the spare pool.
More recently, technical issues with eBuses have required added spares to offset reliability, especially with the BYD and Proterra test fleets that are now retired. But even with the large spare pool the TTC is not given enough money to operate more service. A recent claim is that service is back to pre-pandemic levels, but that is based on vehicle hours. With slower operation across the system, there are fewer vehicle kilometres of service provided. Some of the added hours simply go to extended terminal recovery times, not to service.
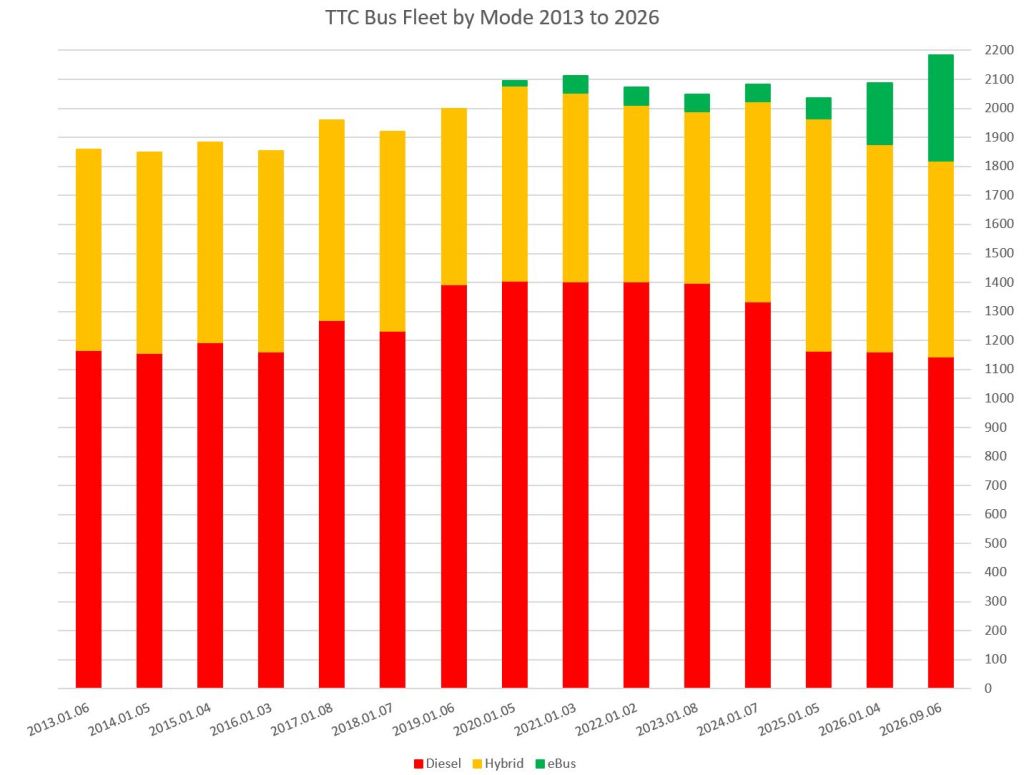
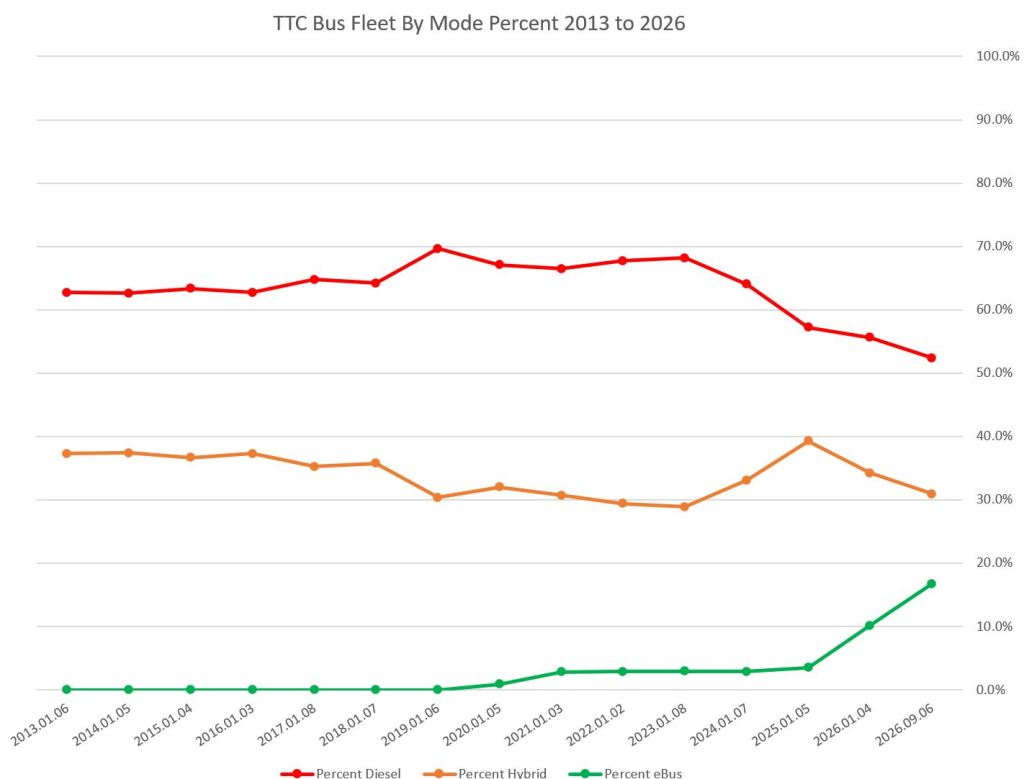
The fleet contained different vehicle types over the years as the TTC moved to “green” its technology. These charts show the numbers (left) and proportion (right) of buses by motive power: diesel (red), hybrid (yellow/orange) and battery electric (green). The jump in diesels in 2019 was due to the TTC backing off from hybrids after reliability problems with early models.
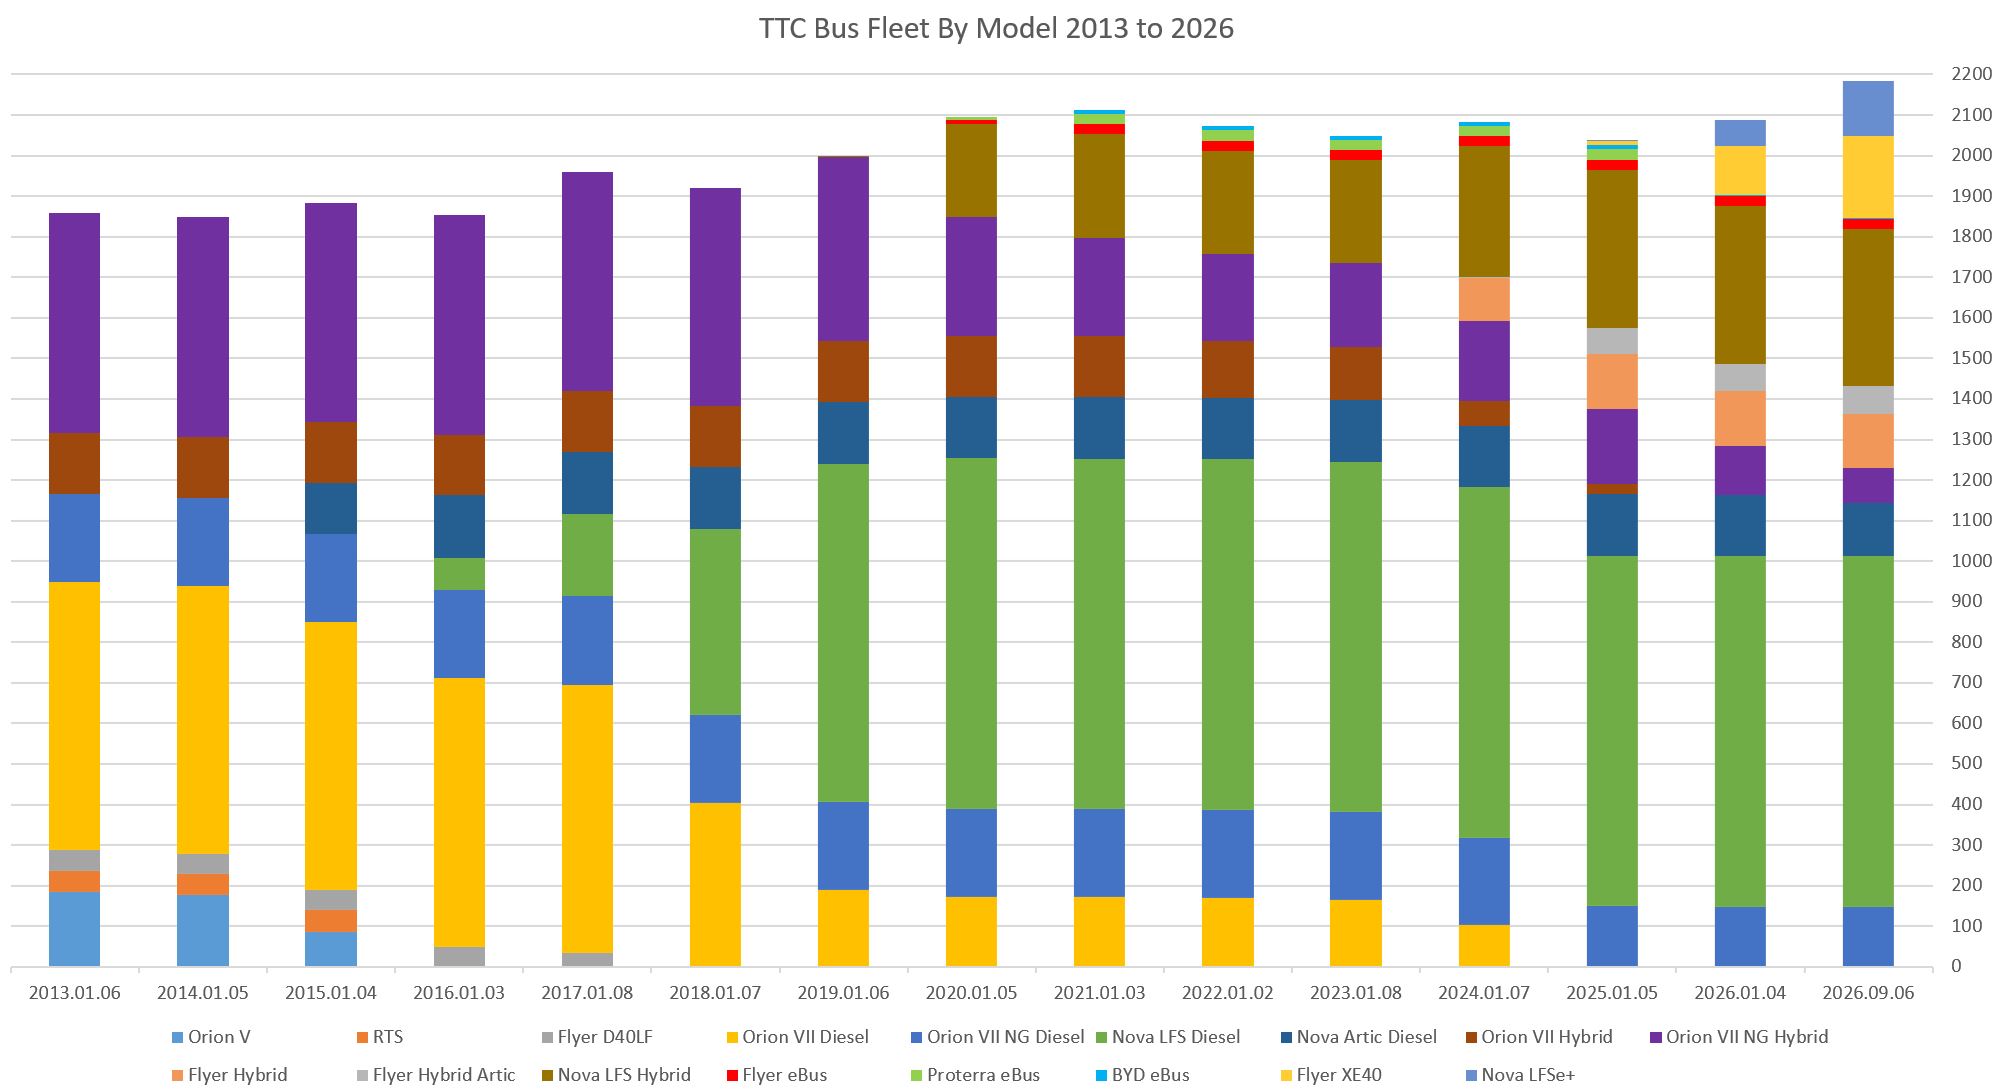
For those who want the gory details of bus models, the chart below breaks down the numbers. The large green block is a fleet of Nova diesel buses that will be due for replacement in roughly 2030. Funding for this replacement, let alone a technology selection, is still uncertain.
Streetcar Fleet Size, Composition and Utilization
Since 2015, the TTC changed from a fleet of CLRVs (Canadian Light Rail Vehicles), ALRVs (Articulated Light Rail Vehicles) to a new fleet of Bombardier, now Alstom, Flexity cars. These cars have different sizes (15m, 23m and 30m respectively) and capacities, and so service levels cannot just be estimated based on vehicle counts, but also line capacity. Full conversion to Flexity operation occurred in 2020. Today’s fleet is only slightly larger by vehicle count, but has substantially more capacity in anticipation both of service improvements and the as-yet unbuilt Waterfront East line.
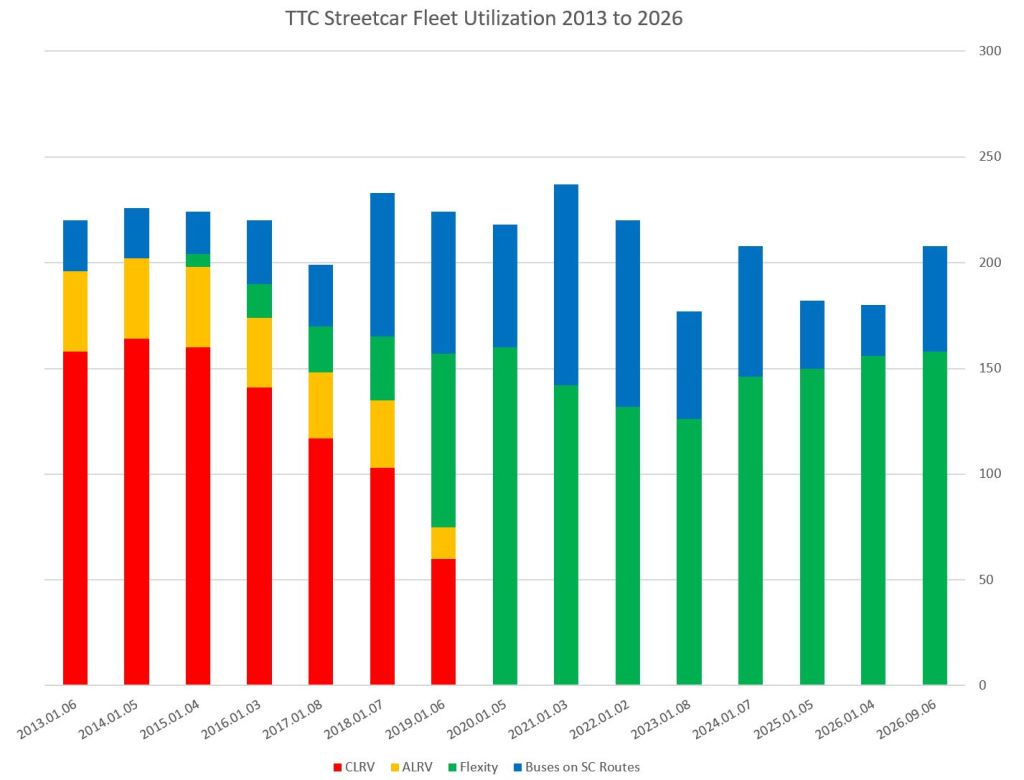
A parallel development has been the increased use of buses on streetcar lines to accommodate construction projects. During the pandemic era with demand below normal, changing the mode was seen as a way to get major projects out of the way. However, the TTC has settled into a common level of 150-160 peak Flexitys in spite of owning 264 cars. That’s a spare factor of about 65%, vastly above the industry average for transit vehicles. The fleet grew, but the utilization has not.
Six Minute Service
Given the large number of spare streetcars, the question is whether the TTC could implement a “six minute network” across the streetcar system. The table below shows the status of each route’s PM peak requirement scaled up to a 6′ headway where service is not yet that frequent. There is no adjustment for reduced travel times through schedule adjustments. (The car allocations and headways are based on streetcar operation without diversions.)
A total service of 209 cars would require 42 spares at 20% for a total of 251. This can be handled by the 264 car fleet with room to spare.
One could argue that some of these routes might be the last to get 6′ service given their overlap with other services (e.g. 503 Kingston Road and 509 Harbourfront), and the total needed could be lower. This gives headroom for improvements to the system generally where better than a new 6′ policy headway is needed.
| Route | Existing Service | Existing Cars | Extra Cars for 6′ Service |
|---|---|---|---|
| 501 Queen | 10′ | 23 | 15 |
| 503 Kingston Road | 10′ | 12 | 8 |
| 504 King | 4′ | 27 | |
| 505 Dundas | 6′ | 25 | |
| 506 Carlton | 10′ | 19 | 13 |
| 507 Long Branch | 10′ | 8 | 5 |
| 508 Lake Shore | 20′ | 5 | |
| 509 Harbourfront | 9’30” | 6 | 4 |
| 510 Spadina | 6′ | 12 | |
| 511 Bathurst | 6′ | 13 | |
| 512 St. Clair | 6′ | 14 | |
| Total | 164 | 45 |
Slow Orders
There are slow orders across the streetcar system at intersections and underpasses arising from the compound effect of various factors:
- unreliable switch controllers that could change a switch’s position under a car,
- track conditions that require slow operation for safety,
- overhead conditions that preclude faster operation.
The third point was a particular problem for trolley poles in low underpasses, but trolley poles are no longer used. The slow orders remain, however.

