
Recently, the CBC published an article about the changing nature of subway delays flagging the increase in “disruptive patron” incidents since pre-pandemic 2018 and today.
The TTC’s delay logs from 2014 onward are available on the City of Toronto’s Open Data site. The logs for almost 13 years hold a vast amount of detail (over 268,000 individual entries just for rapid transit lines), and one can easily get lost in the mass of data trying to sort out the useful info. The available data for each delay includes:
- Date and time
- Station or location
- Delay code
- Minutes of delay
- Minutes of resulting gap
- Direction
- Line
- Vehicle, if applicable
This article looks at the data at increasing levels of detail to examine the evolution of types of delay over the years. An important point here is that delays due to slow orders are not included as these are not single events such as a train held for a jammed door or an ill passenger.
There is also no estimate of the scope of a delay’s effect on riders in the sense of how many trains are held up, for how long and how many passengers were on board or waiting. In the worst cases, the effect extends beyond the immediate area thanks to service suspensions and the tedious process of running shuttle buses.
Delay codes are quite detailed and are broken into major groups such as equipment issues, infrastructure, security, transportation (operating staff) and passenger-related issues. In the charts presented here, these codes are translated to their “plain language” text.
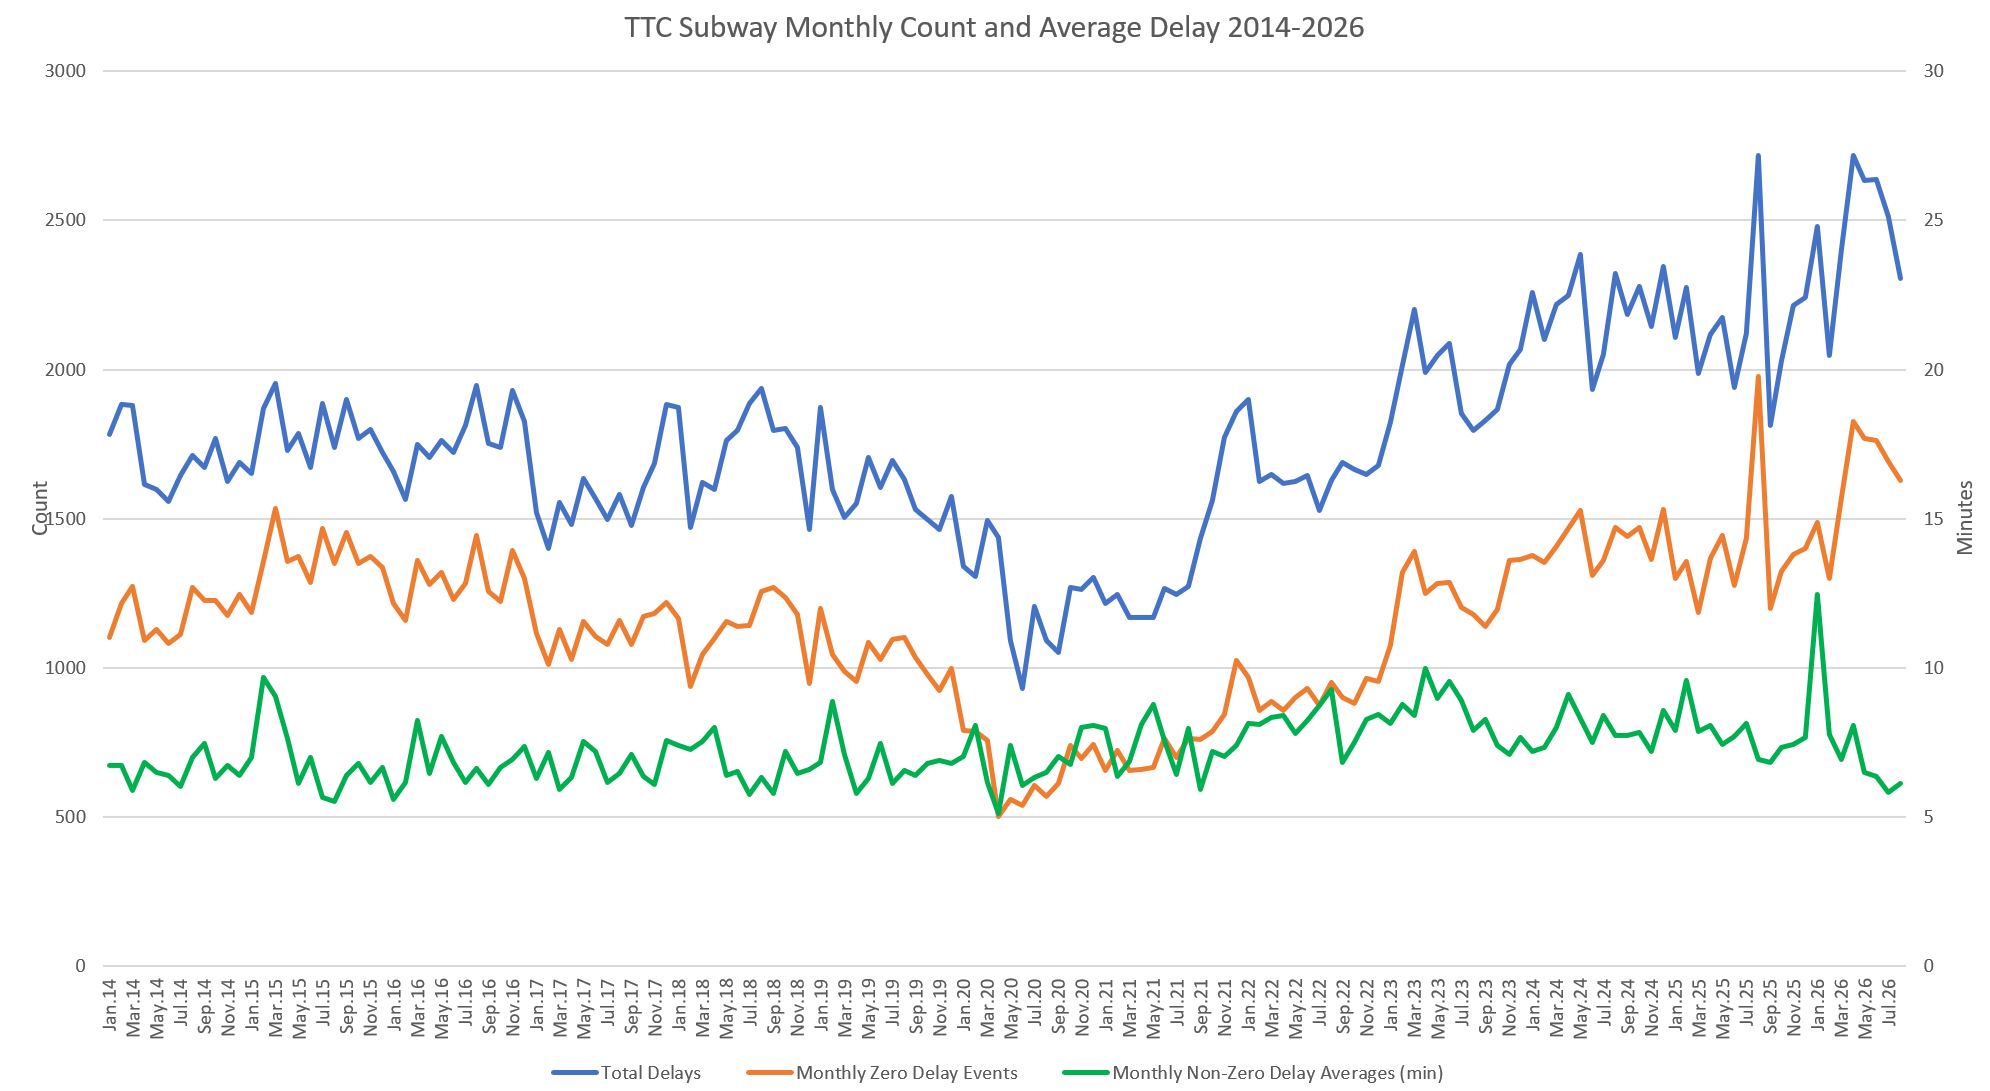
At the most simplistic level, there has been an evolution in the number and length of delays. The chart below shows the monthly count of all delay logs (blue) and the associated average service delay (green). An important point here is that many logs show incidents where there is no delay (orange), and so the average in the chart below is only for cases where service was held.
The number of incidents fell in the early period of the pandemic, but recovered to historic levels in 2022 and has climbed since. Conversely, the length of an average delay has only risen slightly in the 2020s.
There might be more delays, but what is causing them, and how has this changed over time. Although passenger-related issues have grown and crowd out other problems by their number, there is a pattern of growth in delays related to equipment (trains), signals and infrastructure in recent years. This has implications for overall TTC maintenance practices and budgets.
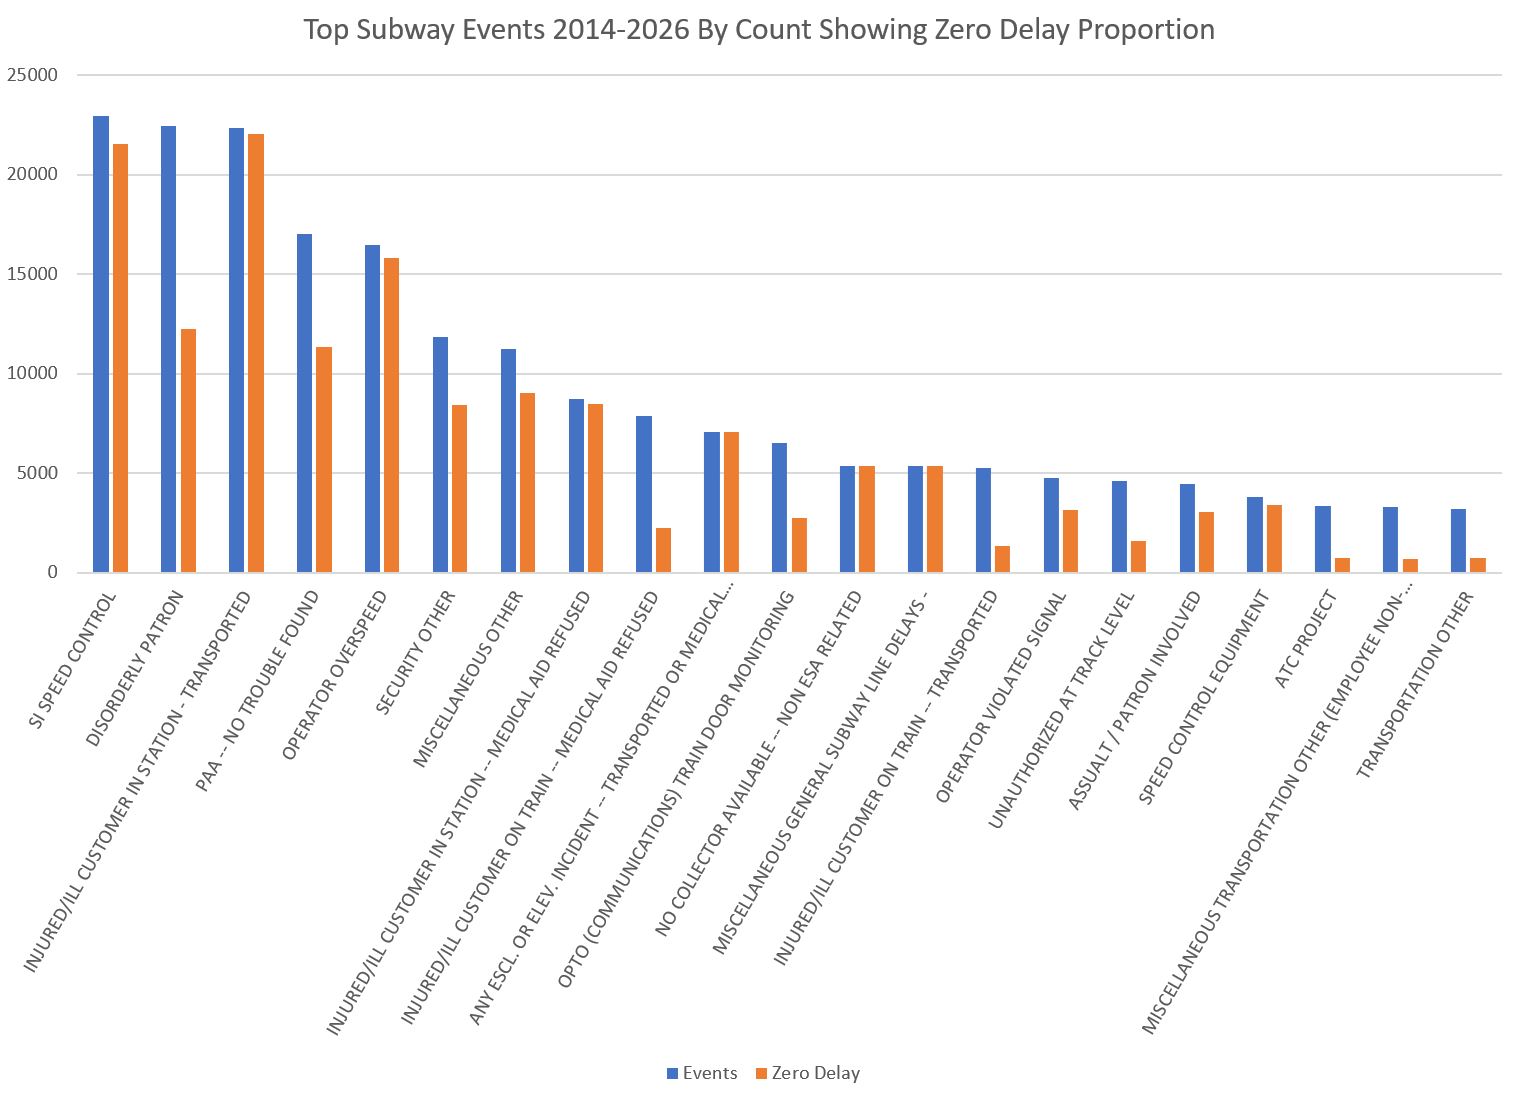
The chart below shows the proportion of the most common events that did not actually cause a delay. The high-roller over the period is Speed Control issues which show up under two separate codes. However, as we will see later, that problem disappeared in the early 2020s, but was replaced by “Disorderly Patron” and “Injured/Ill Customer in Station”. Note that the first of these entailed many delays, while the second did not because the events were not on board trains.
The remainder of this article takes a deeper dive into the delay logs with breakdowns by general class of delay and a review of individual lines where differences in equipment and signalling show up in contrasting delay stats.
Continue reading
