Recently, the CBC published an article about the changing nature of subway delays flagging the increase in “disruptive patron” incidents since pre-pandemic 2018 and today.
The TTC’s delay logs from 2014 onward are available on the City of Toronto’s Open Data site. The logs for almost 13 years hold a vast amount of detail (over 268,000 individual entries just for rapid transit lines), and one can easily get lost in the mass of data trying to sort out the useful info. The available data for each delay includes:
- Date and time
- Station or location
- Delay code
- Minutes of delay
- Minutes of resulting gap
- Direction
- Line
- Vehicle, if applicable
This article looks at the data at increasing levels of detail to examine the evolution of types of delay over the years. An important point here is that delays due to slow orders are not included as these are not single events such as a train held for a jammed door or an ill passenger.
There is also no estimate of the scope of a delay’s effect on riders in the sense of how many trains are held up, for how long and how many passengers were on board or waiting. In the worst cases, the effect extends beyond the immediate area thanks to service suspensions and the tedious process of running shuttle buses.
Delay codes are quite detailed and are broken into major groups such as equipment issues, infrastructure, security, transportation (operating staff) and passenger-related issues. In the charts presented here, these codes are translated to their “plain language” text.
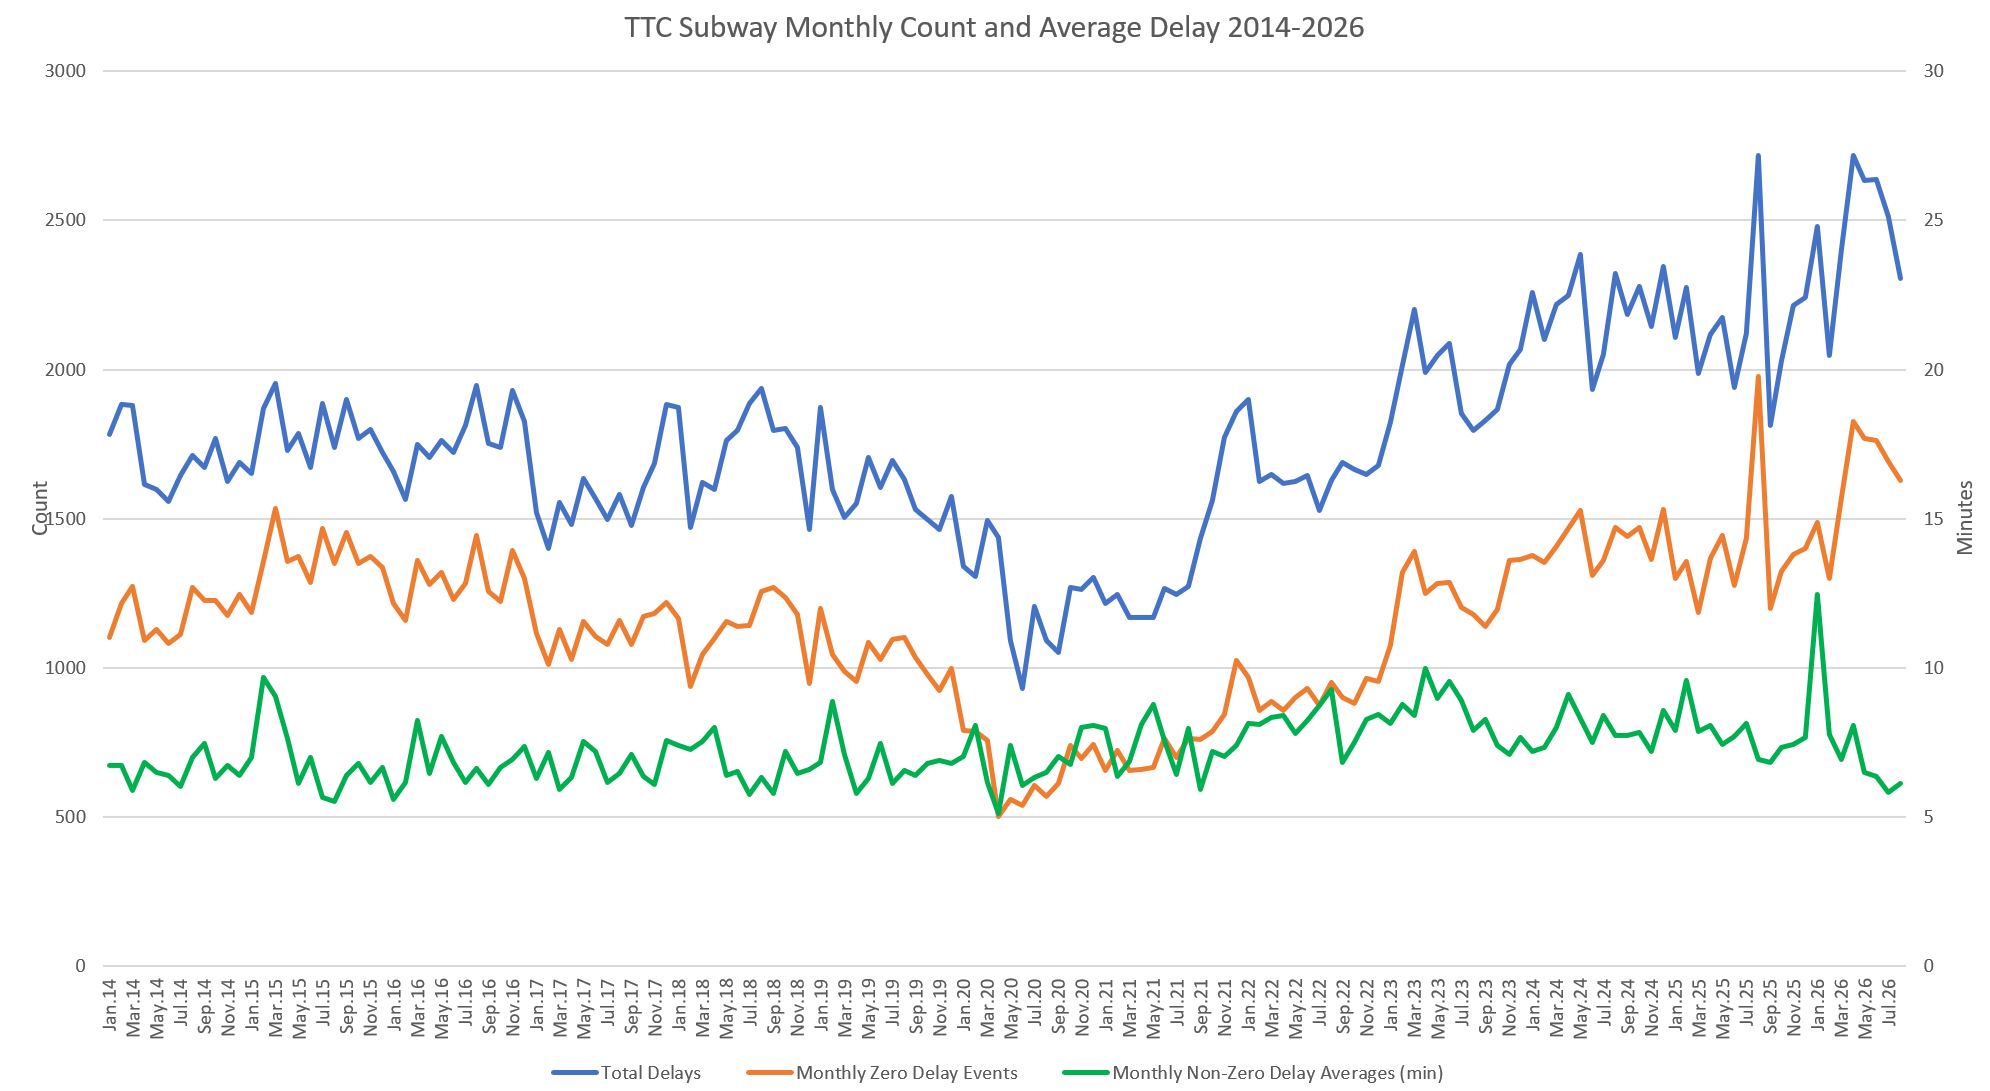
At the most simplistic level, there has been an evolution in the number and length of delays. The chart below shows the monthly count of all delay logs (blue) and the associated average service delay (green). An important point here is that many logs show incidents where there is no delay (orange), and so the average in the chart below is only for cases where service was held.
The number of incidents fell in the early period of the pandemic, but recovered to historic levels in 2022 and has climbed since. Conversely, the length of an average delay has only risen slightly in the 2020s.
There might be more delays, but what is causing them, and how has this changed over time. Although passenger-related issues have grown and crowd out other problems by their number, there is a pattern of growth in delays related to equipment (trains), signals and infrastructure in recent years. This has implications for overall TTC maintenance practices and budgets.
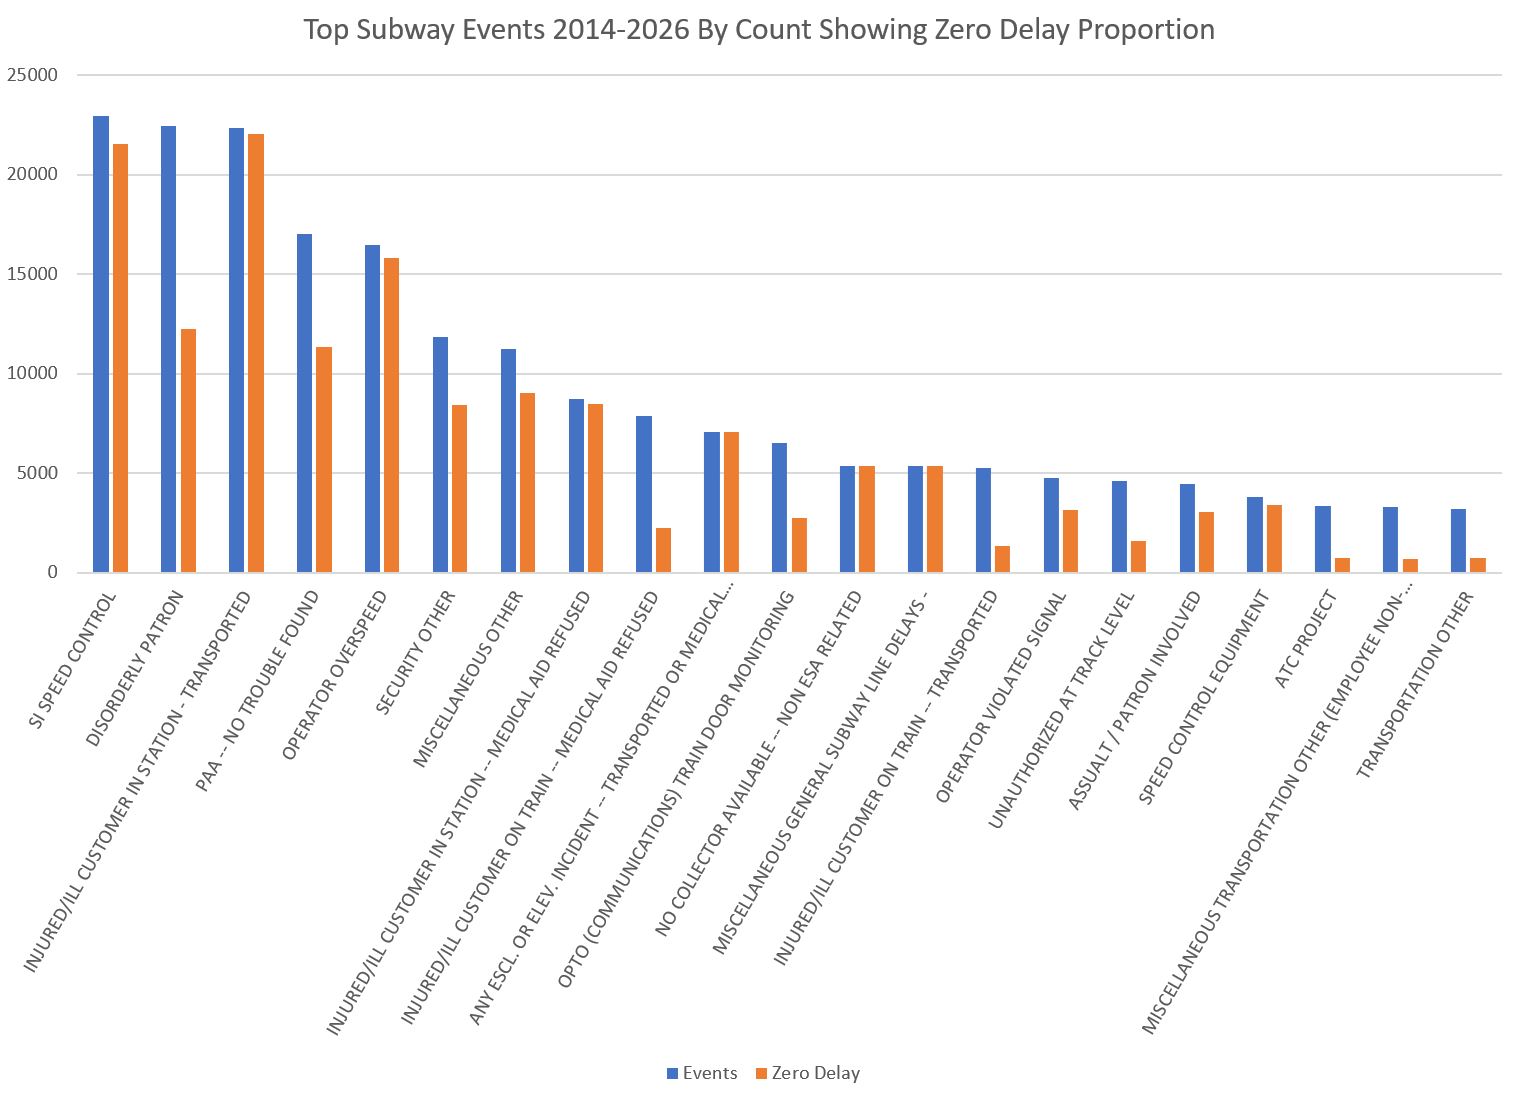
The chart below shows the proportion of the most common events that did not actually cause a delay. The high-roller over the period is Speed Control issues which show up under two separate codes. However, as we will see later, that problem disappeared in the early 2020s, but was replaced by “Disorderly Patron” and “Injured/Ill Customer in Station”. Note that the first of these entailed many delays, while the second did not because the events were not on board trains.
The remainder of this article takes a deeper dive into the delay logs with breakdowns by general class of delay and a review of individual lines where differences in equipment and signalling show up in contrasting delay stats.
The Challenge of Raw Data
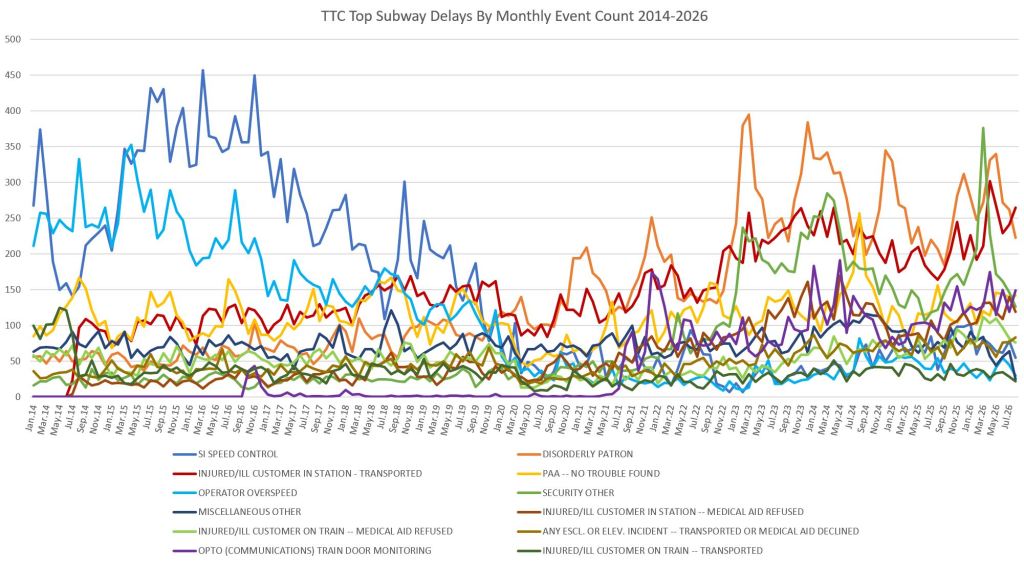
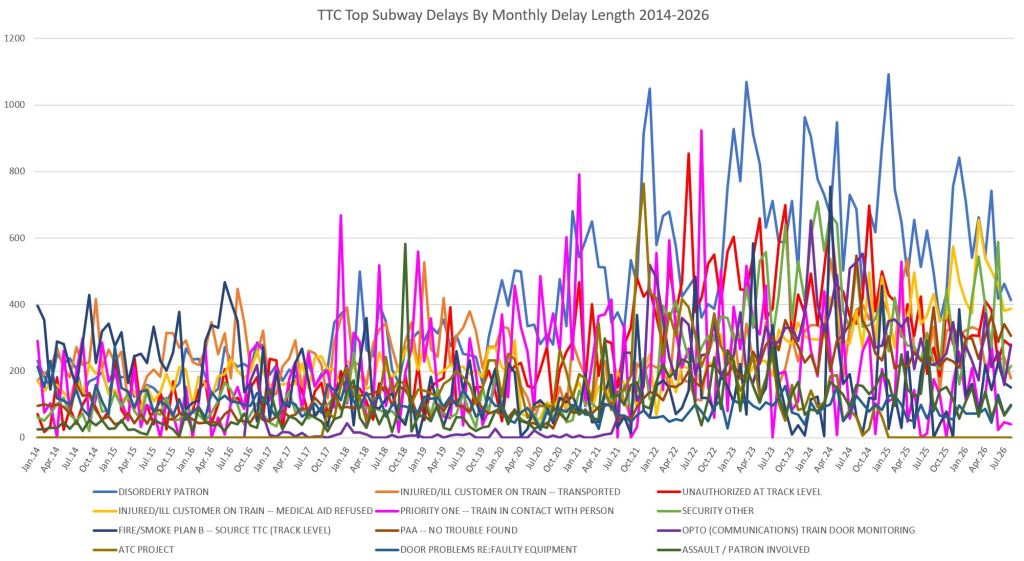
It is tempting to simply plot the major delay types over time hoping to see what is going on, but at first cut that produces an almost unreadable chart. These are included here to show the starting point for a more detailed review. There is a long list of delay codes for subway events broadly subdivided into equipment, infrastructure, passenger, transportation (operators and collectors) and security, with a separate, but similar, list for the SRT.
This presents a “can’t see the forest for the trees” situation where it is necessary to look for major groups of issues and their behaviour over time.
The top chart below shows the top 12 events by count over the period, while the bottom chart shows the total delay time for the same interval. Note that the event types are not the same in each chart because a very common event might produce little delay, while a rare event can have a huge effect.
As a general observation, problems with the Speed Control system (blue and turquoise lines in the top chart below) were a big issue by count from 2014, but declined very substantially by 2020. Conversely, the counts for Disorderly Patron (orange), Injured/Ill Customer in Station (red) and Injured/Ill customer on Train (light green) all grew from 2020 onward.
In the lower chart, not much is immediately evident except that the total of delay time rose from 2020 onward with “Disorderly Patron” responsible for the greatest amount of delay.
Yes, I know these charts are messy, and they are intended to show how the details can overlap and obscure what is going on. Please don’t leave comments kvetching about them. In following sections, data are presented broken down by general class of incident (e.g. passenger, equipment) and by line to bring out more detail.
Passenger and Security Related Events
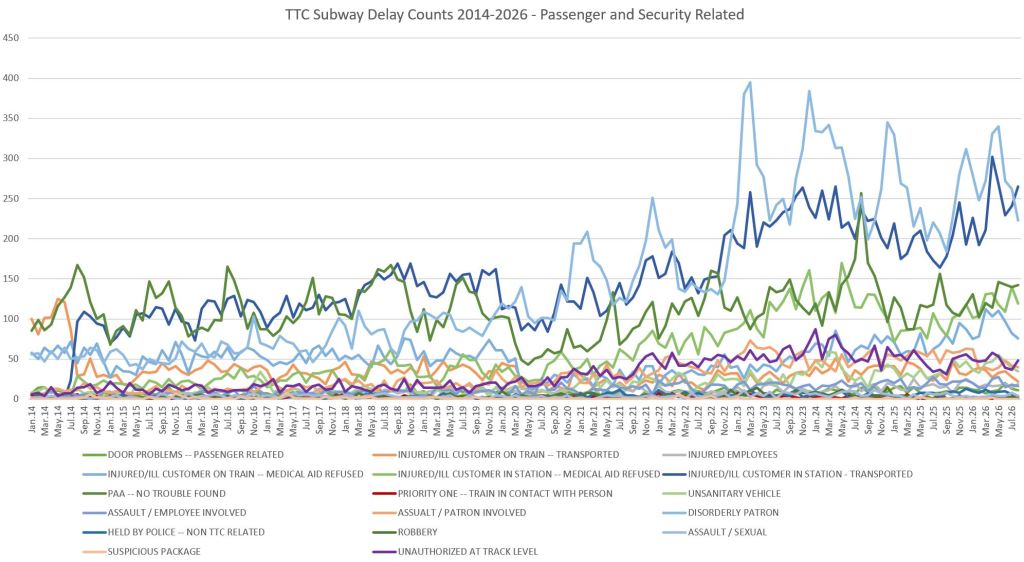
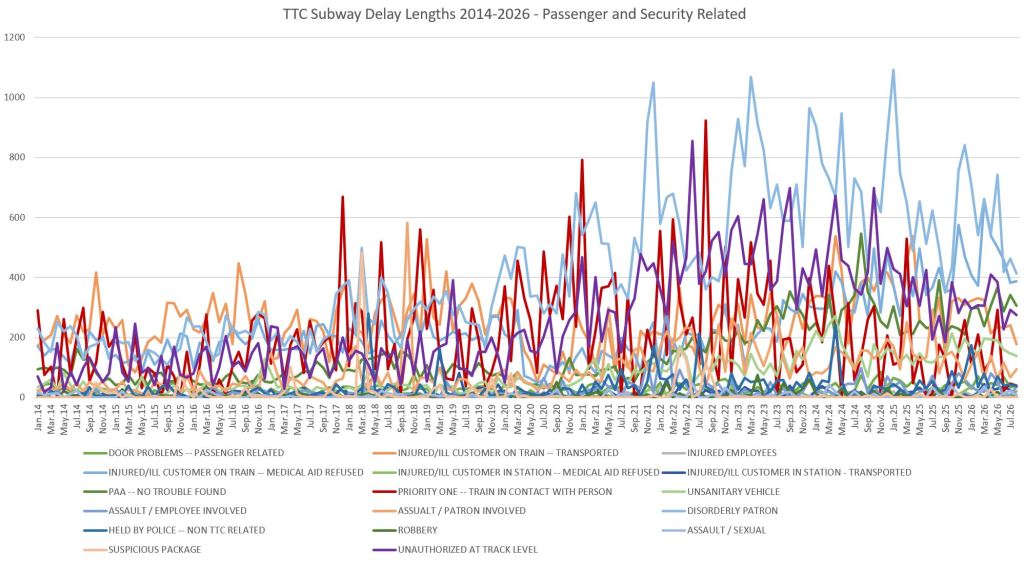
About 50 event codes deal with a variety of situations that broadly could be considered as passenger or security related, rather than originating with train service. The charts below show the count and cumulative length of each type from this set of codes. The change in number of events from 2020 onward is quite clear.
- “Disorderly Patron” (light blue) tops out the chart in recent years, closely followed by
- “Injured/Ill Customer in Station / Transported” (dark blue).
- “PAA – No Trouble Found” (dark green) shows that passenger assistance false alarms have been an issue over the entire period at a steady rate.
- “Injured/Ill Customer in Station / Medical Aid Refused” (light green) sits in fourth place.
- Two types of event are of particular interest in the debate about platform doors. I will review the data for these two delay types in more detail later in the article.
- “Priority One” events (red) involve trains hitting people. Numerically, they are few compared to other types of delay, but they take a long time to resolve.The line is almost invisible on the chart by event counts, but much more prominent in length of delays.
- “Unauthorized at Track Level” (purple) are common enough, particularly in recent years, to climb out of the cluster of infrequent events at the bottom of the top chart, but the length of resulting delays is much higher, particularly since about 2021.
There are seasonal peaks in the Disorderly Patron stats in the month of December in each year from 2020 to 2025.
(Note that these counts do not include SRT events which are filed under a separate set of codes. I will turn to the SRT later in this article.)
Track Level Intrusions
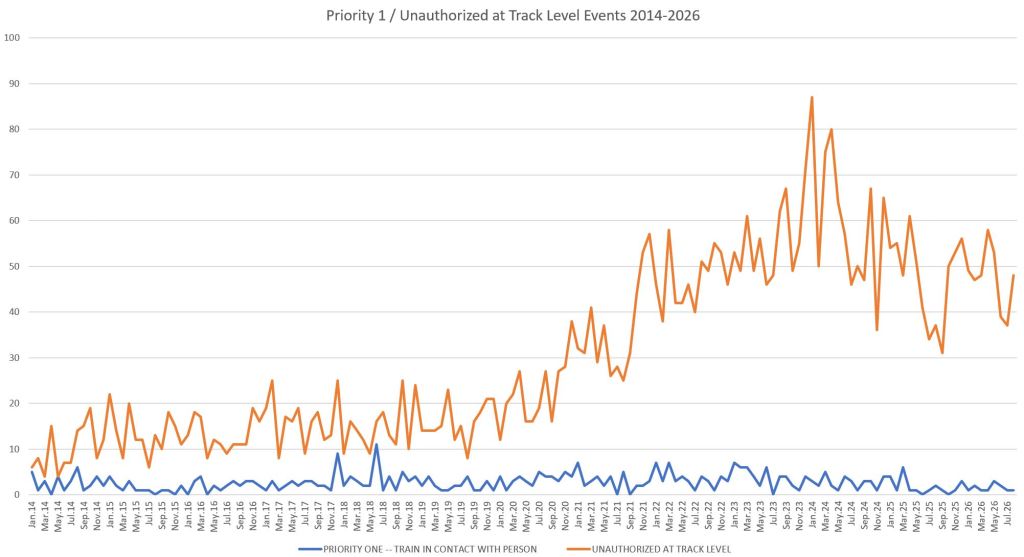
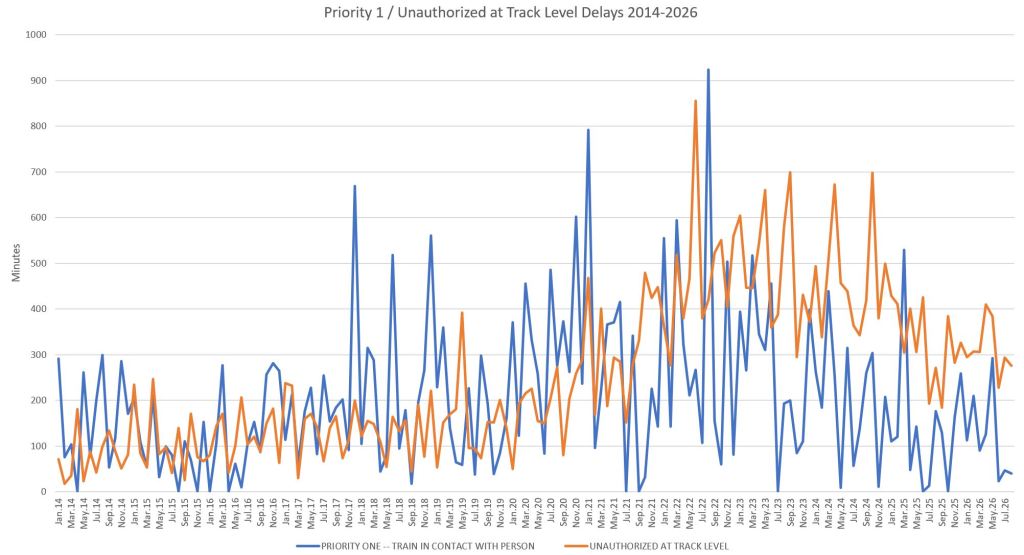
A great deal of debate currently focuses on the installation of Platform Edge Doors (PEDs) to reduce or eliminate events caused by passengers or objects on the track. The two common delay types are “Priority One” (train strikes a passenger) and “Unauthorized Person at Track Level. The next charts show the counts and resulting delay times from these events.
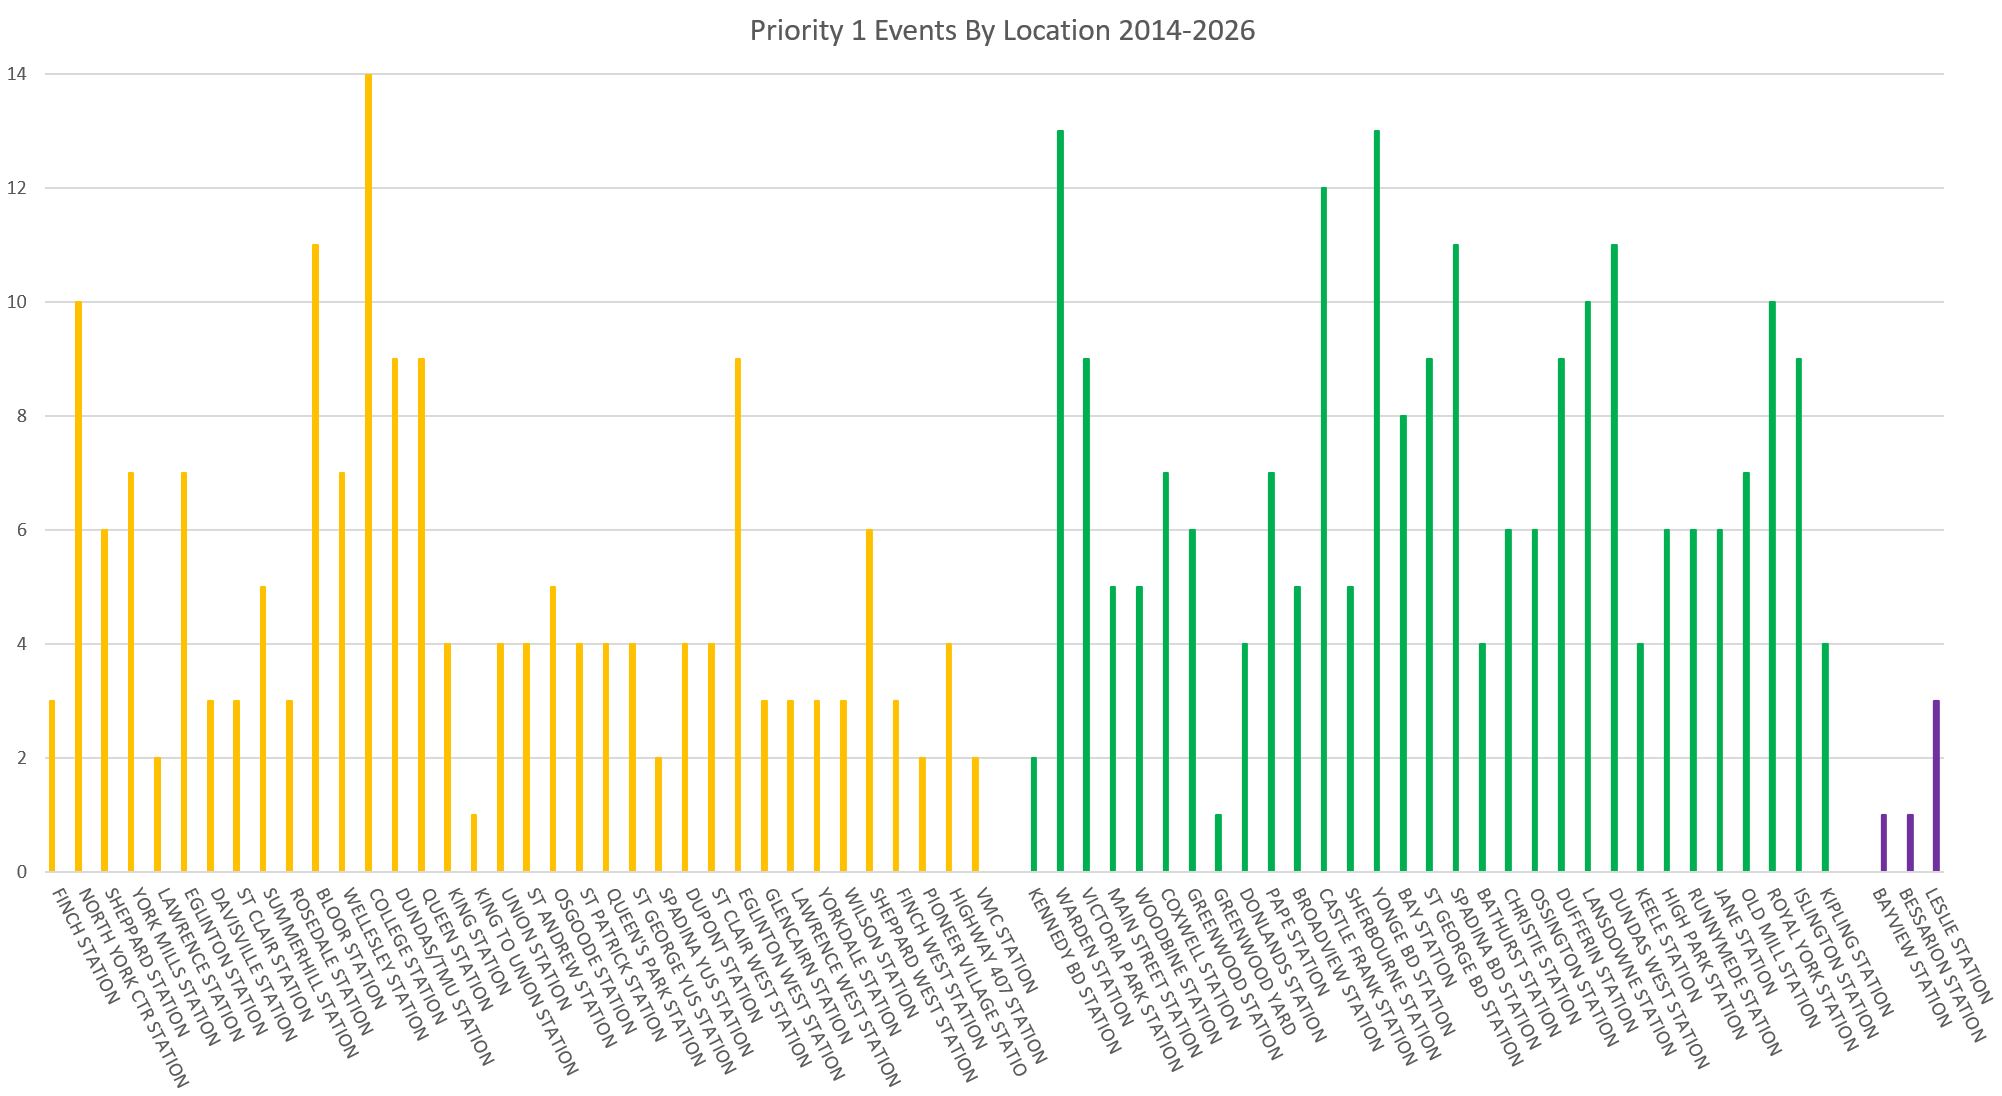
The number of Priority 1’s (blue) has stayed fairly constant over time with a total of 402 events. The length of resulting delays, however, has grown starting in 2017, and fell again in recent years.
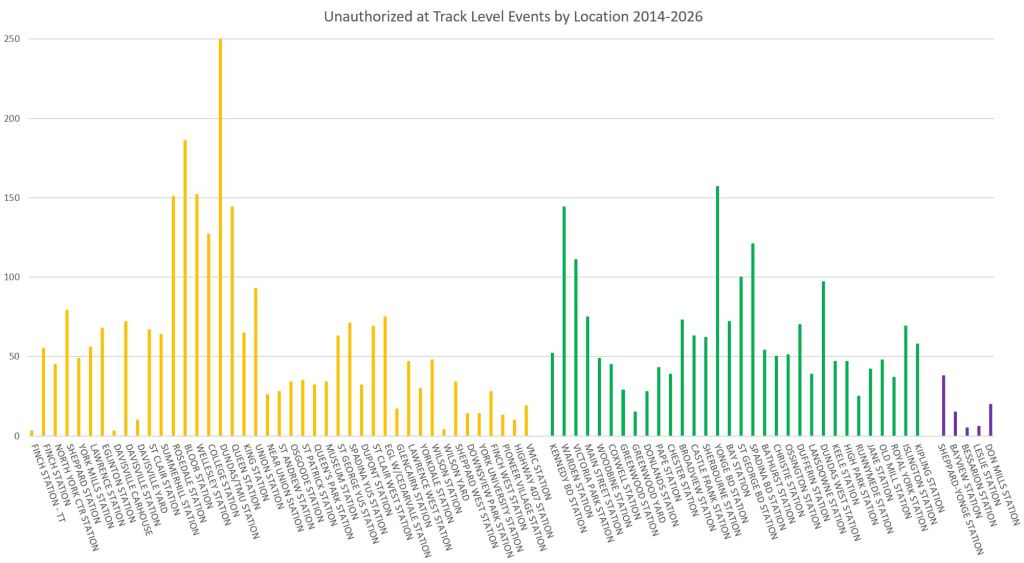
Unauthorized at Track Level (orange) events remained fairly steady until 2020, but grew to a peak in 2024 before declining somewhat to 2026.
The distribution of Priority 1 events across the system is not concentrated at only a few locations. If a major intent of PED installation is to prevent these (or even at the most common locations), barriers in a few stations will not achieve the goal. (In the charts below, the few stations with no events are omitted.)
The distribution of Unauthorized at Track Level events is more concentrated in certain areas, but well beyond the point where PEDs at a few stations are going to make a big difference overall. (A small number of events are logged at points between stations. These have been consolidated into station counts to concentrate on points of entry.)
Debris and Fires
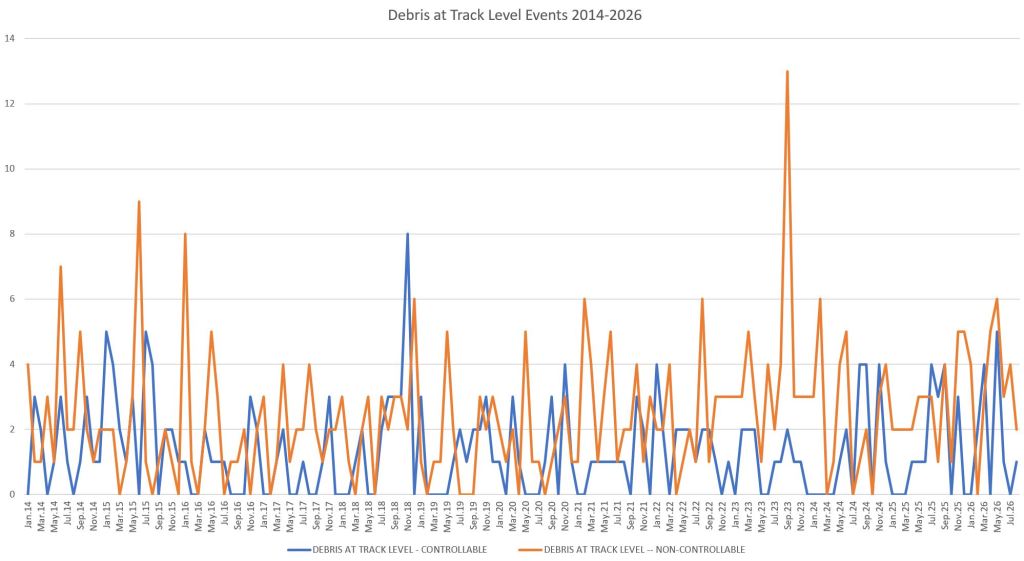
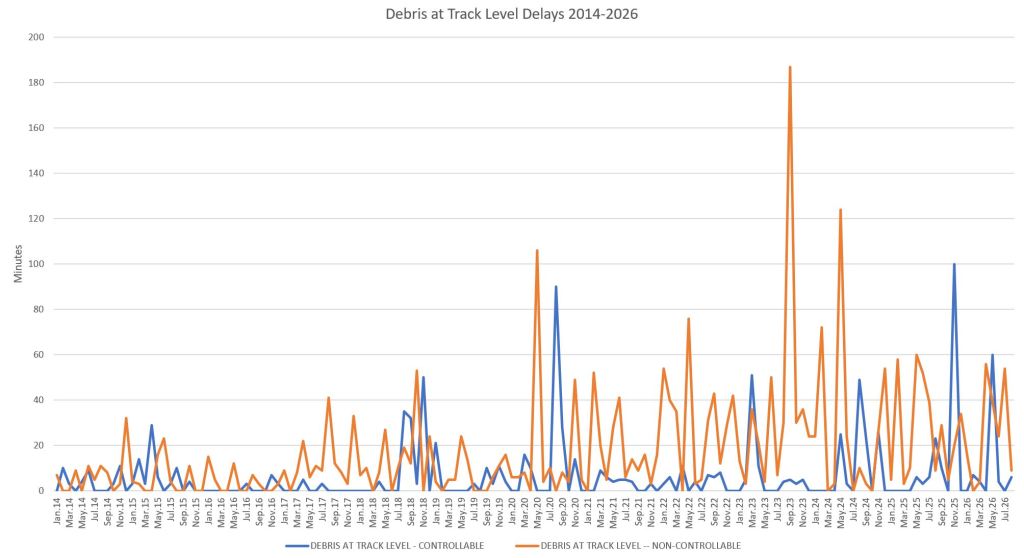
The TTC reports delays due to debris on the track as “controllable” and “non-controllable”, although the exact distinction is unclear. Although these delays have been cited as one of the reasons for PEDs, “debris” is not necessarily something like a discarded item blown onto the tracks at a station. It can also include tree falls in the open cut areas, and on rare occasions material falling from tunnel walls or liners. There is no distinction in the stats between the types of event or what proportion of them would be eliminated with PEDs.
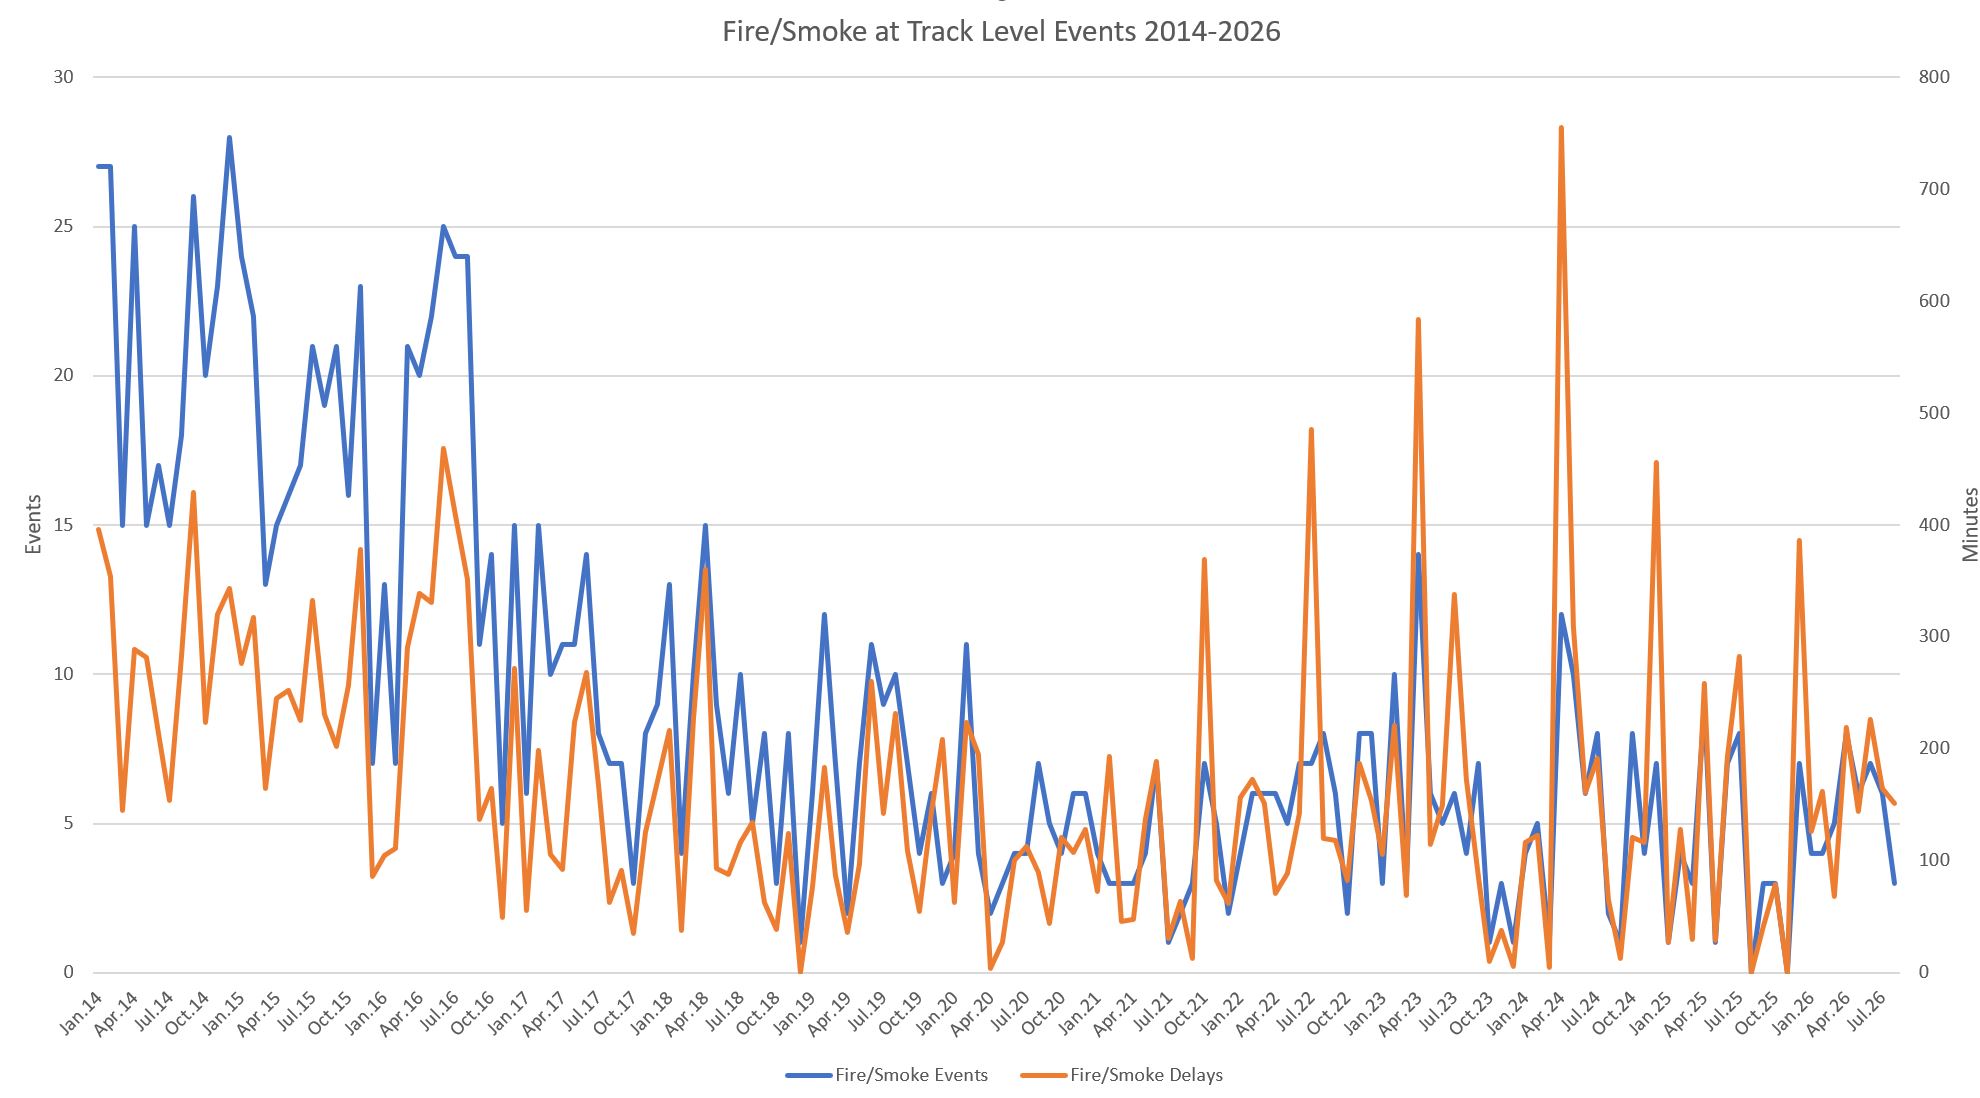
The most common code for fire and smoke is a “Plan B” for events at track level. As with debris issues, these are not all caused by items getting onto the track from passenger areas. Other causes include aging power cabling and dirt buildup on the power rail supports. There is no description of the exact cause of these events.
There is a marked decline in events from 2014 to 2017. At the time, there was a concern with workers leaving materials in tunnels between overnight shifts. Exactly how these came to cause fire events was never explained, but there was a push to end this practice as the stats clearly show. However, “Plan B” events still occur albeit at a lower rate.
Line 1 YUS vs Line 2 BD Equipment Delays
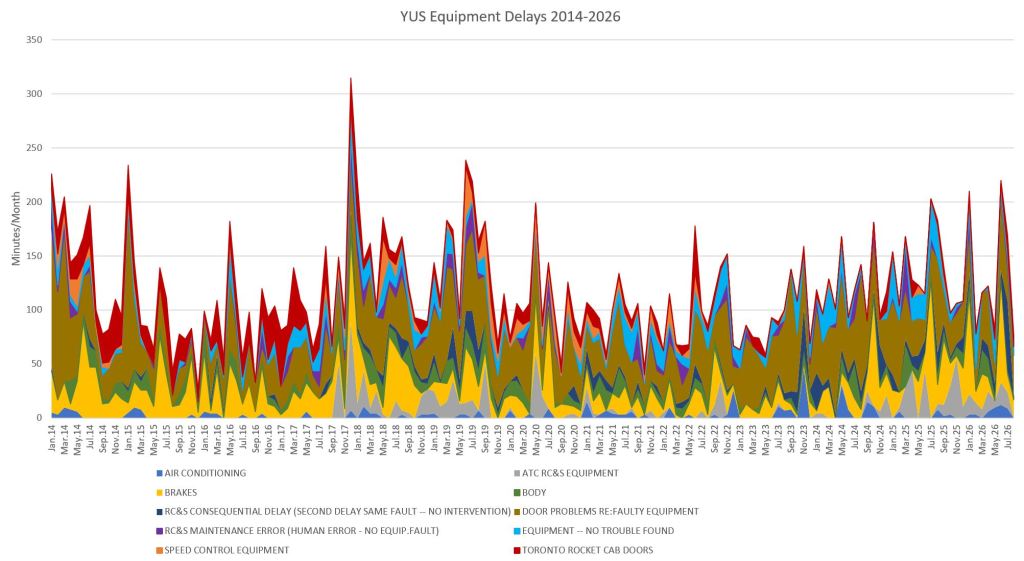
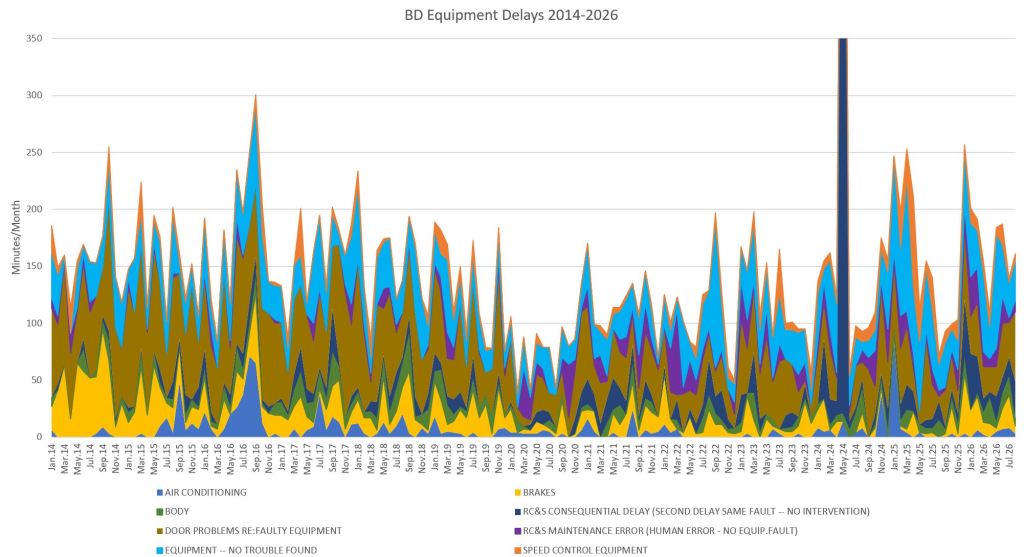
Lines 1 and 2 have different fleets and, since the introduction of Automatic Train Control on Line 1, different signal systems. Line 1 runs with Toronto Rockets (TRs) while Line 2 uses T-1s. I have broken stats for these two lines out into separate charts to see where they differ, if at all.
For Line 1, a considerable portion of the delay time was caused by:
- Brake problems (yellow)
- Door problems (light brown)
- Cab doors on the Toronto Rocket trains used on Line 1 (red). This problem has been wrestled under control over the years.
- No trouble found (turquoise). It is not clear whether these events are due to a train reporting that it does not “feel well” or an operator calling in a problem that cannot be traced.
For Line 2:
- Air conditioning (blue)
- Brake problems, but not to the extent of Line 1 (yellow)
- Door problems (light brown)
Of particular note are Maintenance Errors (purple) and No Trouble Found (turquoise).
Although there are variations over the 13 years, the minutes/month of major equipment-related delays is fairly constant.
In these charts, “RC&S” refers to “Rail Cars and Shops”.
Line 1 YUS vs Line 2 BD Infrastructure Delays
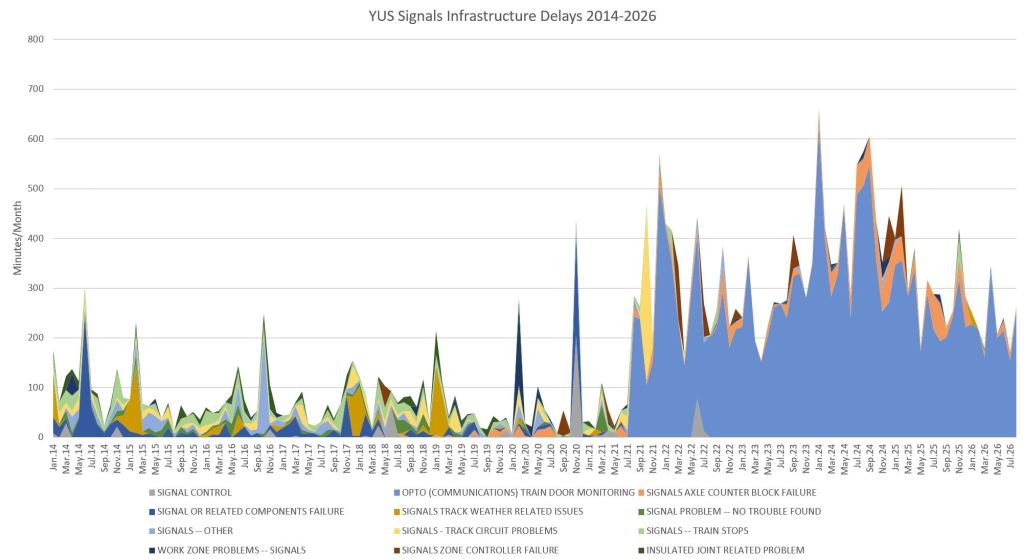
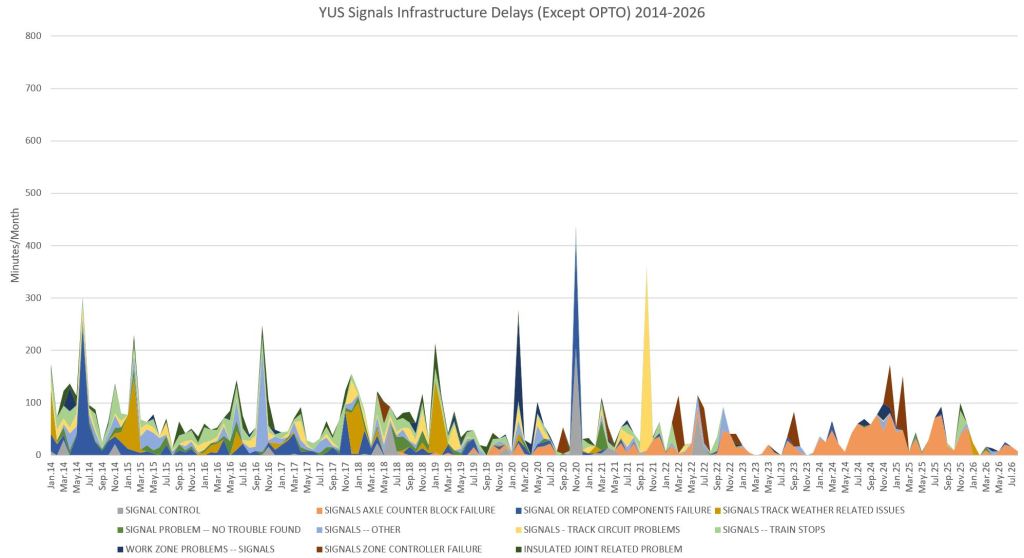
Line 1’s conversion to Automatic Train Control began in December 2017 on the Vaughan extension, with gradual extension to the rest of the line through to September 2022. A separate project saw a conversion from two-person to one-person train operation (OPTO) beginning in 2021.
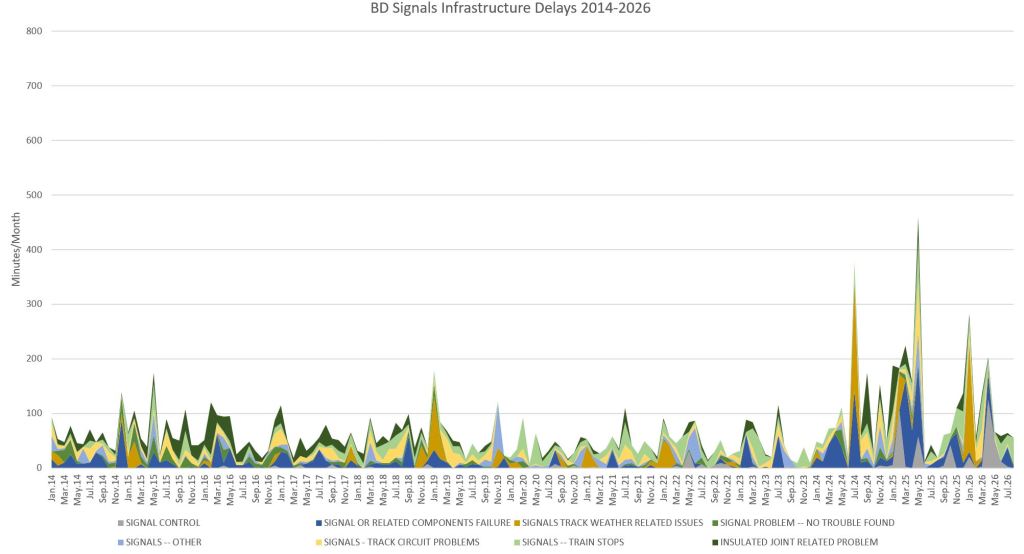
Line 2 continues to operate with conventional block signals, and will not begin conversion until the Scarborough extension opens in 2030 or so.
There is a marked difference in delay stats beginning with the rollout of OPTO where there were many delays at a level that dwarfed other events. The charts below contain minutes/month data for signals-related issues in two formats: one includes the OPTO events (blue) and the other does not.
The no-OPTO chart shows that delays due to signalling have declined somewhat in recent years, although there is a troubling growth of axle counter issues. (The ATC system counts train axles to get a fine-grained measure of a train’s location when passing through junctions.)
On Line 2, the monthly minutes of delay stay at roughly the same level until January 2024. This suggests a change in maintenance and/or inspection practices that might have contributed to a rise in failures.
Signals
Other Infrastructure
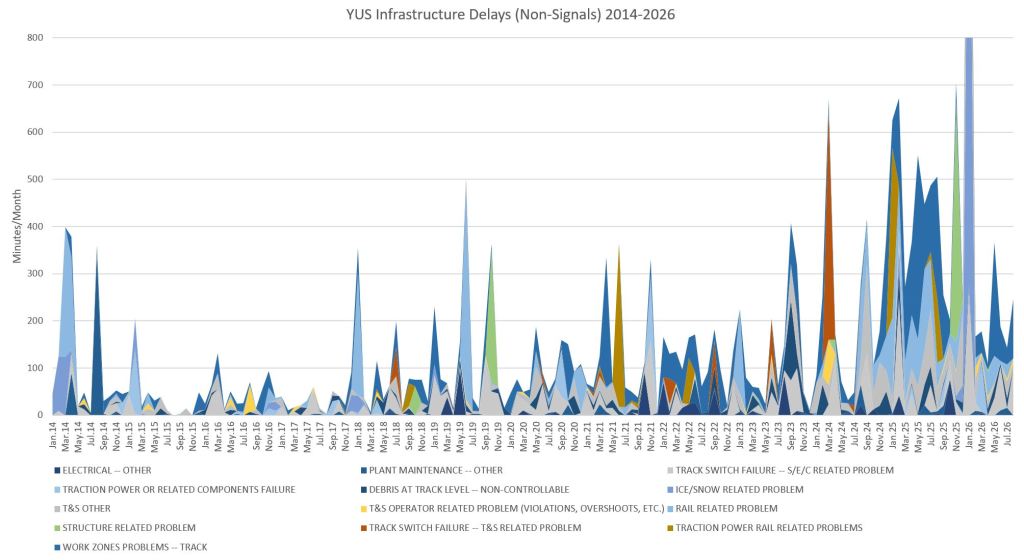
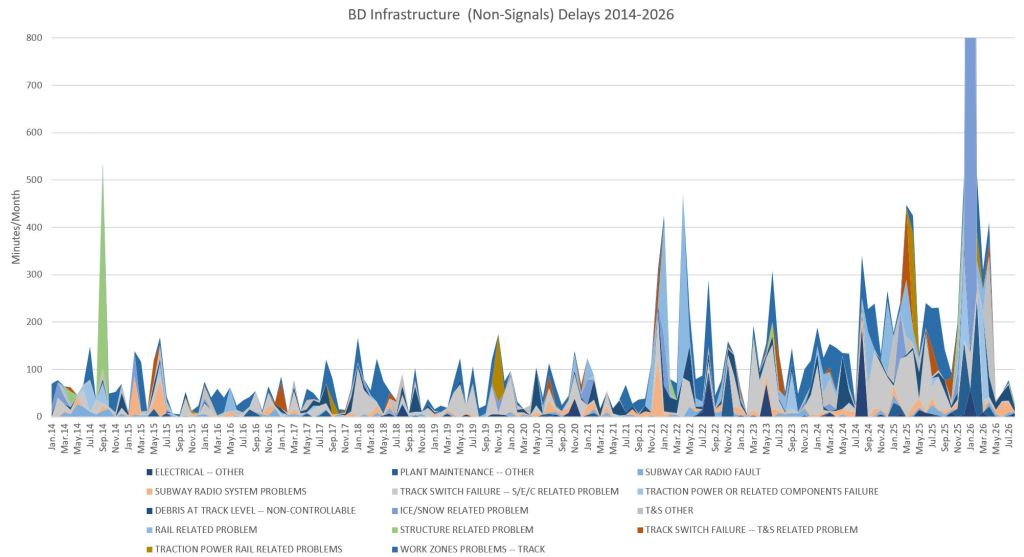
The remaining collection of infrastructure-related delay codes deal with electrical systems, track and the physical structure of the subway. There is a very noticeable decrease on Line 1 through to late 2017, and a substantial increase through to 2025. On Line 2, the change in monthly delay values starts in late 2021.
Note that these data do not include delays due to restricted speed zones where all trains run more slowly, but are not actually held by an event such as a failed switch.
In these charts, “T&S” refers to “Track and Structures”.
Line 3 SRT Delays
Although the SRT ceased operating in July 2023, the delay stats make interesting reading.
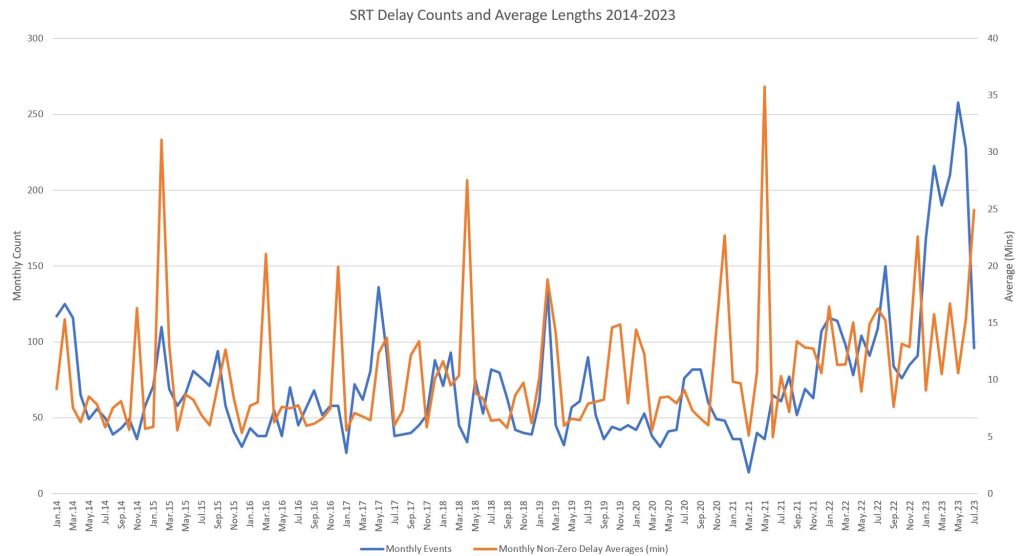
The first chart below shows the evolution of delay counts (blue) and average delay length (orange). Note the rise in both values starting in 2021.
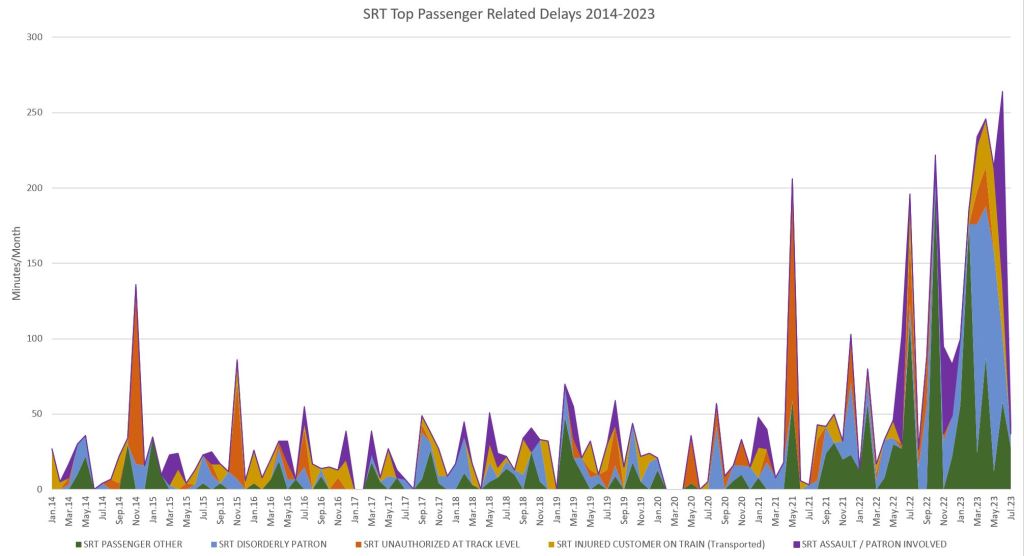
Passenger-related delay minutes grew substantially through 2021-23 notably in the categories “Other” (green) and “Disorderly Patron” (blue).
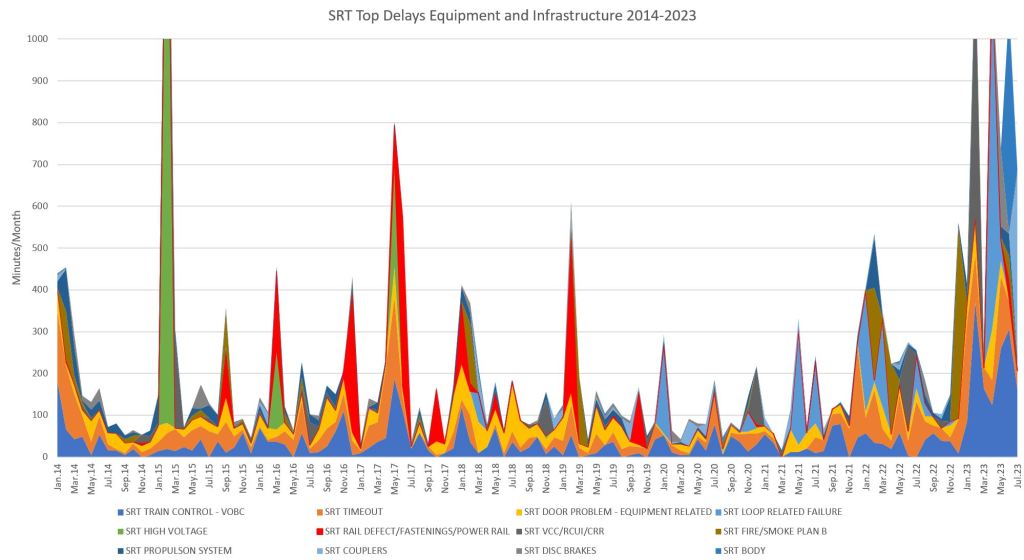
Equipment and Infrastructure delays show a growth in total minutes in 2022-23 notably in the train control subsystems. Also of interest are the Rail Defect delays which spike periodically through late 2019, but then vanish. Whether this is due to a change in inspection and detection of problems, or because the underlying cause was actually fixed, is unknown. However, the derailment that ended the SRT’s operation was a direct result of poor reaction rail inspection and maintenance.
The delay logs suggest that issues with declining maintenance standards on the SRT contributed to its lower reliability well before the final crash.
Line 4 Sheppard Delays
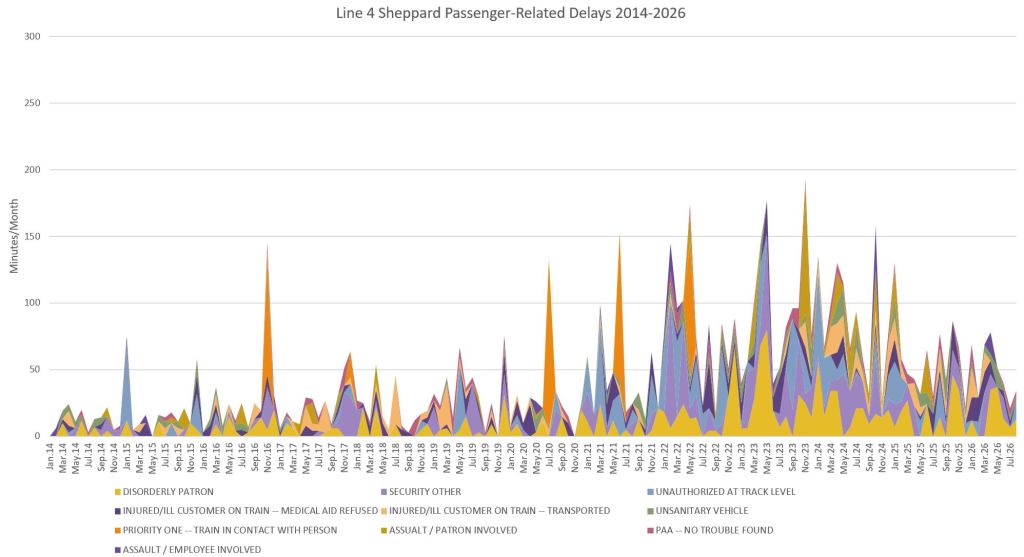
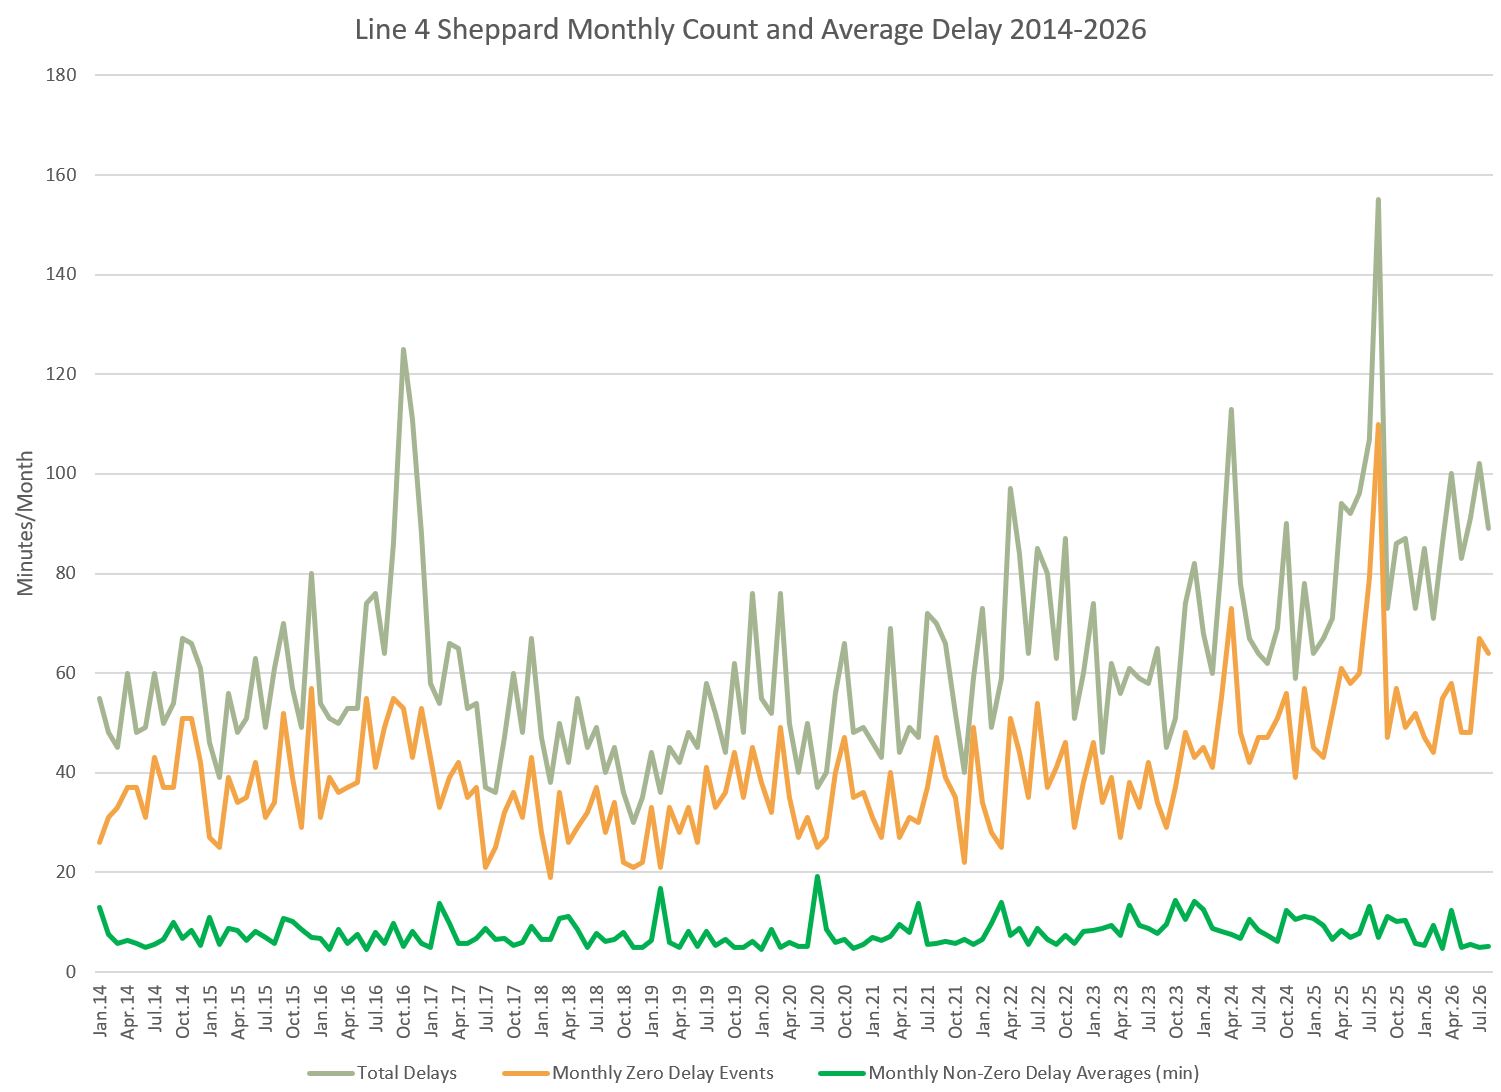
The pattern of delays on Line 4 Sheppard is similar to the system overall in that the number of events has grown since 2020, along with the number of events that caused no delay to service. The average length of delay for cases where there was any has stayed fairly static.
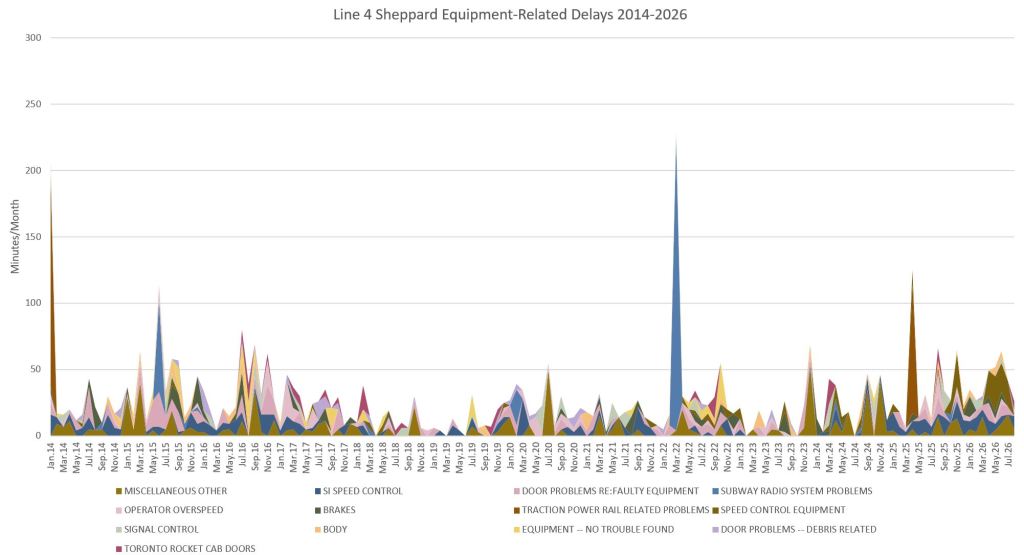
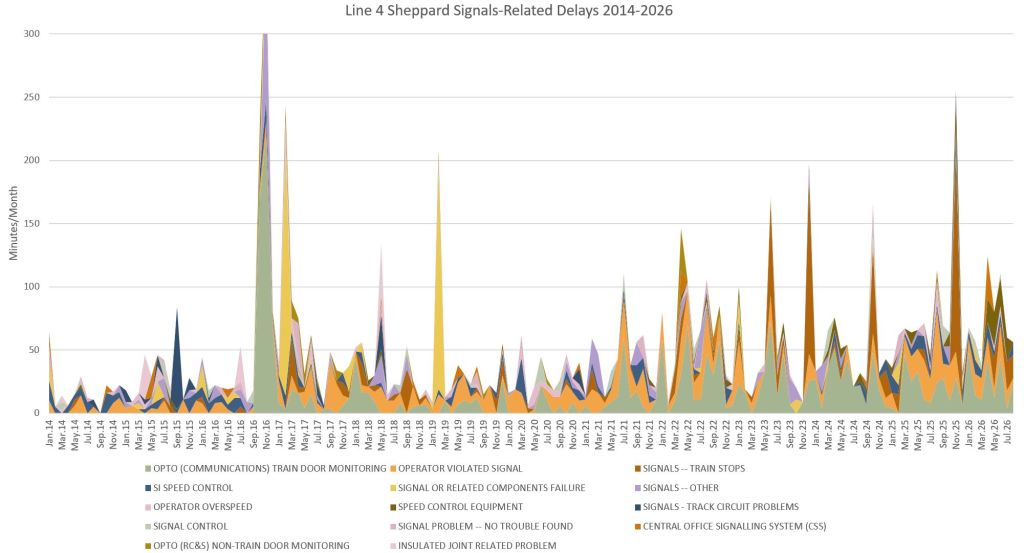
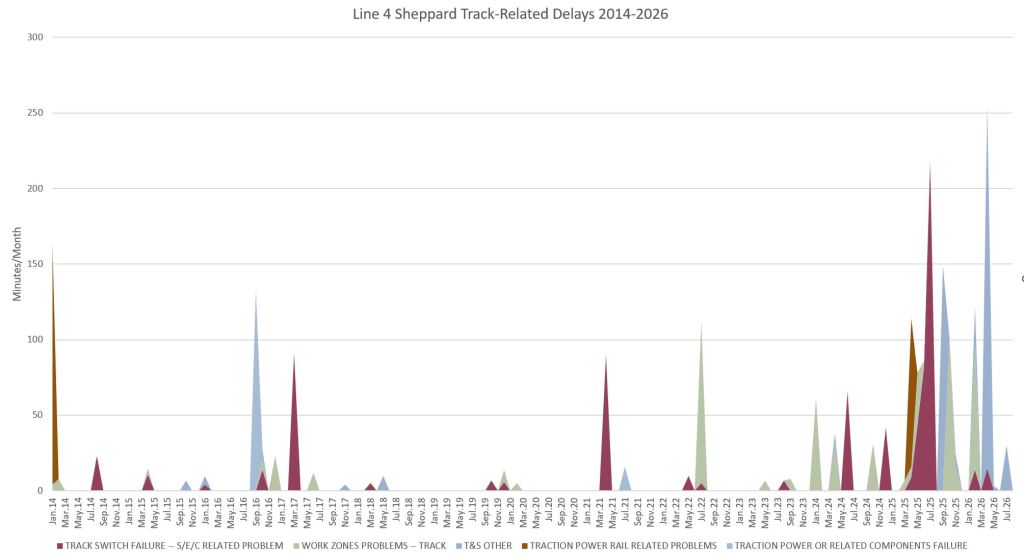
Breaking down the data for Line 4 Sheppard reveals that:
Passenger related event code rose beginning in 2020, but they have fallen back in 2025-26. “Disorderly Patron”, “Security Other” and “Unauthorized at Track Level” dominate in recent years.
There is a small increase in equipment-related delays in recent years, with spikes in “Radio System Problems” in March 2022, and “Toronto Rocket Cab Doors” in March 2025.
Line 4 trains have ATC equipment for operation over Line 1 to Davisville Carhouse, but Line 4 itself has conventional signals. There was a spike in OPTO problems when this was rolled out in Fall 2016, and that subsystem continues to contribute delays. There appears to be a gradual increase in signal-related delays in the 2020s.
Track-related delays are uncommon on Line 4, but there is a noticeable rise in delays starting in 2024.