
This article is a followup to a review of subway delay data published here in early June.
Four sets of data are summarized here:
- Bus data January 2025 through April 2026
- Streetcar data January 2025 through May 2026
- Line 6 Finch data December 2025 through May 2026
- Line 5 Eglinton data February through May 2026
There is no bus data for May 2026 because the TTC’s June 22, 2026 update on the City’s Open Data site did not include it.
The Open Data files include a key translating delay codes to text. However, many codes used in the logs do not appear in the key, and in those cases I have used “?” in the tables. I have asked TTC for an updated code list, but they have not replied.
Among the information shown in these delay logs:
- “No Operator Available” is a serious problem related to TTC staffing levels.
- Diversions account for a large number of delays, notably on the bus network, not just streetcars.
- Collisions involving buses and streetcars are common.
- Weather related delays including autos blocking tracks peak in winter months for buses and streetcars.
- Streetcar delays related to switches are reported under various codes, but there is no code for derailment thereby masking the number of the most serious track-related events.
- The number and length of delays on 6 Finch have fallen by over 50% since the opening months.
- A common source of delay on 5 Eglinton relates to guideway intrusion.
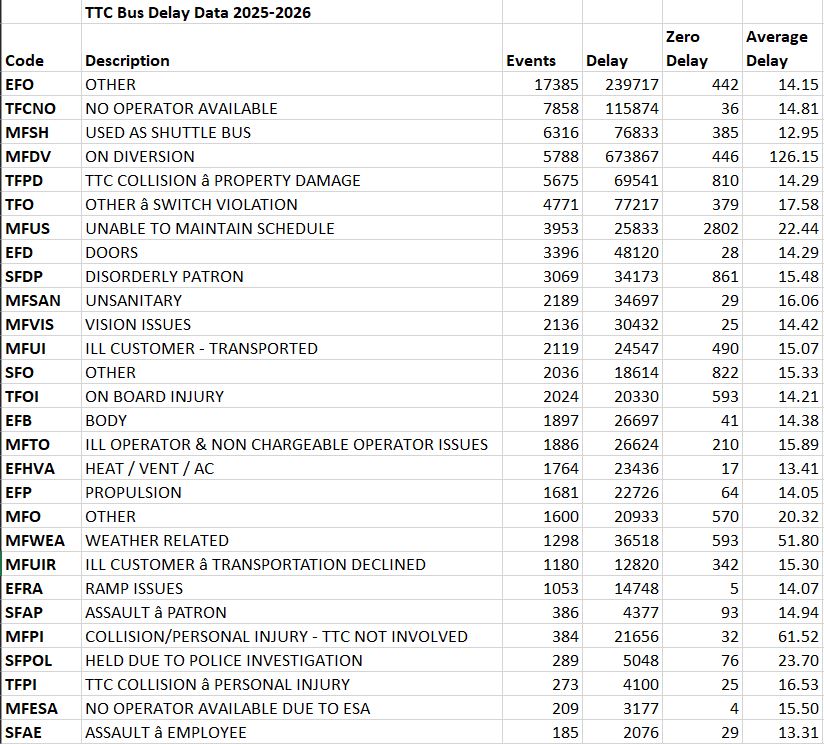
In the tables below, an extract from the full list of delays shows the most commonly cited codes. The columns are:
- Code: The TTC delay code
- Description: The TTC’s description for the code, if any
- Events: A count of the delay logs for this code
- Delay: The total minutes of delay charged to this code
- Zero Delay: The number of events for which the delay was reported as zero
- Average Delay: The average delay for the events where there was a non-zero delay
Buses
For the 16 months of delay logs, there are 84,145 records of which 10,596 show no service delay. The total delay minutes were 1.735-million.
It is troubling that the most common reason is “Other” accounting for about 20% of the logs.
Second most common is “No Operator Available” at 7,858 events. This begs the question of whether the TTC is understaffed. Note that there is a separate category of Employment Standards Act shortages triggered y maximum work hour rules, but these are far less common at 209.
Over one third of the total delay time is due to diversions.
Also of note is the 5,675 collisions involving TTC vehicles with property damage.
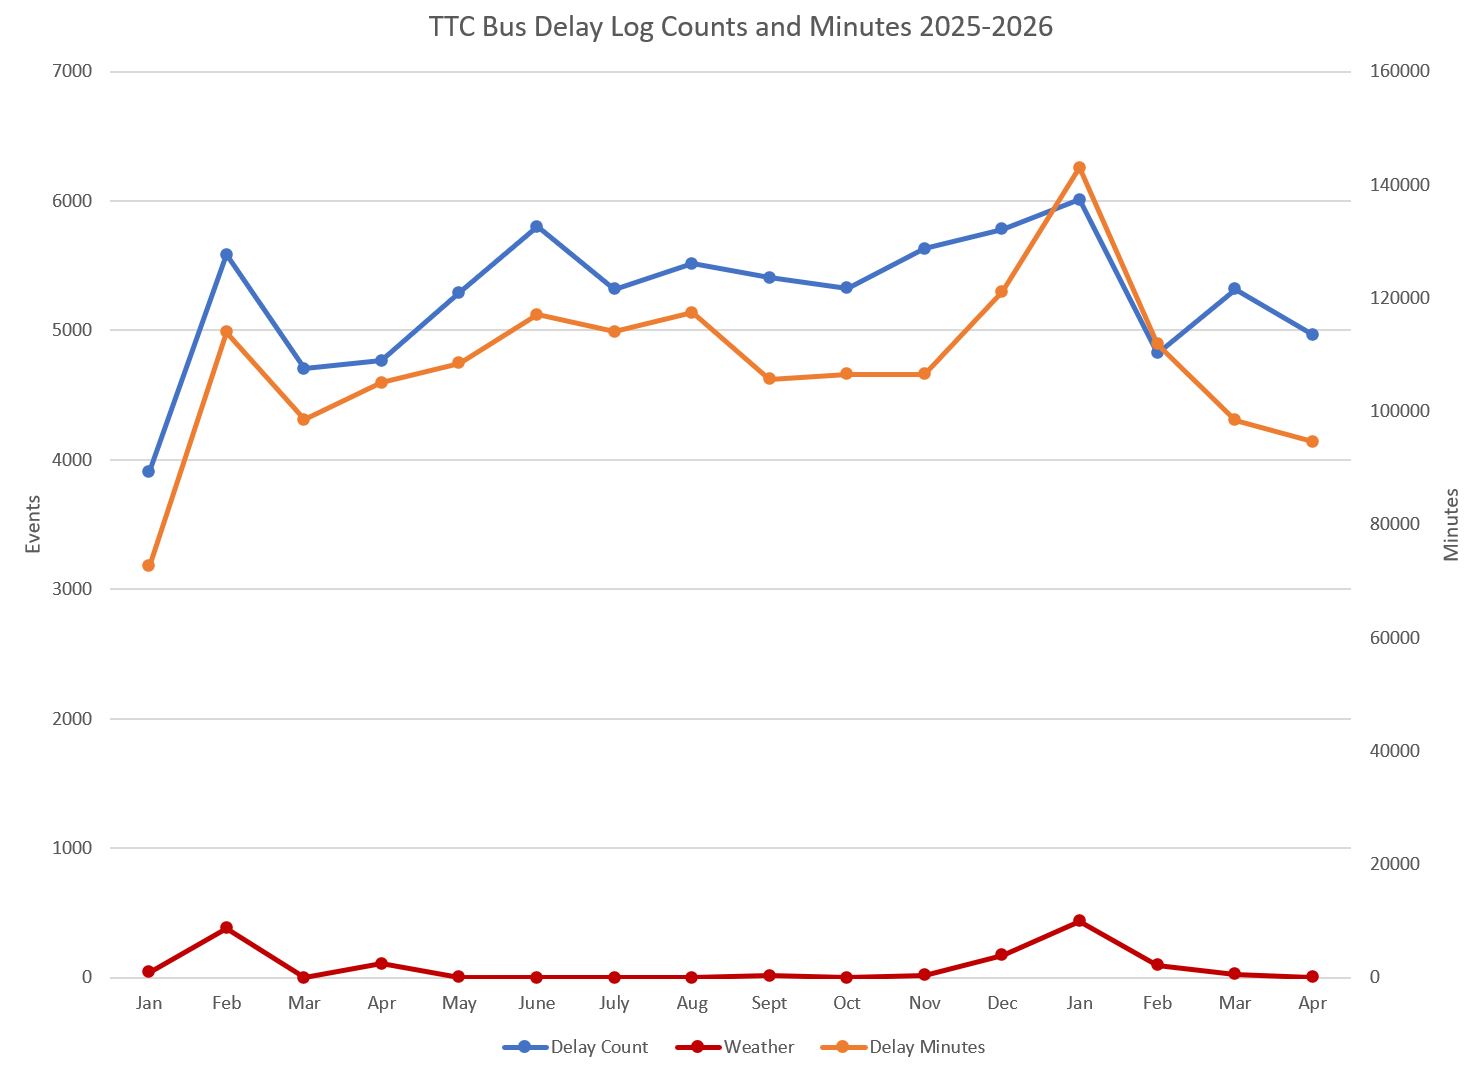
Full chart showing all delay codes and monthly breakdown:
Note that in this chart there are two sets of monthly numbers. One set shows the count of events, and the other shows the minutes of delay.
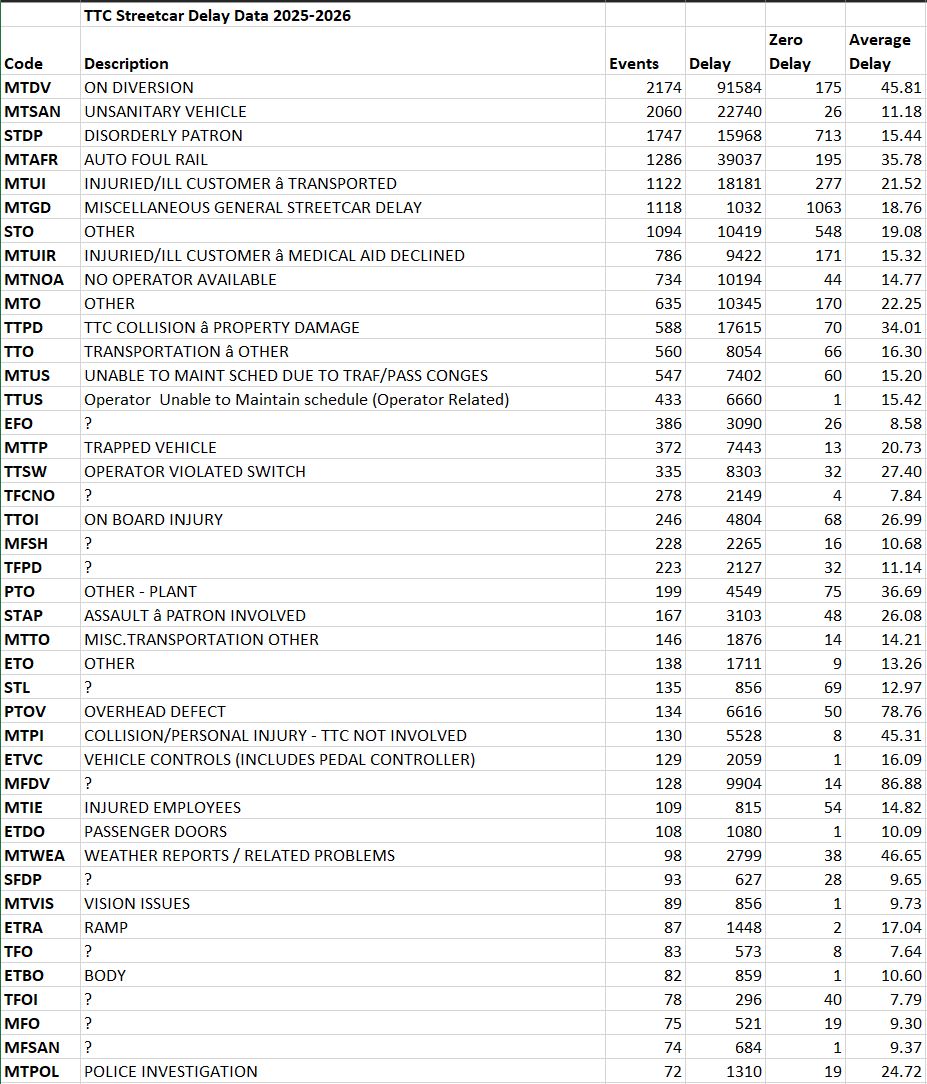
Streetcars
For the 17 months of delay logs, there are 20,740 records of which 4,627 show no service delay. The total delay minutes were 368-thousand.
The most common delay code, and one generating long average delay times is “On Diversion”. Next up are “Unsanitary Vehicle” and “Disorderly Patron”. Although these have similar numbers to the diversions, the average delay is much shorter.
Fourth is “Auto Foul Rail” although this is very seasonal with most of the events concentrated in two months, notably February 2025. This speaks to the City’s appallingly bad job at snow clearing on streetcar routes even though these are supposed to have priority.
“No Operator Available” shows up in the streetcar list with about one tenth the number of events as in the bus data.
Considering the level of debate in recent months about track switch problems and slow orders at intersections, it is worth noting that there is no delay code for “derailment”. Such events are reported under other codes, and there is no way to know how common they are, or the critical locations where they occur.
There are 335 incidents of “Operator Violated Switch”, and smaller numbers of switch related events (see the full list linked below) of “Switch Problem, No Trouble Found” (53), “Switch Incident – Electrical” (24), and “Switch Incident – Mechanical” (16).
There were 588 collisions involving TTC vehicles, about one tenth the number on the bus network.
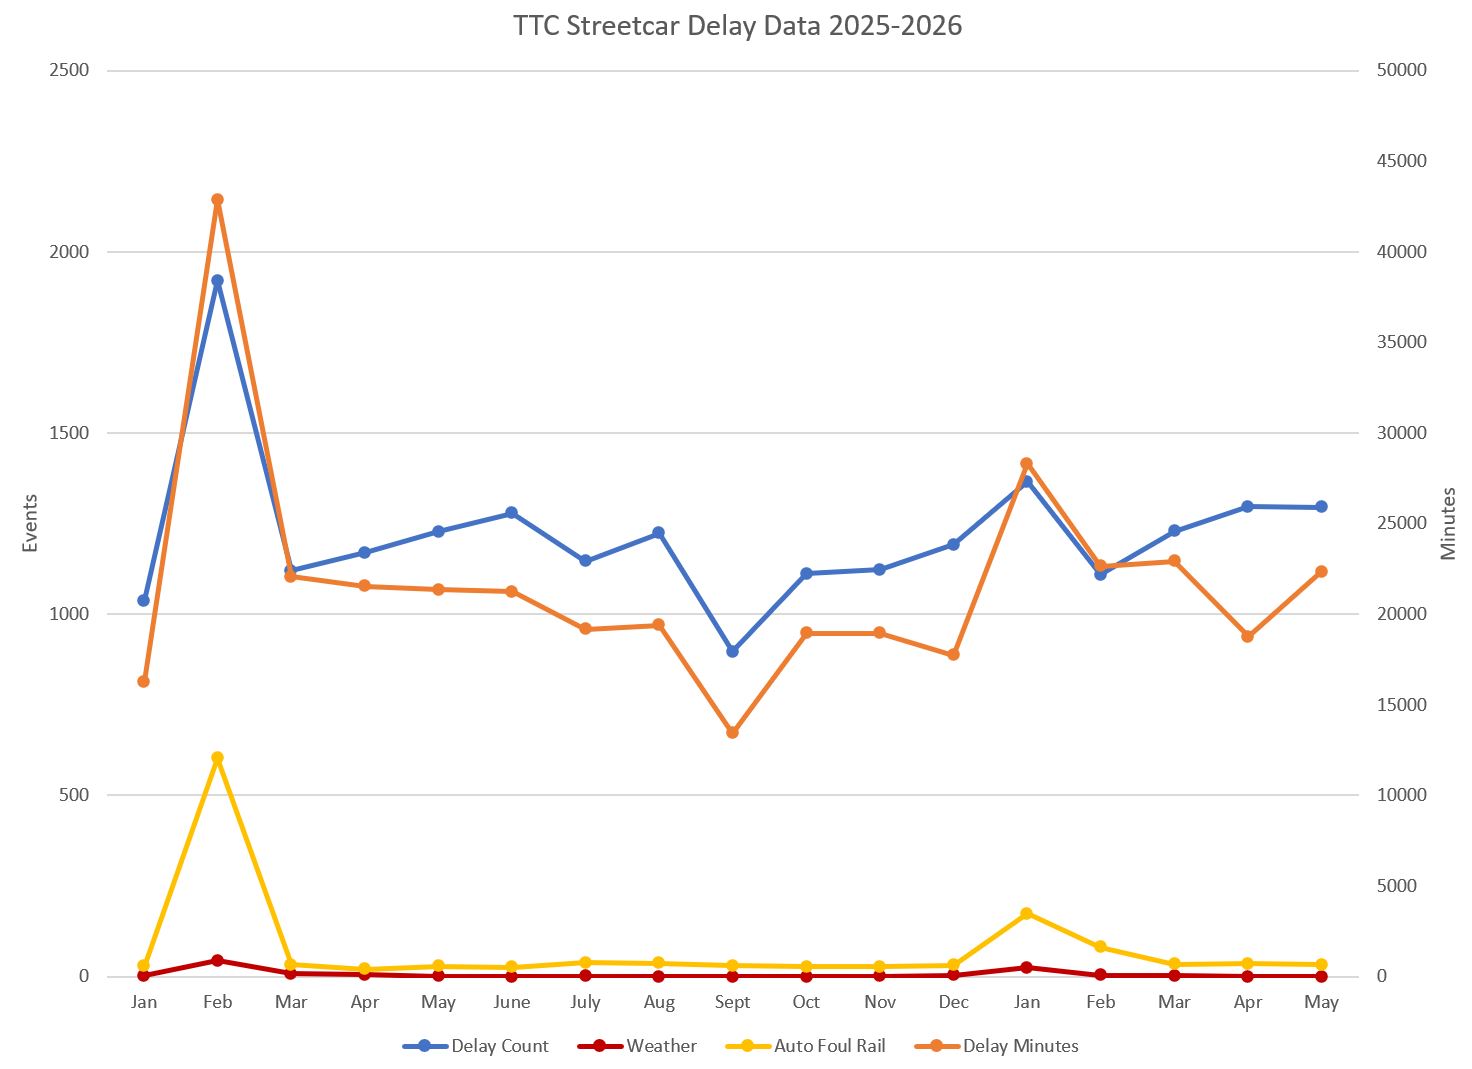
Full chart showing all delay codes and monthly breakdown:
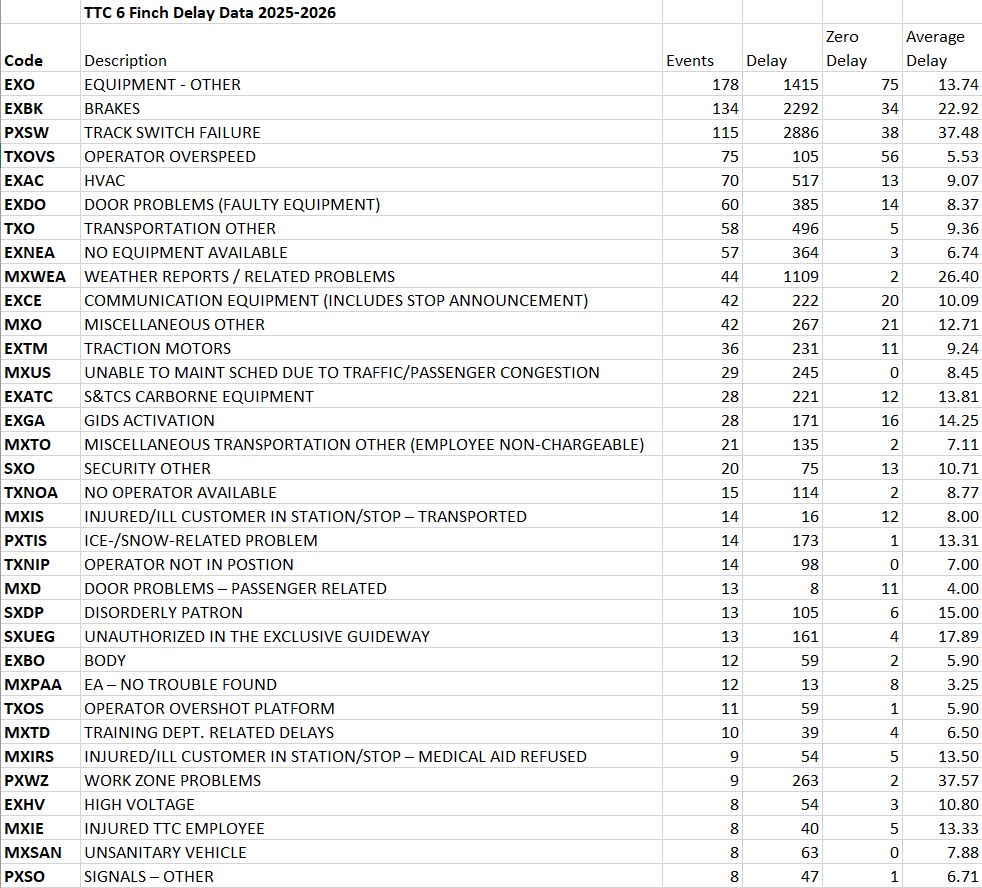
6 Finch
From past reports of issues on 6 Finch, it is no surprise that the most common delays were caused by equipment, switch failures, overspeed trips and HVAC. “No equipment available” was cited in 57 events, but none of these were in April or May.
Overall, the number of events and delay minutes has declined substantially since the early months of the line’s operation. Without question, the politically driven decision to open in 2025 concurrent with bad weather accentuated problems, but many issues would have appeared regardless of the opening date. It is clear that the system testing did not catch some severe problems before opening day.
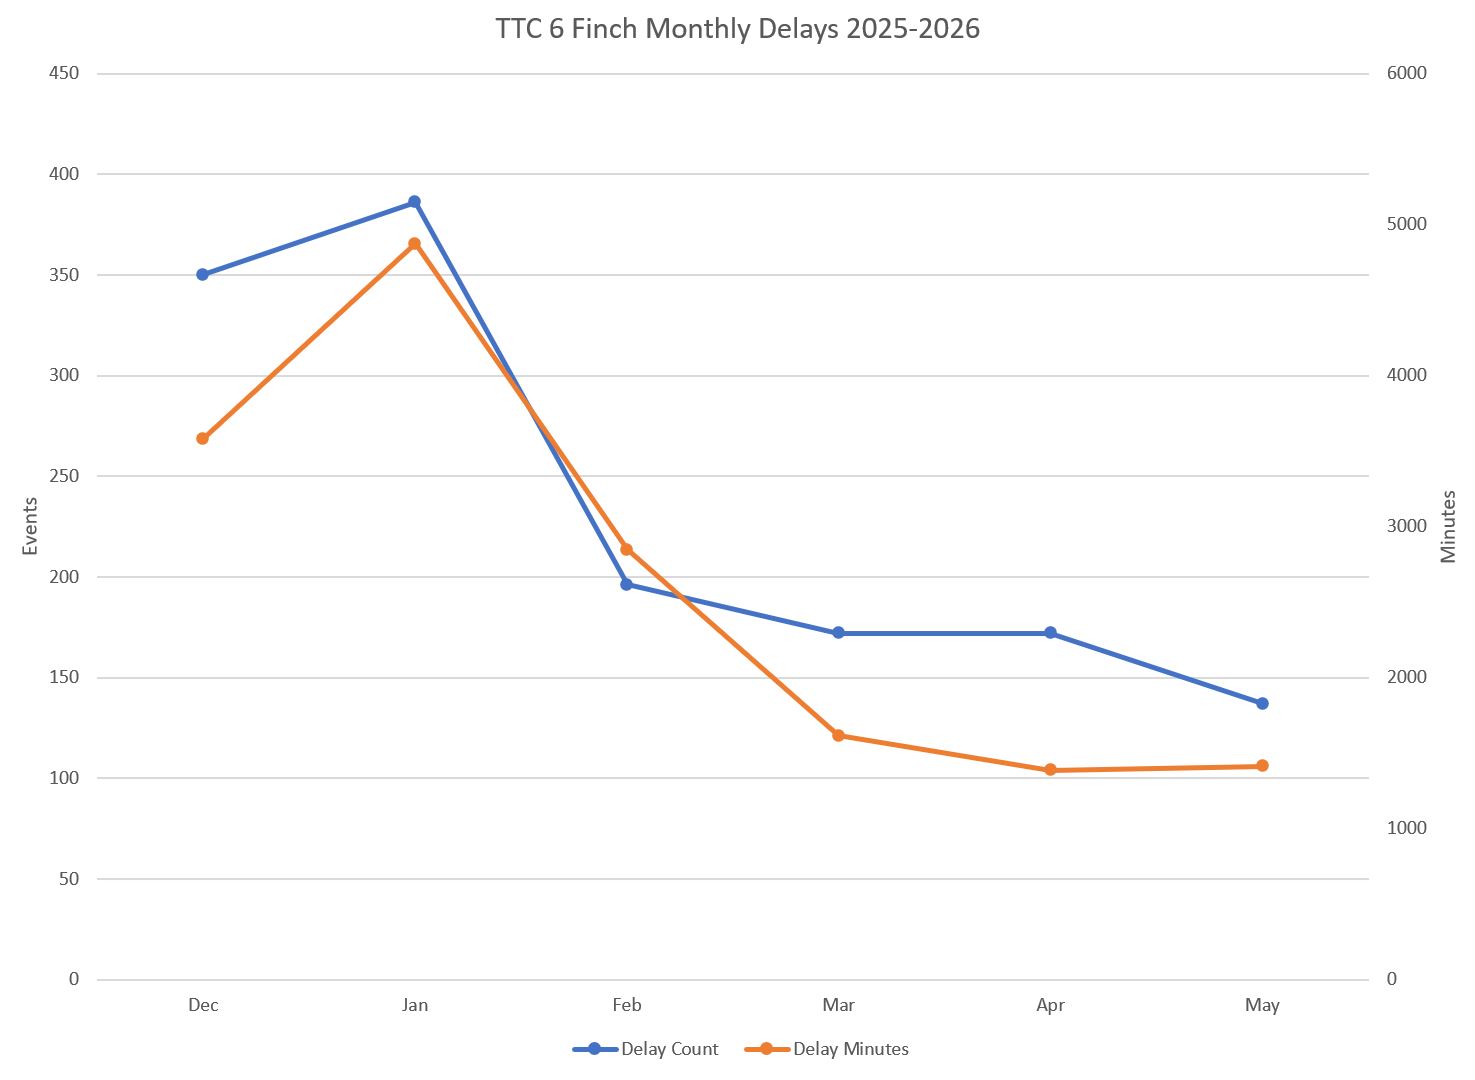
Full chart showing all delay codes and monthly breakdown:
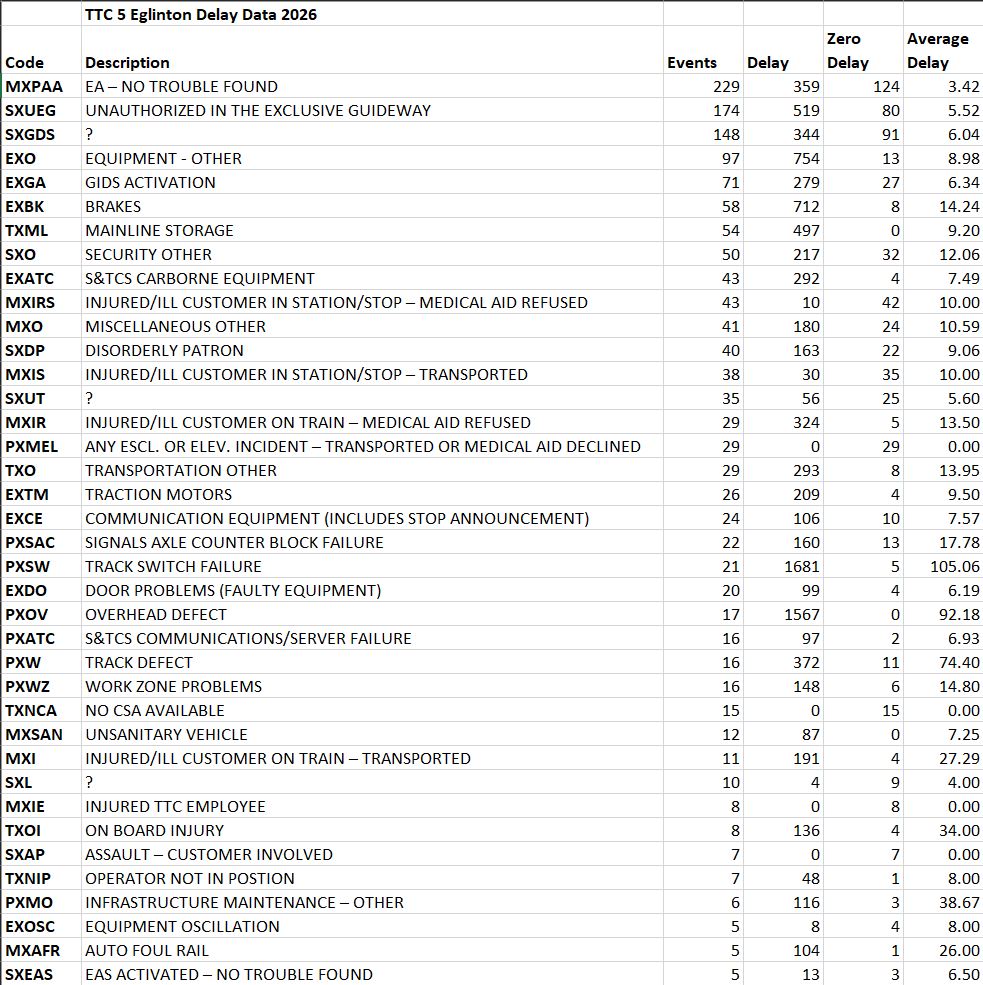
5 Eglinton
The profile of delays on Eglinton is very different from Finch in part due to differences in the nature of the line with guideway intrusion events (two categories) ranked highly. The third most common code “SXGDS” is not defined in the TTC data, but is likely related to the intrusion detection system.
There are problems with equipment and infrastructure, but the numbers and ranks of various problems are different (notably for track switch problems because Eglinton had better switch heaters as part of the original build).
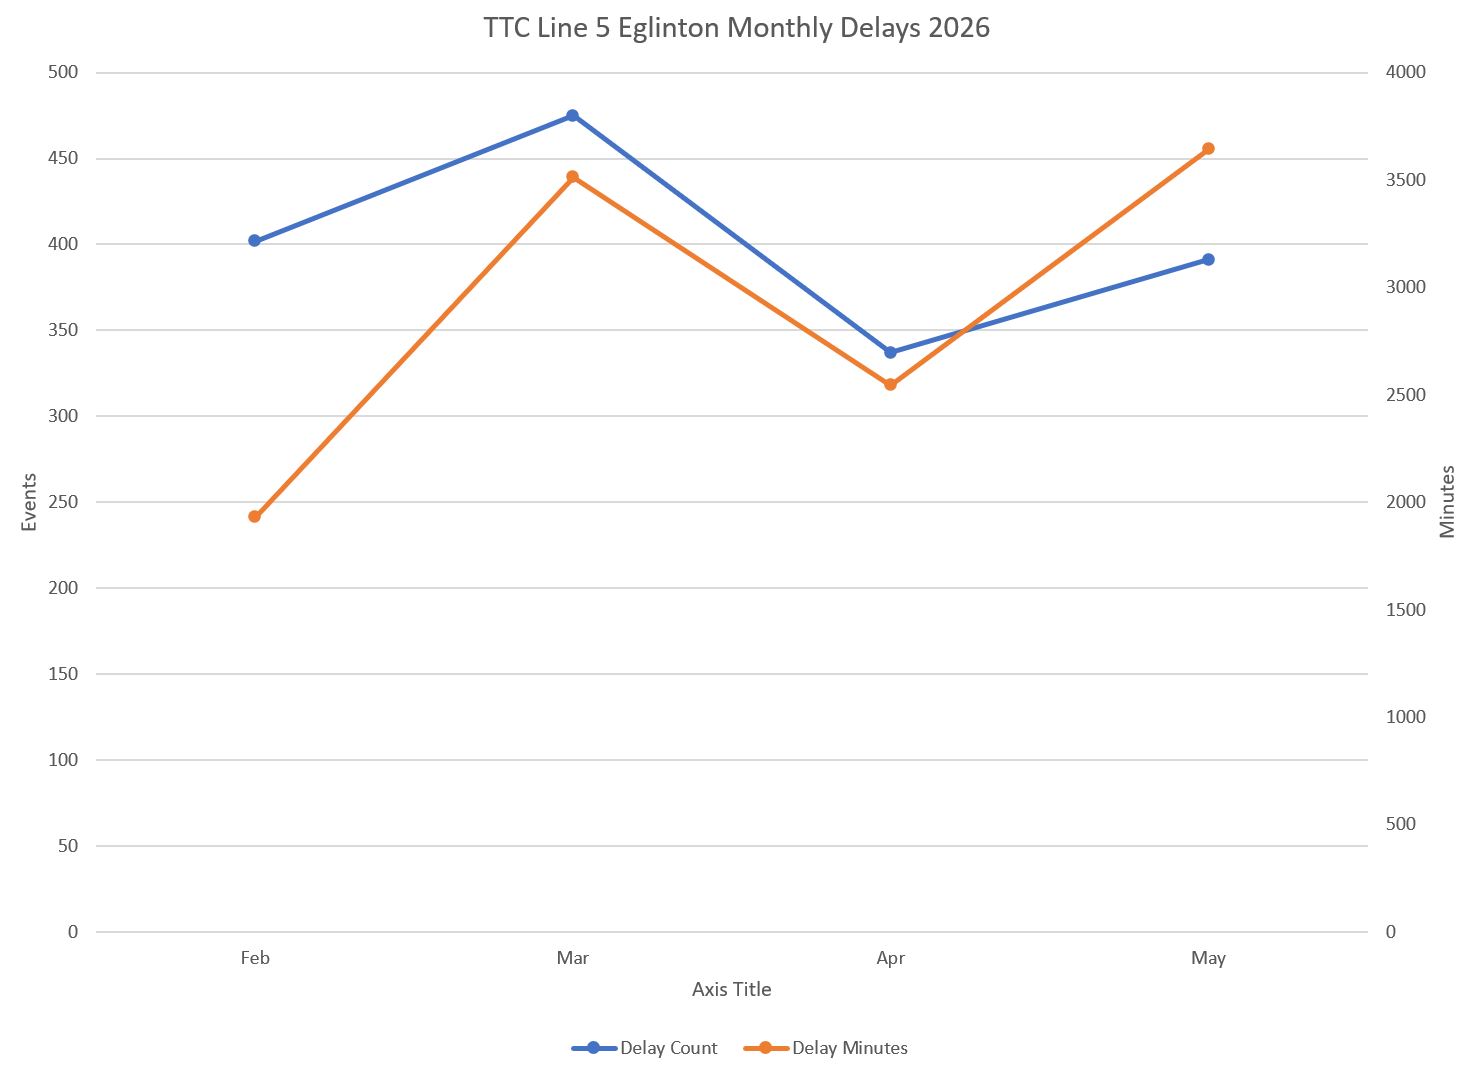
Full chart showing all delay codes and monthly breakdown:
