
The TTC recently updated its delay records for subway, bus, streetcar and LRT on the City’s Open Data Site. These files are raw data, and some slicing and dicing are required to put them in an approachable format.
I have consolidated the data from January 2025 to April 2026 with the full set linked and explained at the end of this post. Extracts of interest are in the main article.
Caveats:
- The accuracy of this information depends on what the TTC chose to log. I have no reason to believe that they omitted any incidents.
- When a delay period is cited, this is the length of the event, but there is no indication of the pervasiveness on general operations and riders through multi-train delays or service suspensions. This information is not included in the logs.
- There are many separate codes for events that are reported publicly as “operational” or “mechanical” problems. Getting a handle on these requires a second level of analysis to group related items. I have not done this here in the interest of getting the basic data into an article for discussion.
Much debate about subway delays and safety has focused on two areas:
- Track level incursions and the benefits of Platform Edge Doors (PEDs)
- Security of riders
Unauthorized access to track level is far more common than cases where a train strikes a passenger (733 incidents vs 26 over 16 months). Prevention of track level access requires a physical barrier that will dissuade all but the most determined from getting off of the platform. Other related delays involve debris which could be a source of fires. This requires a true barrier.
Security incidents take many forms, but they are quite numerous. Not all of them represent a threat to riders. There has been much hype thanks to Provincial regulations regarding open use of drugs, but other types of security and safety events are far more numerous. New arrest powers will only make a small dent. This is security theatre, not a real response to the broader range of public disturbances, aggressive behaviour, mental and other health problems. The TTC and City recognize this in the recently announced increase in various types of services to be provided on the system.
That said, I do recognize that there are problem areas on surface routes, but security in that part of the network is much less present, and current attention focuses on the subway.
What is very striking about the list is the prevalence of events related to equipment and infrastructure. These are “internal” to the TTC in that any reduction will require improvements in TTC practices. The TTC needs to address areas they can fix on their own rather than, as happens too often, they focus on issues external and beyond their control. This will not eliminate all delays, but should produce real benefits in reliability and quality of service.
Detailed breakdowns follow the “more” break.
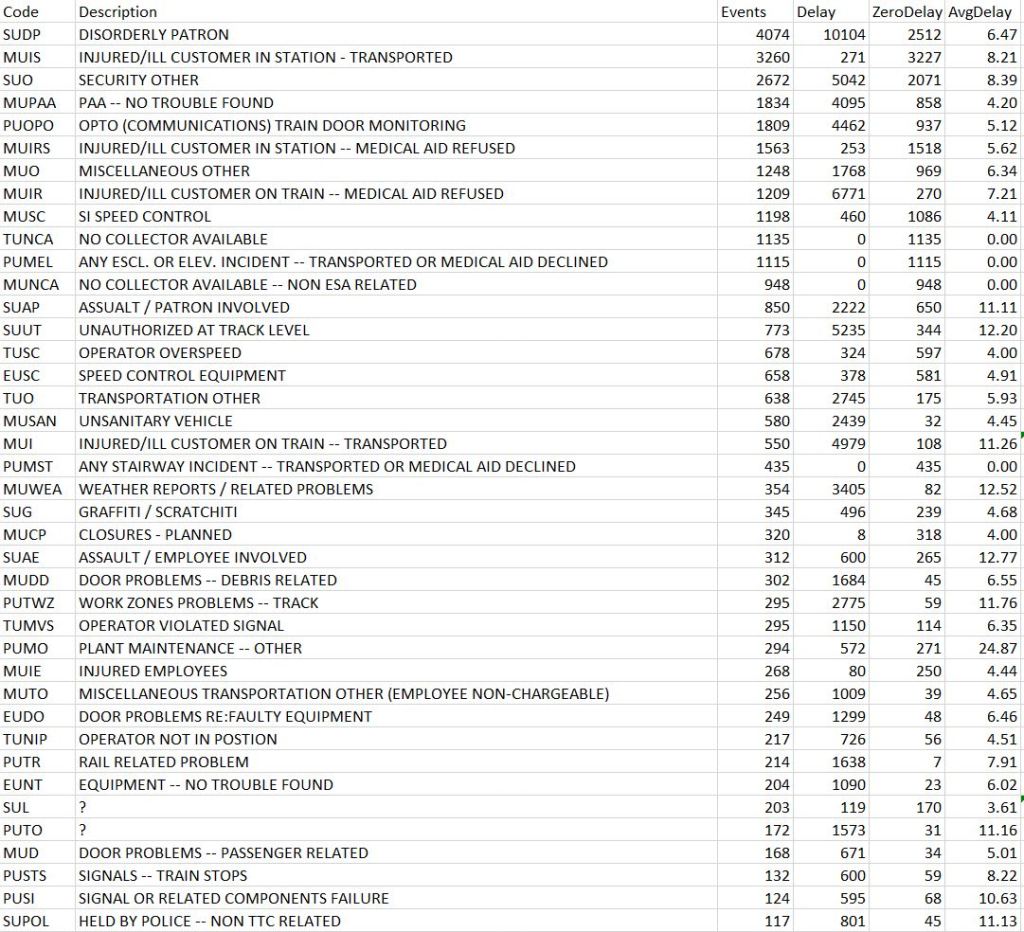
The Most Common Delay Codes (By Count)
In total there were 35,385 delay logs over the 16-month period. Of these, 90% of events were due to about 40 delay codes and over 75% to the top 20. Here are the stats for the top 40. In this table, the columns are:
- TTC delay code
- TTC delay description
- Count of events
- Total delay minutes
- Number of events causing no delay
- Average delay minutes for events that caused a delay
By count of events, the high roller by far is “Disorderly Patron”. Over half of these events did not involve a service delay.
“Unauthorized at track level” events are less common, but produce longer delays. “Priority One” (train contacted a rider) were far less frequent (only 26 events) but produced average delays of 86 minutes with obvious cascading effects with suspended service.
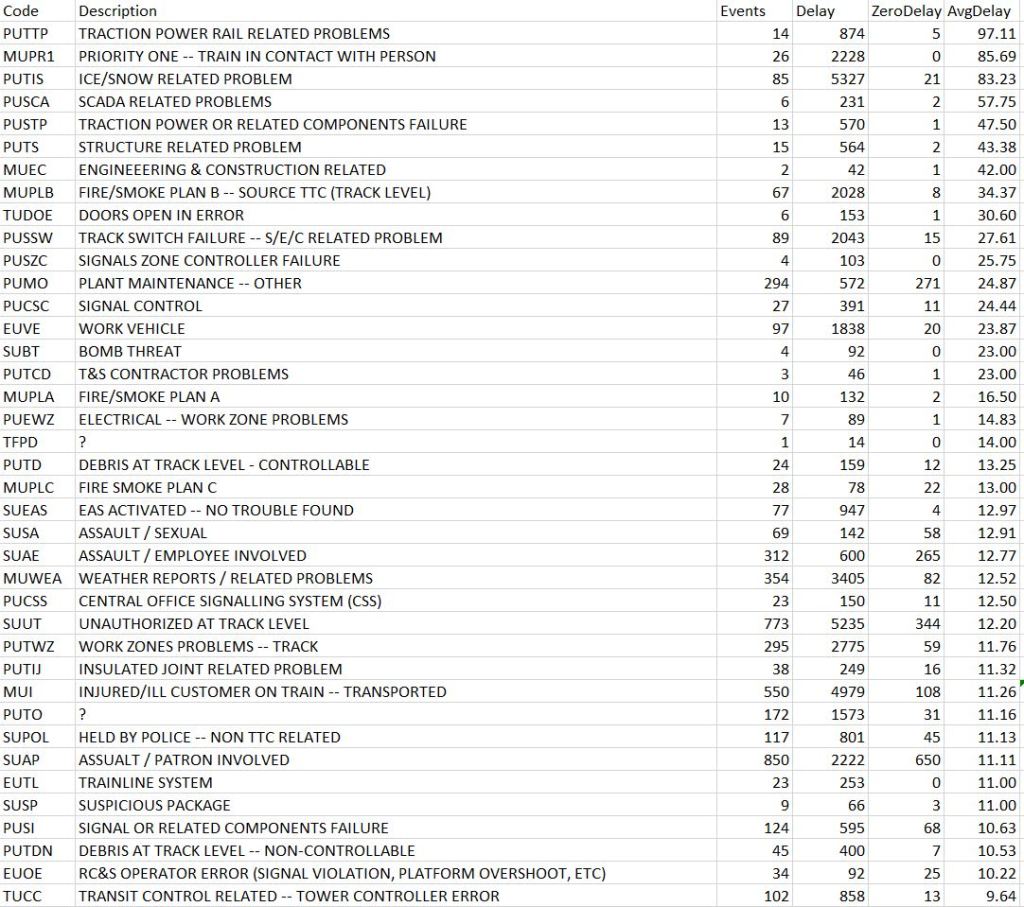
Delays By Average Length
When the data are sorted by average delay length, the top position goes to power rail problems. There were only 14 events, but they averaged 97 minutes each for the 9 that had a reported delay.
Ice and snow delays were concentrated in February 2025 and January 2026. Similarly delays logged as “Weather” were concentrated in the winter.
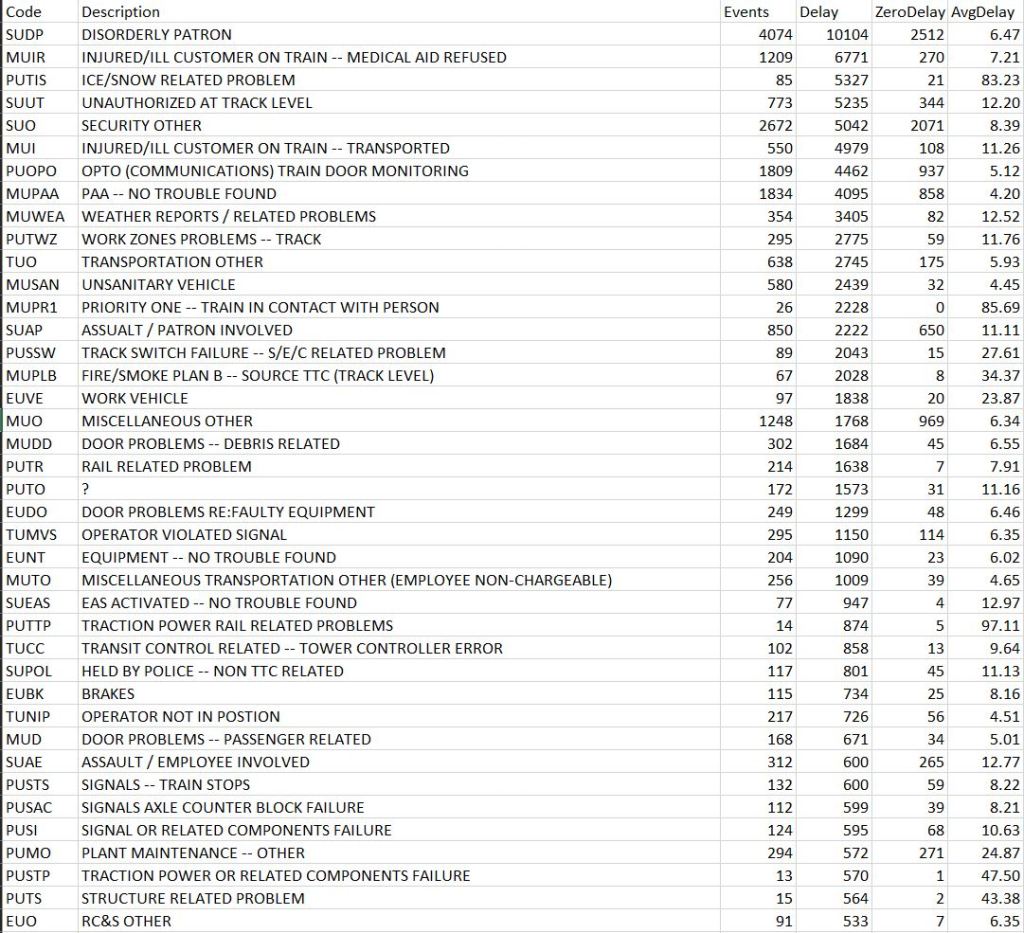
Delays By Total Delay Time
From the point of view of total delay time, “Disorderly patron” again sits at the top of the list although the individual delays only average 6.5 minutes.
Consolidated Data
The tables linked below contain the full list of delays sorted in three formats.
