This post is the second in a series of four covering the June round of online updates to the Ontario Line project.
Updated June 18, 2021 at 9:05 am: The section on the First Parliament site has been updated with information about the location of the Parliament and other buildings provided by a reader, Michael Bethke, in the comments. With thanks for the information.
Updated June 18, 2021 at 8:00 am: A section discussing the two versions of the Metrolinx presentation deck has been added at the end of this article.
The first version of the presentation deck that Metrolinx posted contained two slides with howling spelling mistakes, but also with station diagrams that differed from those shown in the online presentation. Subsequently the “final” version of the deck was linked from their engagement page. I have updated the link to the revised deck below and have replaced the illustrations in the article. The first version is also available from my own site if Metrolinx deletes it from theirs.
From document properties in the published PDFs, it is clear that there are two different versions of the presentation deck, and the wrong one was published first.
At least Metrolinx caught the error before their online session, but they pushed out a deck with errors two hours ahead and did not flag that it had been changed on their site. Basic editing errors like street names raise issues about the care in other, more serious, parts of their work.
Meetings for other segments are scheduled on:
June 24: Corktown, East Harbour, Riverside, Gerrard
June 30: North to Eglinton from Danforth
The introductory article for the meeting is on the Metrolinx blog and the engagement page includes links to the four meetings and resources for them.
Information here is taken from the neighbourhood update for the downtown segment, the presentation deck for the June 17 meeting, and information gleaned from that meeting.
This segment runs from Osgoode Station over to the Don River. An important structural point about the Ontario Line is that the downtown segment is in bedrock unlike the Eglinton Crosstown line which is tunneled through glacial till.
On Eglinton this meant that passing under Line 1 at Yonge/Eglinton and at Eglinton West Station required structural support of the existing subway and mining under Line 1 rather than continuing with the TBMs. On Queen, the existing stations are just above the level of bedrock which will support them while tunneling proceeds 10m or more below in rock.
Because station catchment areas overlap, some people and jobs will be double counted.
Station usage may include passengers arriving, leaving and transferring which is a different number from originating passengers at each station. I have asked Metrolinx for clarification on this, but they have not yet replied.
The primary issue on the agenda for the June 16 meeting was the “near miss” in the subway in June 2020 and management’s failure to report this issue to the Board. Please see The “Near Miss” At Osgoode Station for further details on that item.
CEO’s Report
The CEO’s Report contained little new and included the usual statistics about which I have written before. These are supposed to be the “new improved” version, but they still hide more than they tell.
Service reliability:
“On time” performance is still measured only at terminals, and is reported on an all day basis.
For the subway, the target is that headways be no more than 1.5 times the scheduled value.
For surface routes, the target is that departures be within a window of +1/-5 minutes to schedule.
Subway capacity:
These values are reported as averages from several locations over the peak periods.
The index is the percentage of scheduled service operated, not the number of trains. This measures what proportion of planned service was provided, not the absolute amount of service or demand.
Vehicle reliability:
In many cases, the reported kilometres-between-defect numbers appear to be capped and do not reflect the actual maxima achieved nor the month-to-month variations.
Subway reliability changes are, in cases, reported to be affected by line closure that reduce the amount of mileage the fleet accumulates. This should only affect distance-based metrics if the failures are a function of something other than distance and if cars are prone to break down even if they are used less.
eBus reliability shows consolidated results for all three vendors with average MDBF values generally above the target of 24,000 km. This does not align with comments in the Financial update (see below).
A major concern for the TTC is the growing number of assaults on employees. This is a trend seen across the transit industry, according to TTC management, and it is related to the pandemic, stress levels and arguments over fares and masking. This index is measured per 100 employees and reported quarterly. In 1Q21, the value grew above 6 offenses per 100 employees per quarter.
Offenses against riders are also up compared to the pre-pandemic era, although the number is falling. This index is measured per-million-boardings, not as an absolute value. If riding falls, but offenses do not fall at the same rate, then the index goes up. Conversely, growing ridership could cause the index to fall even if the number of events does not. A common problem, according to management, is fights on the subway.
Although the Board sought more details, management did not have the detailed stats to hand and could only report limited anecdotal information.
Customer mask use continues to be reported at over 96 per cent, with only a few percent above that wearing masks improperly. Very few riders were observed unmasked.
Ridership has not changed much in the past month, and the stay-at-home order, only recently expired, has reduced demand.
Average weekday boardings were 502,000 on bus routes (36% of pre-COVID), 286,000 on subway lines (19% of pre-COVID) and 81,000 on streetcar routes (23% of pre-COVID) for the week ending April 24, 2021. There was a small increase in boardings for all modes the last week of April.
CEO’s Report, p. 11
Bus occupancy continues to be reported as well below the level seen in September 2020. Like many TTC stats, this chart shows all route, all day values and does not break out hot spots and times. There is no reporting of where “Run As Directed” buses are used or of their efficacy in reducing crowding.
This chart will bear watching as demand grows with relaxed pandemic rules and later in the year with a resumption of in person activities in schools, some work locations and entertainment venues.
Financial Update
The quarterly financial update tracks the ongoing status of the Operating Budget and major Capital Budget projects.
On the Operating side, the TTC projects a shortfall in revenue because ridership has not recovered at the expected rate in the first months of the year. This will be almost completely offset by reduced expenses over the year. In the short term, the TTC is running ahead of budget because cost reductions have exceeded revenue losses, but this is not expected to last as service ramps up to handle demand growth through the second half of the year.
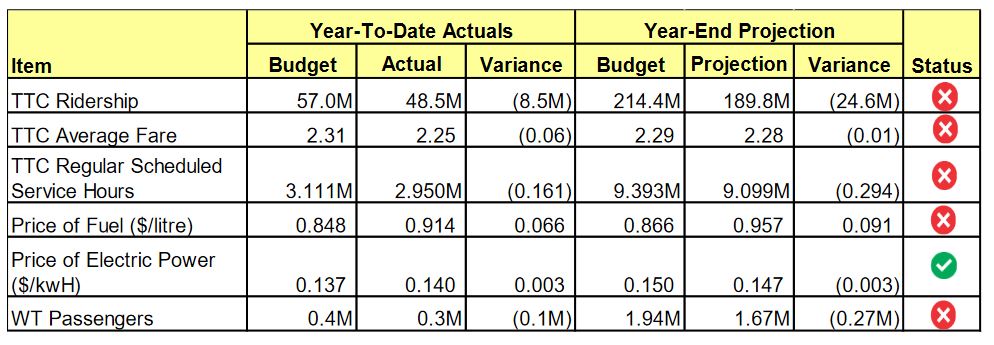
The key indicators for operations are shown in the table below:
Note that the TTC projects it will schedule about 3 per cent less service hours over the year than originally planned, and for the year-to-date has actually scheduled about 5 per cent fewer hours than budgeted due to lower than expected demand. This falls more heavily on the subway which is operating at 87 percent of normal service levels, while bus and streetcar services are at 97 and 95 percent respectively.
The actual versus budgeted ridership is illustrated in the chart below.
Service levels are planned to begin rising in September with a return to 100 per cent of service budgeted for January 2022 when ridership is expected to hit 50 percent of pre-pandemic levels.
With ridership at only 50 percent at the start of 2022, the City and TTC will continue to be challenged to operate 100 per percent service levels. Provincial and federal support programs are based on their fiscal years which end on March 31. Funding for Covid support for much of 2022 is an unknown. This will be a major budget issue.
On the Capital side, there are only a few projects with significant news.
The major overhaul of streetcars now in progress to repair manufacturing defects on the first of the fleet will not complete in 2021.
The projected underspending on the 204 LRV procurement is due to project closure activities not being completed until 2022. The Major Repair Program, also included in this project, is tracking behind schedule due to the impact of the COVID-19 pandemic, which forced Alstom’s production facilities to temporarily shut down in late March 2020. Currently, Alstom is working on accelerating the program to be completed by the end of 2022.
Financial Update, p. 18
This will affect the level of service that can be provided on the streetcar network, and the expected return of buses to bus routes will be delayed.
On the Line 1 ATC project, revenue service is planned to extend from Rosedale to Eglinton in 4Q21. Completion to Finch would be in 3Q22. There is an issue at Eglinton Station due to the Crosstown project and the timing of the shift in platform stopping location further north as planned for the new links to the Crosstown concourse below the subway station.
On the eBus project, vehicle reliability is cited as a key issue:
Vehicle Reliability and Fleet Availability: Only one (New Flyer Industries) of three vendors for e-Buses are meeting availability and reliability targets. Action Plan: The TTC is working with all vendors on a daily basis to improve both vehicle availability and reliability to address these issues through root cause analysis, vehicle modifications and improvements for the supply chain.
Financial Update, p. 33
This raises questions about the planned split tender for eBuses and how the TTC will deal with a vendor that has not met reliability targets. A further update on the head-to-head competition between vendors is due in 1Q22 but the RFP for buses will be issued in 4Q21 for deliveries in 2023.