
This is a companion piece to my review of service at Long Branch Loop which, for over two years, has been provided by a bus shuttle west of Humber Loop.
Apologies in advance. This is a long read intended for those who are interested in the fine detail of service behaviour over a period when there were many changes in the service design, and where there is a wide variety of reasons for irregular service.
One might assume that with the 501 Queen route shortened, and at times with a separate bus shuttle operating on the east end of the route, service at Neville Loop would be better than with streetcars running all the way from Neville to Long Branch. This is not entirely true, and even some periods of bus service were quite unreliable. There are many days when shuttles ran with vehicles missing or in bunches with no apparent efforts to manage and space the service.
As on the west end of the route, the TTC’s abdication of line management brought irregular headways, large gaps and bunching. A common situation is for a group of cars to leave Roncesvalles eastbound closely spaced, and to continue as a parade across the city. Sometimes, short turns in the east end partly correct this problem, but sometimes the parade simply echoes back across the line. This is not caused by “congestion”, but by the failure to maintain service spacing.
Service History
Pre 2016: Streetcar service operated between Neville and Long Branch Loops with alternate cars turning back at Humber.
January 2016: Service split at Humber Loop with CLRVs operating to the west and ALRVs operating to the east except late evenings and overnight.
May 8 to December 9, 2016: 501 Queen service diverted via Shaw, King and Spadina for watermain construction.
October 11 to November 18, 2016: Provision for the watermain diversion was removed from the schedule, but cars continued this operation until December 9. Buses replace streetcars between Coxwell and Neville Loop for track work at the loop.
November 2016: Streetcar service restored east of Coxwell.
January 8, 2017: Streetcar service cut back to Roncesvalles. Major reconstruction work on The Queensway and on Lake Shore affected 501L bus service from April onward depending on work locations and road restrictions.
Late March 2017: Schedules provided for a diversion via Spadina, King and Shaw, but this was not actually operated.
May 2017: Entire 501 route converted to bus operation for various construction projects. Buses operate from Neville Loop to Long Branch or to Park Lawn Loop in a route design comparable to the merged, pre-2016 streetcar service.
September 2017: Streetcar service restored between Roncesvalles and Connaught (Russell Carhouse) with bus operation from River to Neville due to track construction at Coxwell. Route diverted downtown via King between Church and Spadina due to bridge construction west of Yonge and track work at McCaul.
Streetcars diverted to loop via Broadview, Dundas and Parliament between October 10 and 12 due to construction at Pape. The shuttle bus service was extended westward during this time causing erratic headways on the east end of the route.
October 15, 2017: Streetcar service restored to Neville Loop. 501J shuttle bus service added between Bathurst and Jarvis. Route diverted via Broadview, Dundas and Parliament for repairs to the Don Bridge between October 30 and November 7.
November 2017: 501J shuttle discontinued. Peak bus trippers added between Woodbine and Sunnyside Loops.
February 2018: Streetcar service scheduled to operate between Neville and Humber Loops, but actually short turned at Roncesvalles pending completion of Humber Loop construction. Bus trippers from Woodbine discontinued.

This is probably a good time to mention the value of having a large collection of data so that one can perform a longitudinal study of route behaviour. Individual months, weeks or days do not always convey the types of events, the chronic and one-time problems, or the seasonal variations.
The TTC should have this kind of detailed analysis available as part of its program to measure and report on service quality, reports that have been missing, despite being part of the “Customer Charter”, for three years. Too many performance metrics, to the extent they even exist at the TTC, are summarized a high level masking the real extent of poor service. Queen is supposed to be part of the “Ten Minute Network”, but one would never believe it from actual operating results.
Format of the Charts
These charts are in the same format as in earlier articles where values of headways (the space between cars) or travel times are plotted by percentiles. There are four colours corresponding in increasing proportions of the service:
- Purple: 25th percentile. One quarter of all trips operated on a headway at or below the value.
- Green: 50th percentile or median. Half of all trips operated at a headway at or below the value, half above.
- Yellow: 85th percentile. Most trips operated at a headway at or below this value.
- Red: 100th percentile. At least one trip operated at this upper level. The space between the red and yellow lines holds the values observed for the top 15% of headways.
If service is well-behaved, the green line (50%) should be roughly at the scheduled level of service. If the purple line (25%) is close to the axis (a value near zero), this indicates that about one quarter of the service is running in bunches on very short headways. When the red line (100%) spikes up, especially when there is a lot of room between it and the green line, up to half of the service is running at extended, and probably unreliable headways.
Fall 2015: Streetcar Service Over The Entire Route
Service through the fall of 2015 settles down to a fairly consistent pattern after September. There are a few major interruptions that show up in the data, but also wide headways that are simply the result of short-turning cars at Woodbine Loop, or of poor service management eastbound across the route. A common problem was with the mix of Long Branch and Humber services where the proper blending of inbound service was not managed, and pairs of cars, one from each service, would cross the line together.
I have omitted the service charts corresponding to individual examples below in the interest of space. Where external causes are given, these are taken from TTC eAlerts.
Only the worst of the gaps at Neville are detailed below. The service quality is spotty in the morning and midday, but really deteriorates through the PM peak and evening. There is a noticeable deterioration from early October onward suggesting a change in line management policy.
501_2015_SilverBirch_WB_HeadwayStats
AM Peak:
- Friday, September 4: Overhead down at Queen & Coxwell. Shuttle buses operated, but those for which tracking data exists were in a pack followed by a very large gap. It is possible, that other vehicles not identified as “Queen buses” ran to Neville during this time.
- Monday, September 14: Bunched service eastbound from Humber causes wide gaps at Neville.
- Wednesday, September 16: Overhead down at Queen & DeGrassi.
- Friday, September 18: Police investigation at Queen & Hiltz (near Greenwood).
- Thursday, October 29: Bunched service eastbound plus short turns at Woodbine combine to give wide headways at Neville.
- Wednesday, November 4: Short turns at Woodbine cause wider than normal headways at Neville (this is only the most extreme example within the data

Midday:
- Friday, September 4: Half hour gap caused partly by short turns and by the gap car laying over at Neville.
- Wednesday, September 30: Service diversion between Broadview and Coxwell for an unknown reason causing wide headways at Neville.
- Tuesday, October 6: Eastbound bunched service combined with short turns caused a 30 minute gap at Neville.
- Monday, November 8: Car holds at Neville Loop causing a 39 minute gap, possibly disabled, although there was no eAlert.

PM Peak:
- Thursday, October 15: Overhead down at Queen and Leslie.
- Friday, October 30: Bunched eastbound service plus many short turns at Woodbine Loop create a 34 minute gap at Neville Loop.
- Thursday, December 3: Extreme congestion between John and Bay Streets plus bunched service creates wide gaps at Neville Loop.
- Wednesday, December 9: Taxi cab protest at Queen & Bay caused major disruption to service.
- Tuesday, December 22: Bunched service plus short turns caused wide gaps at Neville Loop.
- Wednesday, December 23: Same as December 22. (This is a common pre-Christmas problem.)
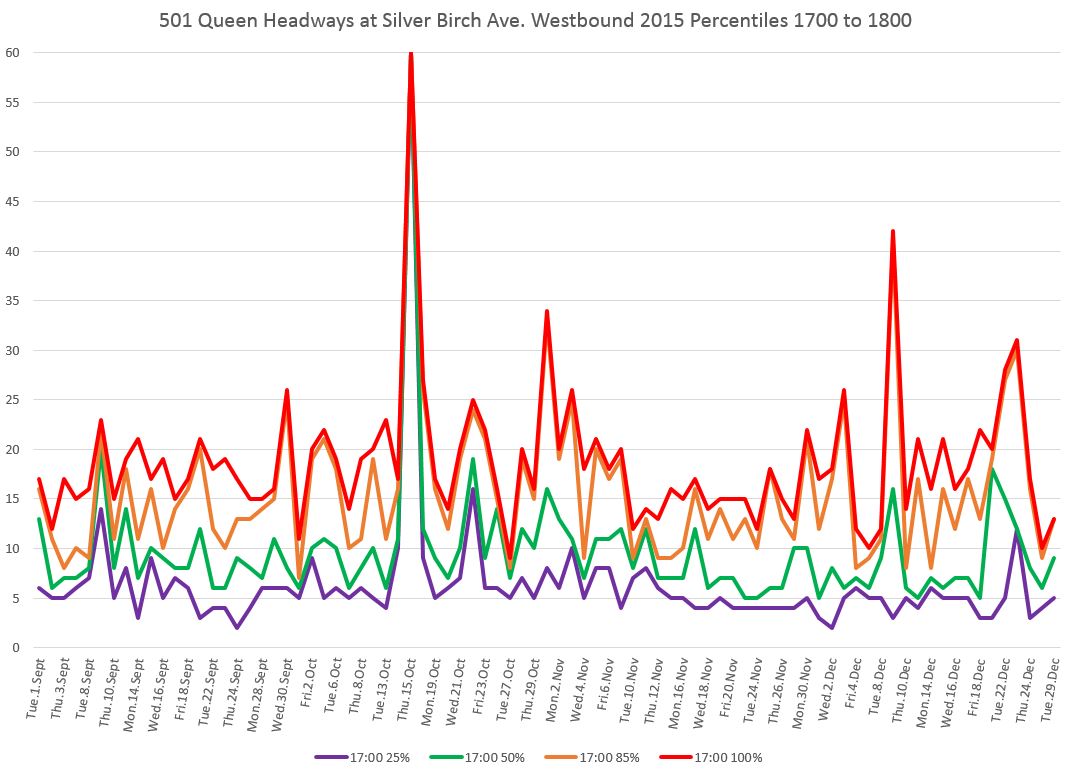
Early Evening:
As the chart below shows, the quality of service at Neville Loop deteriorates after the PM peak and both the 100% and 85% values are often above the 20 minute mark, at times above 30. This is usually a direct result of bunching and short turning that treats the outer end of the line as a place where service can be sent now and then with the result that riders cannot count on it. This gives a reference point for comparison with service in later years when the TTC is supposed to have improved operations and reduced short turns. Among the worst gaps:
- Friday, September 18: Bunched eastbound service plus short turning creates a 35 minute gap at Neville.
- Monday, September 21: Disabled car eastbound at Kingston Road creates a 39 minute gap at Neville.
- Friday, September 25: Bunched service plus short turns creates a 28 minute gap at Neville.
- Wednesday, October 14: Disabled streetcar at Neville Loop creates a 49 minute gap.
- From mid October onward, the maximum headways at Neville routinely crest the 25 minute line. A review of the service charts shows that this was due to an almost complete abdication of responsibility for line management. Streetcars ran in packs with only occasional attempts to fill gaps through short turns. The first of these peaks that is a real delay did not occur until December 4 when an auto parked on the track at Victoria Street held a bunch of ten, yes ten, eastbound cars that accumulated in the space of about 20 minutes.
- Wednesday, December 9: Continued effects of the tax protest.
- Tuesday, December 15: Disabled streetcar at York Street creates 26 minute gap at Neville Loop.
- Wednesday December 16 & Friday, December 18: Bunching and short turning at Woodbine Loop cause 26 and 31 minute gaps, respectively, at Neville Loop.
- Tuesday, December 22: Medical emergency eastbound at Ossington caused a 27 minute gap at Neville Loop. A collision on Lake Shore at Burlington caused all service to be turned back at Humber with the result that service to Neville improved later in the evening because no cars were short turned.

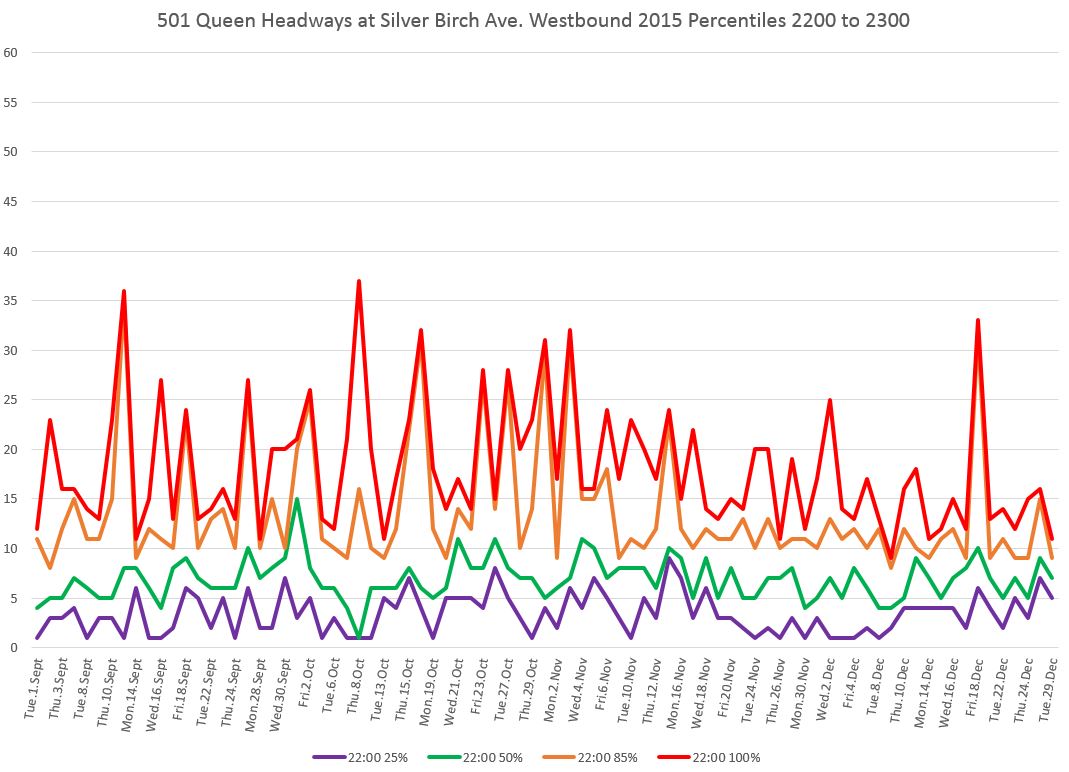
Late Evening:
The quality of late evening service at Neville in the fall of 2015 was slightly better than the early evening, in that the maxima among the headways were not as bad. but the minima are closer to the axis showing a lot of vary short headways. There is no pattern of day of week or month, and the only consistency is a mixture of very wide and very short headways, the classic gapped/bunched service.
2016: Service Split at Humber Loop, Construction Diversion Downtown May-December, Buses East of Coxwell for October-November
Schedules were revised in January not just for the split service, but to give added running time to streetcar service between Neville and Humber Loops. This improved service until the construction diversion via Spadina, King and Shaw began in May.
Running time was added to the schedules through the Spring and Summer, although this was not enough to compensate. In general, ten minutes were added to round trip times, but queues for turns especially at Spadina took longer than planned because of the lack of any transit priority.
Construction on Queen ran longer than planned, and new schedules were in place anticipating an early Fall finish. The diversion continued into early December, but there was no extra running time allowed and cars routinely ran late because of this. This diversion period is marked off by the vertical blue bars in the charts below.
From Thanksgiving weekend until late November, streetcar service turned back at Woodbine Loop and a bus shuttle operated to Neville while track work was in progress there. This period is marked off by the green bars. With this isolated service, the span of headways is considerably smaller and the various percentiles are more clustered around the median value. Even then, the service is ragged on some days, particularly late in this period. A review of the daily service charts (not included here) reveals that on some days buses were missing for part of the day, and those that remained appear to be running on their schedules rather then being spaced out to give even headways.
501_2016_SilverBirch_WB_HeadwayStats
AM Peak:
During 2016, the headways at Neville were better behaved than in the Fall of 2015, even during the period of the diversion. The major change was that the streetcars serving Neville no longer operated through to Long Branch, except late in the evening. (Note that there is a small gap in the charts because I do not have February data.)
During the latter part of the bus shuttle operation between Coxwell and Neville, there were four days when service was provided by fewer than the scheduled 6 buses. The remaining vehicles operated on their schedule causing gaps wherever buses were missing, rather than being evenly spaced.
- Tuesday, January 19: Disabled streetcar at Wineva Avenue.
- Thursday, March 24: Icy conditions delayed service.
- Friday, May 13: Bunched service eastbound from Roncesvalles developed into a 23 minute gap at Neville.
- Wednesday and Thursday, June 1 and 2: As above. Gaps of 26 and 27 minutes at Neville.
- Tuesday, August 16: Disabled streetcar at Lee Avenue.
- Fewer buses in operation than scheduled: Nov 2 (4), Nov 4 (2), Nov 14 (3), Nov 16 (4)
- Tuesday, November 24: Bunched service plus short turns caused a 24 minute gap at Neville.

Midday:
By midday, longer gaps at Neville are common, even with the shuttle bus service in the Fall. A particular problem arose when the streetcars returned because their scheduled running time was inadequate for the continued construction diversion west of Spadina.
- Tuesday, January 19: Bunched service plus short turns. 26 minute gap.
- Thursday, March 10: A parade diversion downtown led to bunching and short turns. 25 minute gap.
- Wednesday, March 30: Diversion and congestion caused by Rob Ford funeral. 38 minute gap.
- Tuesday, May 10: Bunching and short turns. 28 minute gap.
- Thursday, May 26: As above. 26 minute gap.
- Tuesday, May 31: Service blocked in the Beach. No eAlert was issued with details. 47 minute gap.
- Tuesday, June 14: Bunching and short turns. 29 minute gap.
- Wednesday, August 24: Medical emergency. 34 minute gap.
- Thursday, September 29: Unspecified delay eastbound near River. 29 minute gap at Neville.
- Buses missing from shuttle service on October 31, November 2 and 4. Only one (!) bus was operating on November 4.
- Thursday, November 24: Collision at Woodbine. 54 minute gap.
- Tuesday, November 29: Collision at Kingston Road. 25 minute gap.
- Thursday, December 1: Bunching and short turns. 26 minute gap.
- Tuesday, December 6: Congestion downtown plus an earlier disabled streetcar combined into bunching and short turns. 33 minute gap.

PM Peak:
There were so many days with gaps of greater than 20 minutes that I will not burden readers with a long detailed list. Almost all of this can be traced to the effect of the construction diversion west of Spadina coupled with an inadequate scheduled running time.
- Thursday, May 26: Collision at Kennilworth blocked service. 51 minute gap.
- Friday, November 4: Only 3 of 6 scheduled buses operating on the Queen East shuttle.
- Wednesday, November 16: A loss of electrical power on the east end of the route triggered the redeployment of the shuttle buses to operate further west. 46 minute gap at Neville.
- November 23 and 30, December 1: Many short turns left most service not operating east of Woodbine Loop.
- Thursday, December 15: Severe congestion across the route. 31 minute gap.
- Friday, December 16: Extensive service disruption due to a delay at Neville Loop and to other problems on the line. 40 minute gap.
- Monday, December 19: Congestion in the Beach. 28 minute gap.
- Friday, December 30: Collision at Waverley Road. Gap of almost two hours from Neville Loop ending at 5:23 pm.

Early Evening:
The evening service shows the same patterns seen earlier in the day. Although the median headways were typically below ten minutes, much wider headways would occur regularly.

Late Evening:

2017:
By the beginning of 2017, the scheduled trip time from Neville to Roncesvalles was close to or greater than the time allowed for trips to Humber at the end of 2015. The times were further increased in the March schedules for a construction diversion that did not actually occur. This is reflected in the less erratic service at Neville in early 2017.
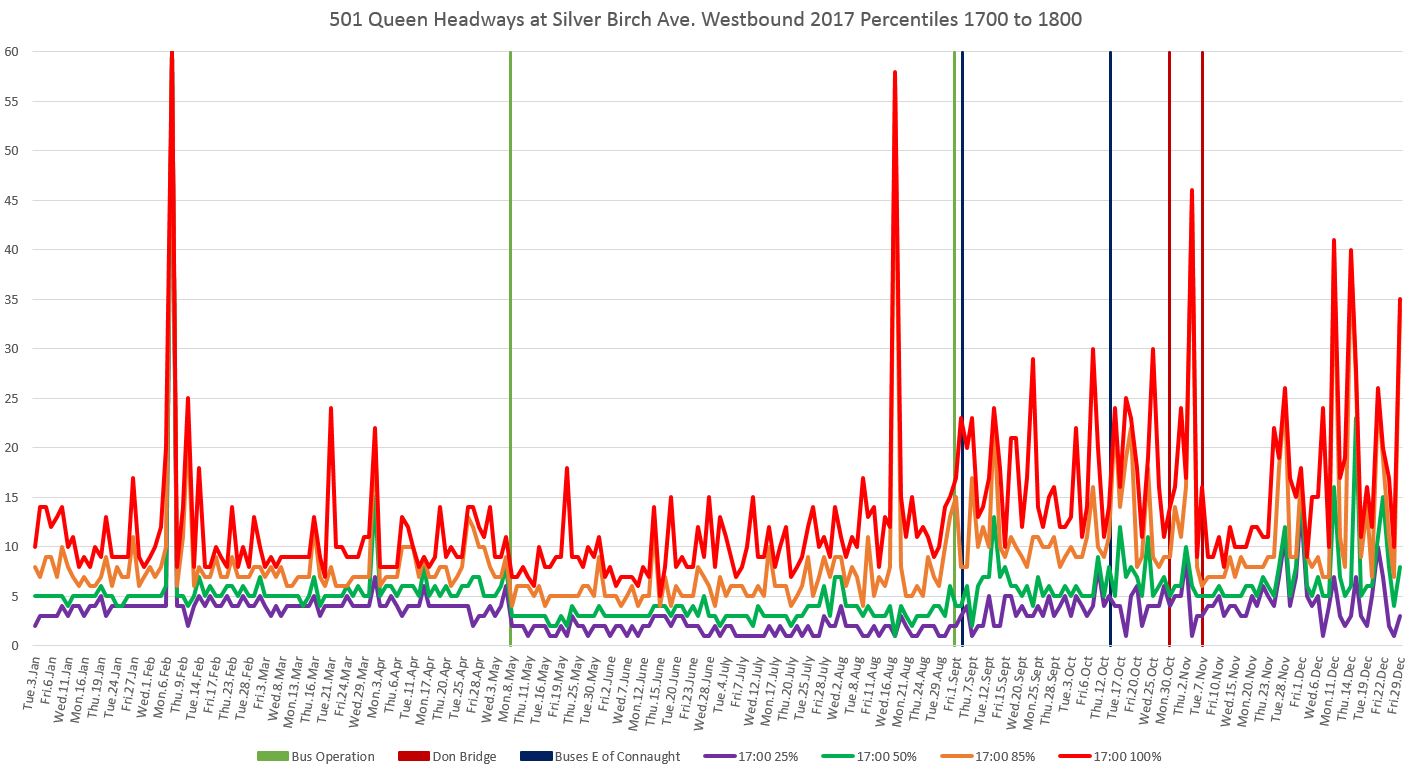
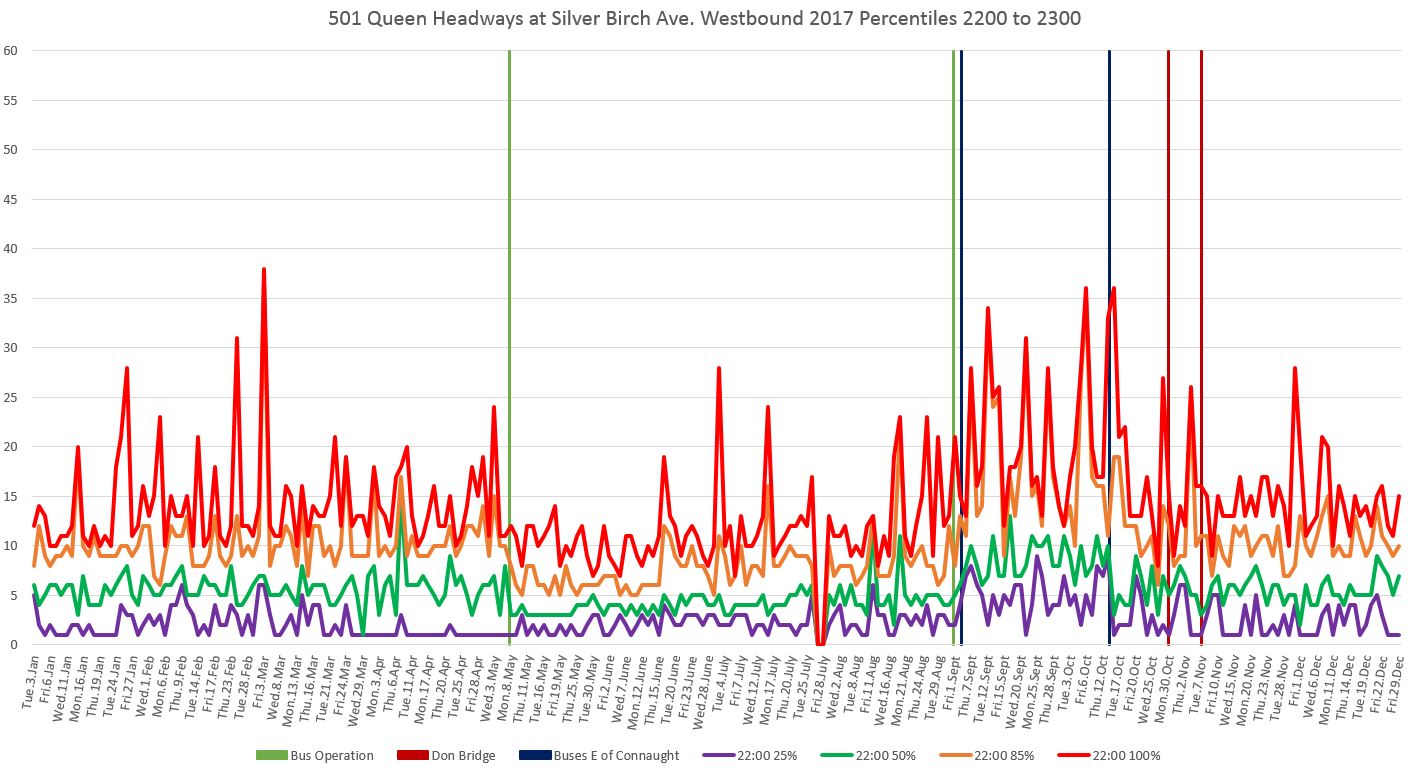
Buses operated the entire route from May to September (between the green bars in the charts). Buses operated nominally between River and Neville, although with some extensions further west, during intersection construction at Coxwell (between the blue bars in the charts).
Service diverted via Broadview, Dundas and Parliament during repairs to the Don Bridge at the end of October (between the dark red bars below).
501_2017_SilverBirch_WB_HeadwayStats
AM Peak
The effect of the additional running time on service reliability at Neville, both for streetcars and buses, is evident for the AM peak hour.
- Thursday, October 12: 38 minute gap caused by the extension of shuttle bus service during construction at Queen and Pape.
- Monday, November 13: Earlier delays west of Bathurst plus short turns at Woodbine Loop caused a 29 minute gap at Neville.

Midday
Service at midday is fairly well-behaved until the removal of construction-related travel time, and the onset of late Fall congestion in the core area.
- Tuesday, February 9: A car taking a long layover created a 19 minute gap westbound from Neville. The following car was short turned at Woodbine Loop, but did not split the gap, and instead came out behind the gap car westbound from Neville.
- Regular spikes of less than 20 minute through late January and early February appear consistently late in the week and appear to be associated with crew change problems at Russell Carhouse where cars either have a layover or go out of service.
- Wednesday, March 1,: A gap that was barely 10 minutes wide leaving downtown grew to 24 minutes by the time it reached Neville.
- Friday, March 24: Service held west of Carlaw. 26 minute gap.
- Wednesday, April 26: The combination of a diversion between Spadina and Church with short turns produced a 26 minute gap at Neville.
- Wednesday, August 9: Between about 12:30 and 1:30 pm, much of the eastbound 501 bus service short turned at Woodbine Loop creating a 34 minute gap at Neville.
- October 10-12: Irregular service caused by extension of bus shuttles during Queen/Pape construction.
- Friday, October 20: A major disruption to service downtown (no eAlert issued) caused diversions, short turns and a 39 minute gap at Neville.
- Wednesday, October 25: Several eastbound streetcars “disappear” from the tracking data just east of Woodbine and reappear in the same area westbound somewhat later. This is unlikely to be a GPS problem, but it could have been caused by operators “signing off” from CIS for some reason. The 53 minute gap in the chart is the result.
- Friday, October 27: Congestion east of Jarvis Street, gapped service and short turns combine to produce a 27 minute gap at Neville.
- Tuesday, October 31: A combination of a parade of three eastbound cars and one of these taking a long layover caused a 24 minute gap.
- Through November and December, congestion downtown led to many short turns at Woodbine Loop and corresponding gaps at Neville.

PM Peak
Congestion and service bunching are responsible for many of the peaks in the chart below. Only the worst instances of this are noted below. The problem is more striking in the Fall because of construction diversions.
- Tuesday, February 7: An ice storm shut down the east end of the Queen service for several hours.
- Friday, February 10: Severe congestion downtown. 25 minute gap.
- Thursday, August 17: Severe congestion downtown, bunching and short turns created a 58 minute gap.
- Friday, September 22: Five shuttle buses running in a pack. 29 minute gap.
- Wednesday, October 4: Shuttle buses running in pairs and taking long layovers. 22 minute gap.
- Tuesday, October 10: Construction at Pape. Shuttle bus service irregular. 30 minute gap.
- October 16 & 18: Bunched service. 24/25 minute gaps.
- Wednesday, October 25: Overhead repairs at Dufferin triggered a diversion causing irregular service. 30 minute gap.
- Friday, November 3: Overhead repairs at Broadview caused the Don Bridge diversion to be extended. 46 minute gap.
- Tuesday, November 28: Earlier delays/diversions for a disabled streetcar and overhead repairs caused erratic, bunched service. 26 minute gap.
- Monday, December 11: Severe congestion and bunching downtown. 41 minute gap.
- Thursday, December 14: Fire between Parliament and River. 40 minute gap.
- Friday, December 29: Severely bunched service eastbound from Roncesvalles. 35 minute gap.
Early Evening
Early evening service at Neville tends to be irregular thanks to short turns which attempt to correct the effects of the PM peak period. A chronic problem with the shuttle bus operation in September was that vehicles ran in pairs with large gaps quite commonly.

Late Evening
Late evening service, even when the route operated with buses, shows a familiar pattern of large maxima (red) and low minima (purple) in headways showing that service tends to run in bunches.
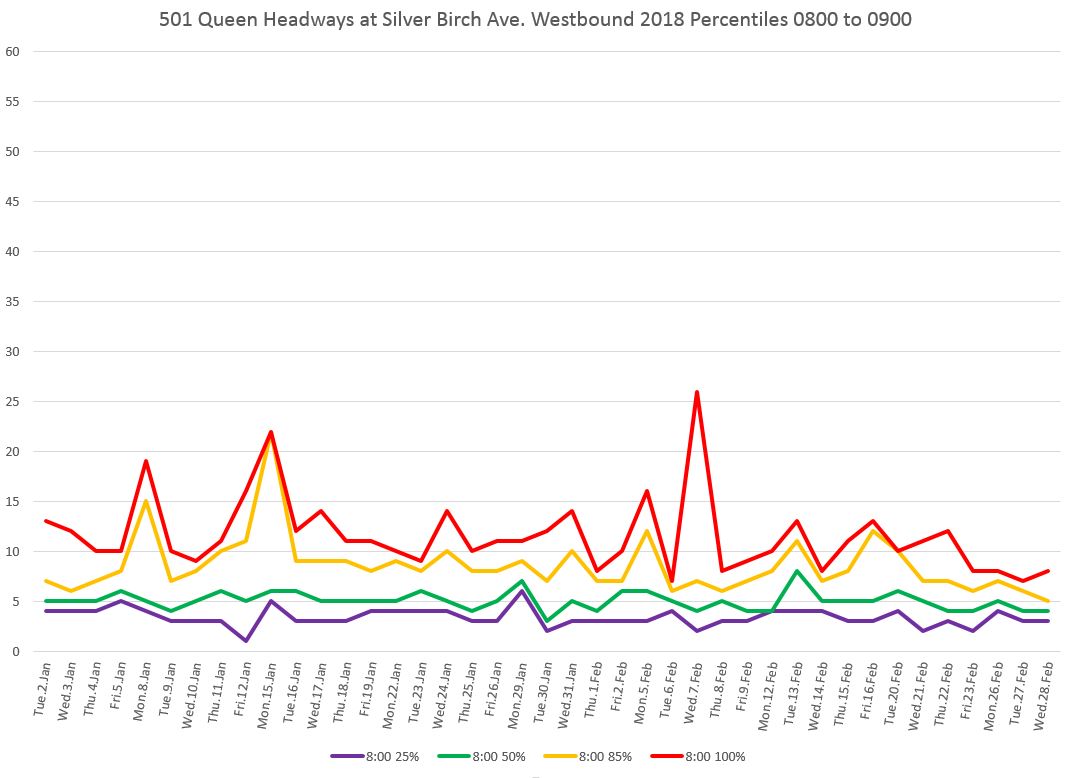
2018:
Schedules for the Queen car were changed in mid-February in anticipation of the line re-opening to Humber Loop, but service only operated to Roncesvalles. This added recovery time to the operation, and that should be reflected a reduction of short turns and greater flexibility in managing service. Although there is some indication of this in the data, the addition of March data, when available, will confirm this.
501_2018_SilverBirch_WB_HeadwayStats
AM Peak
- Monday, January 8: Bunched service eastbound from Roncesvalles. 19 minute gap.
- Monday, January 15: Auto collision near Parliament. 22 minute gap.
- Wednesday, February 7: Collision near Elmer. 26 minute gap.
Midday
- Monday, January 8: Bunched service plus a short turn created a 27 minute gap.
- Wednesday, January 10: Delay at University eastbound. 32 minute gap.
- Thursday, January 11: Bunched service. 22 minute gap.
- Friday, January 12: Bunch service. 25 minute gap.
- Tuesday, February 13: Medical emergency at Neville Loop. 31 minute gap.

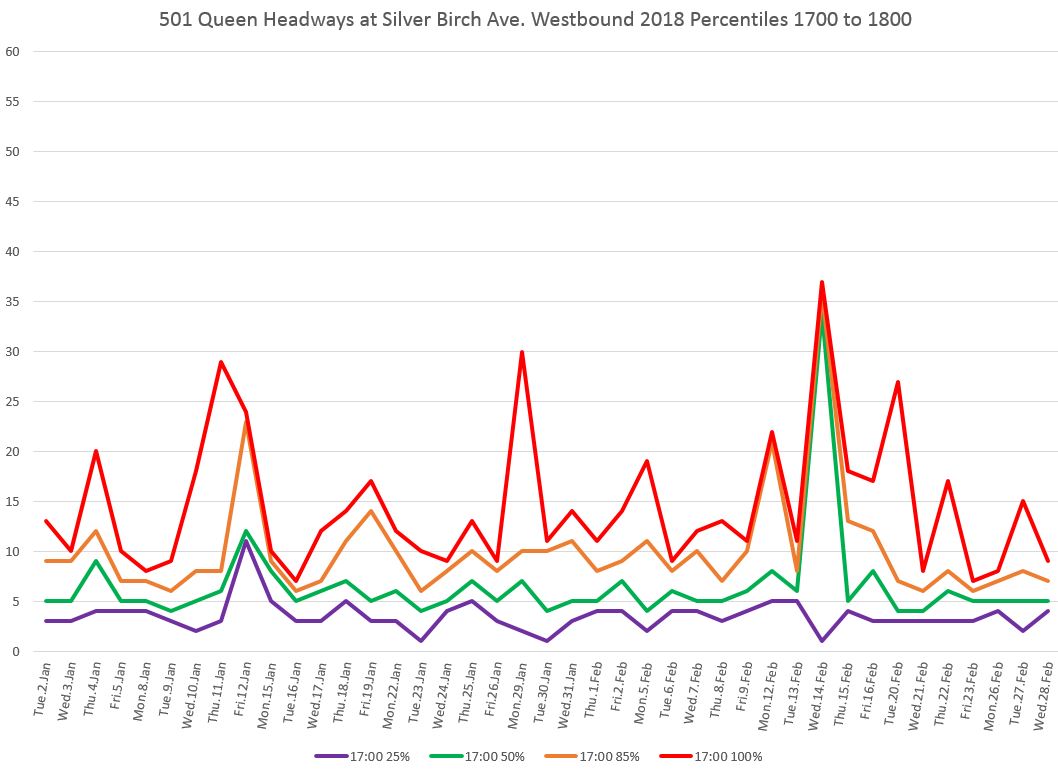
PM Peak
- Thursday, January 4: Bunched service. 20 minute gap.
- Thursday, January 11: Bunched service. 29 minute gap.
- Friday, January 12: Bunched service. 24 minute gap.
- Monday, January 29: Bunched service. 30 minute gap.
- Monday, February 12: Severe congestion downtown. 22 minute gap.
- Wednesday, February 14: Severe congestion, a medical emergency at Empire, and a disabled streetcar at Neville combined to disrupt much service at Neville during the 5-6 pm period. The largest gap was 37 minutes.
- Tuesday, February 20: Collision at Ontario. 27 minute gap.
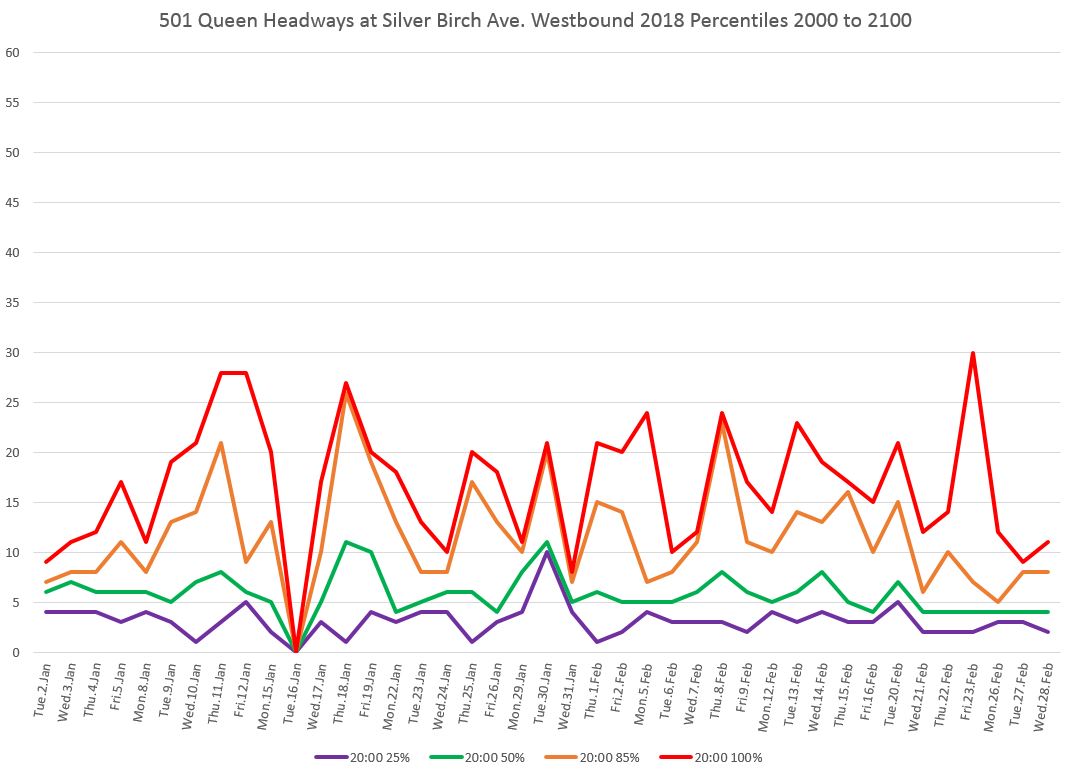
Early Evening
- Wednesday, January 10: Bunched service. 25 minute gap.
- Thursday, January 11: No streetcars left Roncesvalles eastbound from 6:58 to 7:28 pm. There was no eAlert explaining why such a backlog of cars accumulated there. The gap at Neville Loop an hour later was 25 minutes.
- Tuesday, January 16: No service operated east of Woodbine Loop for over an hour, and therefore no headways were clocked westbound from Neville during the 8-9 pm period. The total gap at Neville was approximately 90 minutes. No eAlert explaining this event was issued.
- Thursday, January 18: Bunching and short turns. 28 minute gap. This pattern continues through January and into February.
- Friday, February 23: A collision at Fuller (between Lansdowne and Roncesvalles) caused a diversion via King and Shaw. 30 minute gap.
Late Evening
The longer maxima in the chart below are mainly the result of bunching in service.
- Thursday, January 18: Stalled streetcar at Elmer. 33 minute gap.
- Tuesday, February 20: A delay westbound at Shaw (no eAlert issued) echoed back to Neville later in the evening producing a 24 minute gap.


This has probably been covered before, but I missed it. I understand why the drivers think that it’s great fun to bunch up. I don’t understand why TTC management is afraid to bring an end to the party.
Steve: I am not sure that TTC management wants to (a) staff at the level needed to manage all of the major routes, and (b) admit that service can be managed rather than blaming everything on “congestion” and other external factors.
LikeLike
Well, I guess “scheduled for Humber but turning at Sunnyside” explains why there always seem to be a good half-dozen streetcars laying over west of Roncesvalles, not just in the loop but also in both directions on The Queensway.
LikeLike
Great article. I’m wondering if it would be helpful to produce and post a hypothetical graph of what service should look like/aim to achieve to compare the many graphs in these types of posts. Thanks.
Steve: That’s a bit tricky because the nature of the graphs would depend on the amount of leeway one would allow in actual vs scheduled headways. There is the more general TTC problem of whether cars should be “on time” on merely on or close to the scheduled headway. Finally, there is a basic fact of life: there will be delays, and it is how one recovers from these delays that can make a big difference.
LikeLike