From time to time, there are reports and photos in social media of crowding conditions on the two principal night bus services, 300 Bloor-Danforth and 320 Yonge. The TTC responds in its usual way saying that they monitor crowding and assign extra buses as needed, but they do not address a fundamental problem: buses on these routes run in packs with gaps that cause overloading. The situation is at least as bad, if not worse, than on daytime routes.
In past years, I have not been able to review night route performance because the old CIS tracking system fairly routinely went offline for a few hours most nights at about 3 am leaving a big gap in the data. The Vision system has far fewer outages, and gives a full view of how the service behaves.
The TTC now provides crowding data to some of its online service apps such as Rocketman, but this information is not yet available on an historical basis for review alongside the vehicle tracking info. Correlation of gaps and crowding must be done in real time, something that is not practical for month-long retrospectives. There is no announced date for crowding data to be available for research outside of the TTC.
As I have shown in other articles, headways might be within “standards” at the terminal, but they deteriorate as vehicles move along their routes. Moreover, the TTC averages data from all routes and time periods. The modest contribution of the night buses to overall “on time” performance is quite small. Nothing in the TTC’s methodology identifies problem routes, locations and time periods.
As with the daytime service, the cheapest form of additional capacity is well-managed service with vehicles arriving on regular headways spreading the load evenly.
The City of Toronto, TTC and Waterfront Toronto will be holding an online consultation to bring interested parties up to date on plans for the Waterfront East LRT. Links to register for and join the meeting online are available at the City’s Waterfront Transit page.
This round will cover the following topics according to the City’s announcement:
Initial design work for the extension of Queens Quay from Parliament Street to the Distillery Loop, including options for getting under the rail corridor
Design updates for the surface section on the LRT and Queens Quay East streetscape, including an update on the Yonge Street Slip
Progress update on the design of the underground section of the LRT from Union Loop to the proposed portal locations on Queens Quay East, and a new design concept plan for Bay Street following completion of underground works
An update on project phasing and implementation
An overview of the upcoming Transit Project Assessment Process (TPAP) for the project
An update and a summary of feedback from the February consultations
Materials from past consultations are available on the City’s page linked above.
Many routes will see service changes with the June-July schedules coming into effect on June 20, 2021.
The changes lie mostly two areas:
Improvements to or cutbacks in service in response to pandemic-era demand.
Reliability improvements with increased or decreased travel times.
The majority of the updates are on weekend schedules.
A few notable changes are described here, but readers should refer to the full spreadsheet of changes linked below to see what is happening on individual routes.
In preparation for the opening of the 5 Eglinton Crosstown and 6 Finch West LRT lines, routes now bearing these numbers have been changed.
5 Avenue Road is now 13 Avenue Road
6 Bay is now 19 Bay
Queen Street West Water Main and Track Construction Projects
The replacement of track and some water mains on Queen from Bay to Fennings (between Ossington and Dovercourt) is an ongoing project that will run until December 2021. The City’s construction plan is to occupy single blocks of Queen Street at a time during which all planned work will be completed. Temporary CafeTO patios will be removed as each block is rebuilt.
Work will begin westward from Bay to Spadina from June to August, and will then shift to work east from Fennings to Spadina from August to December. For the staging plan, please see the City’s project web page. 501 Buses will divert around construction areas as needed.
The 501P Park Lawn service has been shortened to loop at Humber Loop using an old TTC loop at The Queensway and High Street to turn around and access the bus loop at Humber from the west. This change is already in place, and will formally be part of the schedule on June 20.
King West 504Q Bus Shuttle
The 504Q shuttle from King/Queen/Triller has been extended from Sudbury Street to the loop at Princes Gates. This change is already operating and will be formally in the June 20 schedule.
A Note About “Reliability” Improvements
Since pre-pandemic times, the TTC has been adjusting schedules by adding running time, often at the expense of wider headways, to ensure that very little service has to be short turned. This has the unwanted effect of causing vehicles to bunch at terminals where there may not be room for them, and for operators to regard departure times as somewhat elastic because they know they will soon be ahead of schedule thanks to the padding.
Several of the changes in the June schedules reduce scheduled running time to claw back provisions that are not required under current traffic conditions. At the same time, the scheduled headways might go up or down depending on current demand on the route. Each route and time period is different in this respect, and readers should look at the spreadsheet for the details.
Recovery Time
In the spreadsheet, running times are shown in the format “A+B” where “A” is travel time from one terminus to another, and “B” is the “recovery time” if any at the terminal.
There is no formula or policy rationale behind the length of recovery times, and in some cases none is provided in the schedule. In other cases, very long recovery times are side effects of scheduling branching services.
For the schedule to “work”, the round trip time (RTT), including recovery, must be a multiple of the headway. When a service has branches, each branch’s RTT must be a multiple of the headway. In cases where buses switch between branches, the RTTs for both branches will be a multiple of the common headway plus half a headway, and there will be “half buses” assigned to each branch. This works because the RTTs for the two branches add up to a multiple of the common headway.
For example, the midday service on 79 Scarlett Road operates every 24 minutes on each branch with a 60 minute RTT. Buses alternate between two branches, and so one complete cycle takes 120 minutes which is a multiple of 24. The vehicle assignment for each branch is 2.5 buses.
In order to make this sort of scheme work, particularly for infrequent services, “recovery” times are adjusted up and down in schedules as needed. They have little to do with actual operating conditions or the need for flexibility in handling traffic effects.
In particular, there is no contractual requirement for the TTC to provide any recovery time, and operators on routes with tight schedules make do as best they can. This creates problems for “on time” metrics.
600 Run as Directed Buses
The spreadsheet includes a list by division of the “600” buses commonly known as RADs. The number of RAD crews varies by day of the week, but for June-July there will be 127 of them on weekdays.
It is common for the TTC to talk about these buses being deployed around the system as if they are all in service at the same time. In fact, the crews are broken into time periods, and roughly speaking one third of the RADs exist at any one time. This means that the number of buses available to handle surge loads or the occasional subway service replacement is not as large as TTC claims might imply.
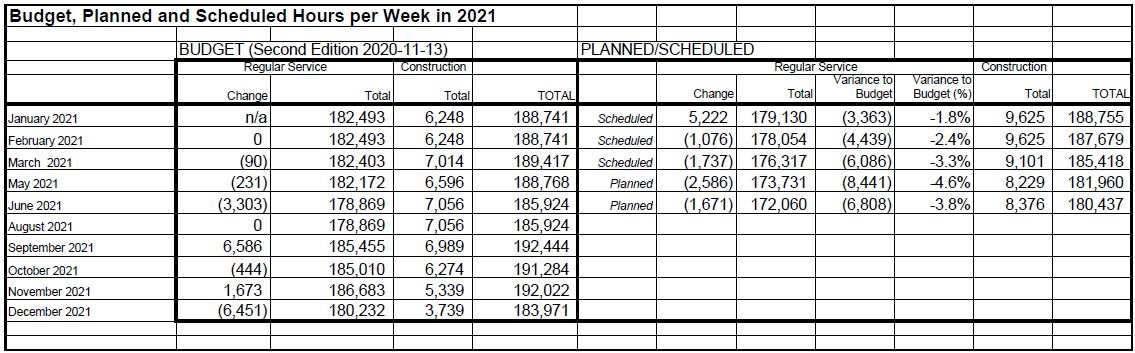
Service Planned vs Budgeted
The regular service planned for June-July is about 3.8 per cent below the budgeted level due in part to ridership not returning system-wide at the expected rate.
Construction service is up by about 19 per cent over budget, although this is a charge on the capital projects rather than operations.
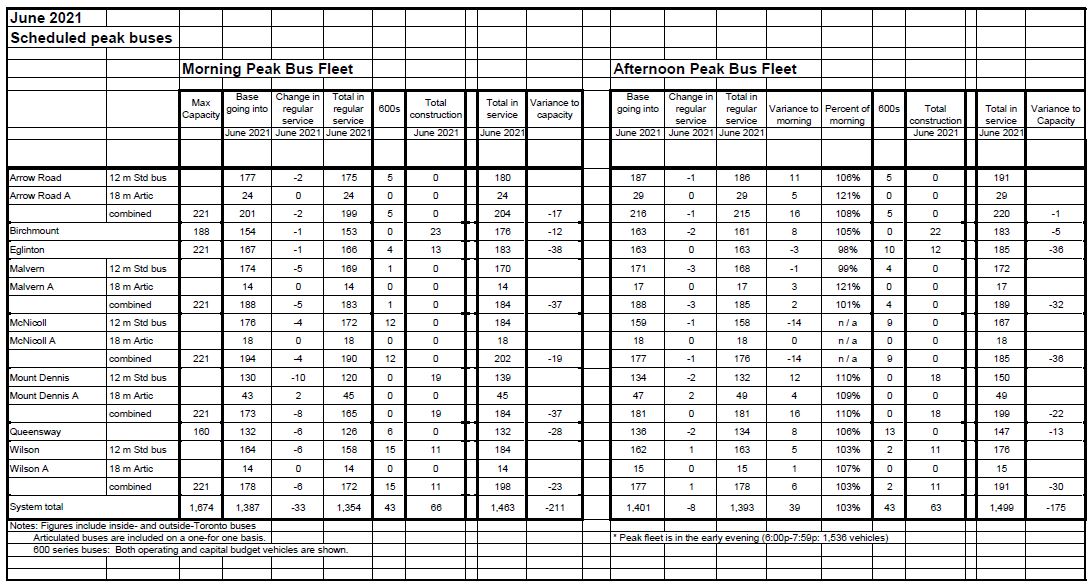
The peak bus fleet in service, including RADs and construction buses is 1463 in the AM peak, 1499 in the PM peak. This is 211 and 175 buses, respectively, lower than the available fleet of 1674, which in turn is well below the total fleet of over 2000 allowing for maintenance spares at about 20 per cent.
A footnote in the table below shows that the peak fleet utilization is actually 1536 buses, slightly higher than the “total in service” of 1499. The reason for this is that there is an overlap between buses running out of service at the end of the peak and those that come newly out of garages at the same time.
There is ample room in the existing fleet to operate more bus service, but this would require additional subsidy.
The streetcar fleet is underutilized because of major construction projects, pandemic service cutbacks and a major overhaul project.
In an unusual move for a public agency, Metrolinx published a blog post seeking to set the record straight on various issues about the combined Ontario/GO line corridor through the Riverside/Leslieville area.
The article begins from the premise that there is misinformation about the project:
There’s a lot of anticipation about how the Ontario Line will make it faster and easier to move around the city, but there’s also a lot of speculation and inaccurate information floating around – particularly when it comes to the vibrant communities of Riverside and Leslieville. All of this conflicting information can be confusing, so let’s take some time to sort the myths from the facts.
Sorting myths from facts can be challenging with Metrolinx because they are notoriously reluctant to share information. When they do hold public sessions, it is common to find staff do not fully understand their own project, or worse refuse to talk about contentious parts of it. They seek cheerleading, not consultation.
Metrolinx quite openly implies that community groups are putting out false information:
If you hear something about the Ontario Line that doesn’t sound right, you can find a source of truth about the project at Metrolinx.com/OntarioLine.
…
“I want people to know they can come to us at any time to get the facts about the project and what it means for them,” says Malcolm MacKay, Program Sponsor for the Ontario Line.
“There is definitely some speculation and inaccurate information going around, and we want people to base their opinions and feedback on the most up-to-date plans.”
What does Metrolinx claim in their article, and how does this stack up with the real world?
Updated August 4, 2021: Metrolinx has begun installation of a test strip of grass at the Golden Mile stop (Warden). See their blog article The Eglinton Crosstown LRT is going green.
With the recent interest in testing activities on the Eglinton Crosstown, and the inevitable flurry of photos that will appear in coming weeks, a question popped up on social media recently: where is the grass?
Illustrations of the line’s eventual state vary, but there are two examples below that clearly show a grassed right-of-way, at least in some locations. [Source: Early Works Open House Presentation]
I asked Metrolinx about the extent of the line that will be grassed, and when we might see more about this. Here is their reply [email from Metrolinx Media Relations, June 1, 2021]:
There will be grass across the full width of the Guideway, with the exception of bridges and underpasses, Stop platforms, intersections, and where roadway vehicular, pedestrian and/or emergency services access is required.
Plant material of the Green Tracks shall be selected from suitable species of sedum or grass that are low maintenance and resilient to track conditions such as drought, salt, frost and cold, urban pollution, heat, and pulling wind forces of the vehicle.
Vegetation surface of the Green Tracks shall be harmonized with the whole track system.
We’ll have more details to share closer to the project’s completion.
Thanks to the pandemic lockdown, I have not been out and about to photograph construction projects in my usual style. For readers who do not normally browse the Urban Toronto site, there are two threads with photo coverage of the work at King-Queen-Queensway-Roncesvalles.
Some of the early works are illustrated in this post started by “Drum118”. Visible in some shots here is the fact that on the approaches to the intersection, the TTC only had to remove the top (of three) layers in the trackbed to expose the existing steel ties and the attachment points for Pandrol clips to hold the new rails. This is the benefit of a previous round of construction to new standards. At the intersection, they went deeper.
A fine collection of photos of the intersection itself was posted by “Kotsy” showing the progression as the new intersection took shape. This includes the realignment of the curves in the southwest quadrant that will permit a new intersection geometry eliminating the slip lane for eastbound traffic from The Queensway to King that is dangerous to pedestrians. Yet to come is the new farside eastbound loading zone as a Roncesvalles-style bump out sidewalk, and the revised southbound sidewalk configuration.
Drawings of the planned new layouts for this area are in my April 2020 article. Here is the one for the intersection itself. The “as built” version, based on Kotsy’s photos, appears to be slightly different from this drawing probably due to fine tuning in the design since this 2019 version.
This is only the first stage of a complex project that will extend west through the leads to Roncesvalles carhouse, Sunnyside Loop and The Queensway west to the existing right-of-way at Parkside Drive.
The April 2020 article also includes photos from the last reconstruction in 2000.
Harold McMann sent me a set of photos taken at various times during the intersection’s reconstruction. Here is a selection of these. Items of note:
In the first view west on Queen, note the exposed mounts for Pandrol clips. This is the top of middle layer of the track structure, and the mounts are part of the steel ties embedded in the concrete.
For the central part of the intersection, the excavation is deeper for the installation of a new foundation slab. The “new” style of track construction began sooner on tangent track such a that east of the intersection than for intersections. The old intersection dates to 2000.
The May 19 view looking SW across the intersection shows a pre-assembled panel of track sitting on a trailer waiting to be lifted into position.
The May 23 view looking S on Roncesvalles shows how the southbound track has been realigned further west as part of the lane and stop reconfiguration. The new intersection at the north gate of Roncesvalles Carhouse will align with this.
In the views looking east to Queen and King, the island that forms the existing slip lane (currently used by traffic between King Street and The Queensway) will be removed in a future phase and the sidewalk will be extended to normalize the geometry of the intersection for pedestrians as shown in the drawing above.
Many thanks to Harold for providing these!
W on Queen to Roncesvalles May 10/21
NW on King to Queensway May 10/21
E to Queen and King May 13/21
N across Queen to Roncesvalles May 13/21
E to Queen and King May 14/21
Diamond and east leg installed May 17/21
E on Queen May 19/21
N across Queen May 19/21
W on Queen to Roncesvalles May 19/21
W on Queen across Roncesvalles May 19/21
SW across Queen May 19/21
E on Queen May 20/21
N across Queen to Roncesvalles May 20/21
SW across Queen May 20/21
S on Roncesvalles to Queen May 23/21
W across Roncesvalles May 27/21
King-Queen-Queenswa-Roncesvalles Construction Photos by Harold McMann
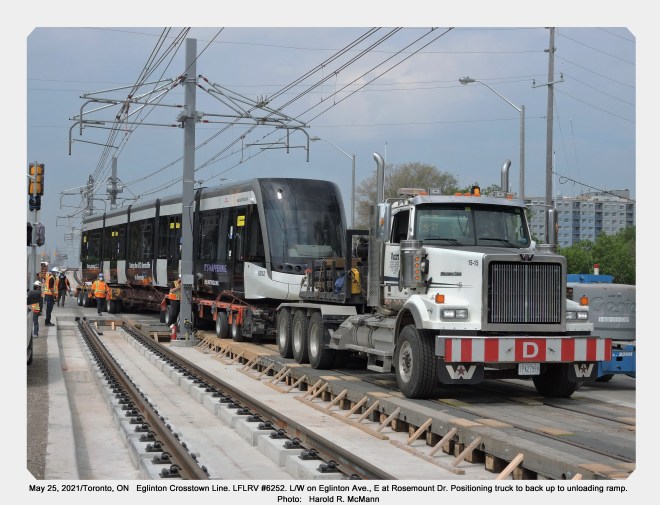
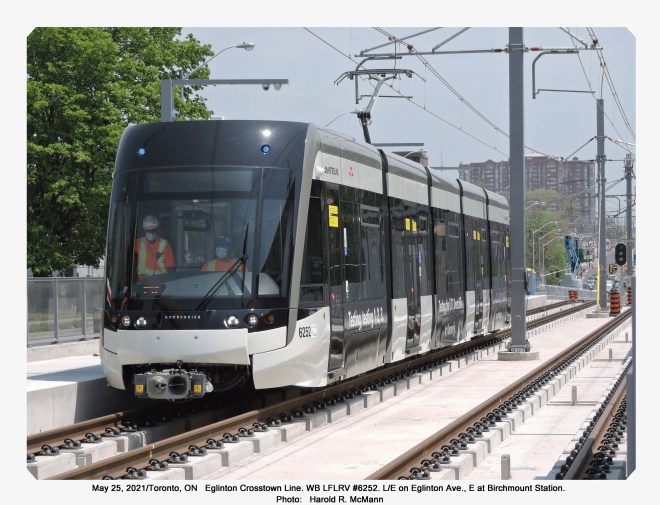
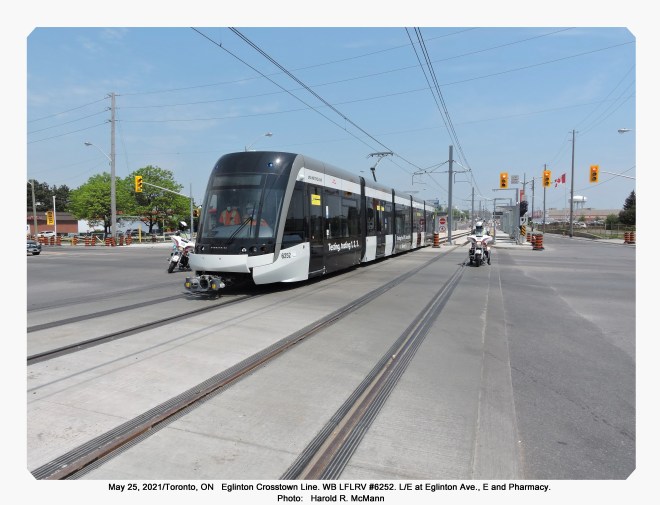
On May 25, 2021, Metrolinx moved the first of its test LRVs from the Mount Dennis maintenance facility at the west end of the new Eglinton Crosstown route to the more-or-less completed section of the line between Brentcliffe and Birchmount. This move was done by truck and trailer as the central tunnel section is not yet available. There is no definitive date for the tunnel to open for testing all the way east to Brentcliffe Portal, let alone for revenue service.
The cars are delivered to a temporary ramp installed at Rosemount Drive (between Birchmount and Ionview) where they are unloaded. From that point, they run under their own power.
Initial testing will be at low speed to check clearances and track geometry, and Metrolinx will then move up to regular service speeds and train operation. When cars are not out on the line for tests, they will be stored inside of the tunnel west of Brentcliffe portal.
Photos and videos of this event are on the Metrolinx Blog, and a selection sent to me by Harold McMann (to whom much thanks!) appears below.
And, yes, of course they are “Light Rail Vehicles”. A rose by any other name …
This article should be read in conjunction with Headway Quality Management: A Proposal for which this is a response to some questions and suggestions in the comments, and adjustments of my own in the interim. Specific routes discussed here are:
52 and 952 Lawrence West local and express services
504 King streetcar service (December 2020 before the diversions now in place for construction work)
Changes in format include:
Better spacing of the columns in the headway distribution charts for clarity,
Separation of the AM and PM peak periods for an express service that only operates for a few hours of each period, and
Changes in the layout and colour scheme of the headway distribution charts to emphasize the portion of service that lies within the target band of headways.
Both routes reviewed here show the problems of branching services and wide differences in scheduled service. A service may look “good” where all of it branches overlap, but be much less reliable on the unique segments. Vehicles may or may not be “on time”, but service riders experience does not accord with the TTC’s claims of high reliability. Indeed, there are cases where schedules contain built-in gaps that exist as part of blending services and managing transitions between service periods. They “work” for the schedule, but not for the rider.
One can argue that my proposed methodology should be adjusted with narrower or wider target bands. That’s easy to do, but the important issue here is to measure service as riders actually experience it, looking at various points on routes and all times of the day. The TTC’s scheme of looking only at terminals and averaging results over all time periods buries variations in service quality that riders know all too well.
Debates on the effect of Metrolinx service expansions often turn on noise and vibration effects, the degree to which any new or modified service will change the communities through which lines pass. Nowhere is this more striking than in Toronto’s Riverside district where an existing three-track GO corridor will be widened with a fourth GO track plus two Ontario Line tracks.
Reviews of the effects along the GO and OL corridor are hundreds of pages long for those who have the stamina to dig through appendices in so-called environmental reviews, but the material is inconsistently presented. Three separate projects affect this corridor, but no study considers the combination of three services.
This is a major oversight, and it hobbles any public consultation. Metrolinx appears either unable to answer valid questions about the effects of new services, or worse unwilling to reveal information that they should already have. Past experience makes communities distrust what Metrolinx says especially if “consultation” sounds more like cheerleading for decisions made long ago by sage transit wizards.
Updated 4:15 pm: Due to an error in a spreadsheet, the summary counts are off a bit because existing service was included in future totals. This has been fixed.
On Tuesday, May 25, 2021, the TTC will hold a special meeting to confirm that it will purchase the full 60 additional streetcars proposed in their 2020 Fleet Procurement Strategy and Plan. 13 of these cars are already on order thanks to funding from the City of Toronto, and the remainder will come thanks to recently announced funding from the provincial and federal governments.
The project budget includes a placeholder amount of $100 million for the proposed renovation of Harvey Shops at Hillcrest as a small carhouse for about 25 cars. The remainder of the 264-car fleet will fit within existing carhouses at Leslie, Roncesvalles and Russell once renovations are complete at the two older sites.
The costs will be shared among all three governments as shown below:
Updated May 22, 2021:
The TTC’s Interim CFO, Josie La Vita, commented:
As part of their year end process, the City annually reviews its accounts. There was funding left in a reserve dedicated to TYSSE that had not been fully utilized. The reserve can only be used for TYSSE purposes. By applying those reserve funds to TYSSE expenses this frees up the debt that was being used to fund those costs and now can be used to fund other expenditures.
Source: Email from Stuart Green, TTC Senior Communications Advisor
Based on the January 2020 level of service on 512 St. Clair (20 cars), that route would use all of the cars proposed for storage at Hillcrest. The project estimate does not include any allowance for the dead-head time that will be saved with a yard much closer to the route than today, and this should be shown as an offsetting saving to the capital cost.
With a fleet of 264 cars and a target spare factor of 18 percent, there should be 224 cars available for service. In January 2020, the peak streetcar service was only 142 cars, partly because the first third of the Flexity fleet is going through a major overhaul to correct manufacturing defects. The change will represent an increase of almost 60 percent in the available fleet. Now all the TTC needs is riders to fill these cars, and operators to drive them.
Although there have been proposals for reconfigured streetcar routes in the past, there is nothing definite on that score. A related issue is the timing of the Waterfront East and Broadview streetcar extensions for which a completion date keeps drifting into the future.
The TTC estimates that this change will also release 50 buses that can return to that network. More buses run on streetcar routes today (about 70 at peak), but that is due to construction projects which tend to occur during periods when the full bus fleet is not required (summer schedules).