In a report to City Council’s meeting on December 17, we learn that the cost of the five remaining “SmartTrack” GO stations has risen above previous estimates. See:
Here is a map showing the five stations that remain in Toronto’s SmartTrack program.
The cost and funding shares are shown below.
Date
Toronto
Ontario
Canada
Total
Original
$0.878B
$0.585B
$1.463B
June 2023
$0.878B
$0.226B
$0.585B
$1.689B
The Province has now discovered that the five stations cannot be built within the available funding, and the City Manager recommends that that three of the five be retained as City priorities: East Harbour, Bloor-Lansdowne and St. Clair-Old Weston. The rational behind the choice is:
East Harbour will be a major hub linking GO Transit, the Ontario Line and future surface transit including the proposed Broadview-Commissioners link to the Port Lands.
St. Clair-Old Weston will be serve an important node in the City’s planned revitalization and urbanization of that area.
Bloor-Lansdowne does not have such a strategic significance, but it is already under construction and is likely a less-expensive station compared to others like East Harbour and Liberty Village.
For the remaining two stations at Liberty Village and Finch East, the report recommends that Council:
[…] request that the Province identify a funding solution, including exploring funding opportunities with the Government of Canada, to deliver the Finch-Kennedy and King-Liberty stations at no further cost to the City. [City report at p. 4]
We do not know cost estimates for individual stations as these are in a confidential appendix thanks to Metrolinx’ desire for secrecy. As of June 2023, the cost for five stations averaged $338 million, and is obviously higher now. Taking available funding and dividing by three, instead of five, yields a cost of $563 million. These are surface stations, not underground, although some of them involve work beyond the station structures proper. For details, refer to the technical backgrounder.
The report gives no indication of Metrolinx’ position on this scheme and whether they would simply drop the two stations, or proceed on their own with stations that originally were expected to be “free” contributions to GO’s capital program by the City.
A related problem is that from the Federal point of view, it does not matter whether their money pays for a new GO station, subway trains, or any other project. It all counts against Toronto’s “share”. This has bedeviled transit schemes in the past. Council always has its “priorities” and assumes that everything that comes along will get at least a 1/3 share from the Feds. This is not necessarily a valid assumption given competing Federal priorities, not to mention a possible change of government. If the Feds won’t come to the table, the Province may also hold back on funding as they did with the new subway car purchase making their contribution contingent on a Federal commitment.
If the Feds do kick in whatever extra is needed, what other Toronto projects will go unfunded because our share was burned up on SmartTrack?
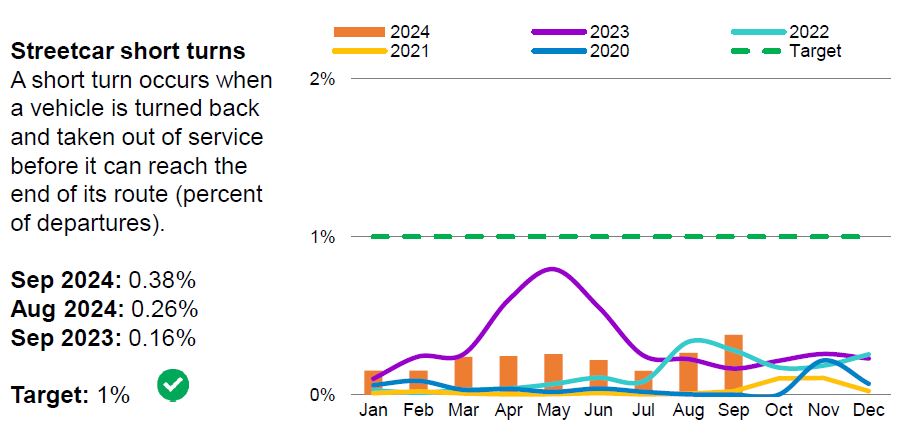
In the monthly CEO’s Report, one of the KPIs (Key Performance Indices) is a measure of the number of short-turned streetcars. This used to be reported as an absolute count, but is now expressed as a percentage of all trips.
Here is the most recent version:
This chart is a fiction born of the Rick Leary era when, in theory, all short turns were banned and the stats were made to fit the objective. Like many KPIs, this suffers from a combination of system-wide consolidation across all routes and time periods, as well as under-reporting of what is really happening.
An easy way to get the true count is to look at tracking data and compare two points on either side of a short-turn location. For example, Woodbine Loop at Queen and Kingston Rd. is a favourite spot for 501 Queen and some 503 Kingston Road cars to turn back. Counting the number of vehicles crossing Coxwell (west of the loop) with the number at Woodbine Avenue (east of the loop) shows how many cars did not travel east of Kingston Road and, therefore, were short-turned.
The TTC claims that they better their 1% target for trips short turned, but it is clear that they rarely achieve this. In some cases, the value rises above 20% indicating that although much service does get to the terminal, there is a good chance that a rider will encounter a short turn. This is separate from frustrations caused by gaps and bunching.
Short turns happen for many reasons including traffic congestion, too-tight schedules, service blockages for collisions, medical problems, parades … it’s a long list. Riders really don’t care. The basic point is that service they expected to receive is not there, and usually with no advance warning.
The table below summarizes the statistics from the vehicle tracking records in November 2024 for the period from 6am to midnight. It is clear that even on an aggregated level, the proportion of short turns is much higher on these routes that the TTC KPIs indicate.
Updated Dec. 6/24 at 1:30pm: Short turn counts for 504 King eastbound, 507 Long Branch and 508 Lake Shore westbound trips added.
Note: The legends on the original charts in this post were misleading. They have been changed to better reflect what the columns and lines on the charts represent..
Route
Location
Total Trips
Short Turns
% Short Turns
501 Queen
Woodbine Loop EB
3547
198
5.6%
Roncesvalles WB
3537
247
7.0%
503 Kingston Rd
Woodbine Loop EB
3252
136
4.2%
504 King
Spadina WB
6453
256
4.0%
Roncesvalles WB
3275
364
11.1%
Church EB
6319
126
2.0%
Parliament EB
6198
204
3.3%
Dundas EB
2943
71
2.4%
505 Dundas
Parliament EB
3040
212
7.0%
Lansdowne WB
3062
397
13.0%
506 Carlton
Coxwell EB
3031
293
9.7%
Lansdowne WB
3256
572
17.6%
507 Long Branch
Kipling WB
2074
88
3.0%
508 Lake Shore
Kipling WB
193
19
9.8%
512 St. Clair (*)
Lansdowne WB
2068
249
12.0%
Oakwood WB
2113
122
5.8%
(*) For 512 St. Clair, only data from November 14 onwards when streetcar service was restored are included.
At the TTC Board meeting on December 3, Chair Jamaal Myers proposed a motion to extend the validity of legacy fares (tickets, tokens, day passes) to June 1, 2025 for the “conventional” system, and to December 31, 2025 for WheelTrans. This was adopted by the Board.
After the meeting, in a press interview, Myers was asked “Why June 1”?
He answered that June 1 was the earliest possible opening date for Line 5 Eglinton Crosstown and Line 6 Finch. Those lines have no fare collection support for the old fare media.
This puts Metrolinx in a bind: either they announce an earlier date, something they have been loathe to do for months, or they acknowledge that we will not ride these trains until late Spring, maybe. If Doug Ford holds an election as expected, there will be no ribbon cutting for him to tout his great works.
Updated Dec. 4/24 at 6:10pm: In today’s Star, Myers qualified his statement:
TTC chair Jamaal Myers told the Star on Wednesday that the TTC is preparing to operate the Eglinton Crosstown and Finch West LRTs using an internal target date of early June next year — though he was careful to note that he does not speak for Metrolinx, the provincial agency in charge of constructing both beleaguered light-rail lines.
Myer added that the June target date was set separate from Metrolinx’s construction timeline, and was solely for the TTC’s internal preparations to take over operations once the LRT is ready.
He said TTC staff are using June 1 as a target date to train the LRT drivers and it includes a 30-day “revenue service demonstration,” which will see trains run along the full track of the LRT. The internal target dates were partly created for financial planning purposes and are not specific to the LRT.
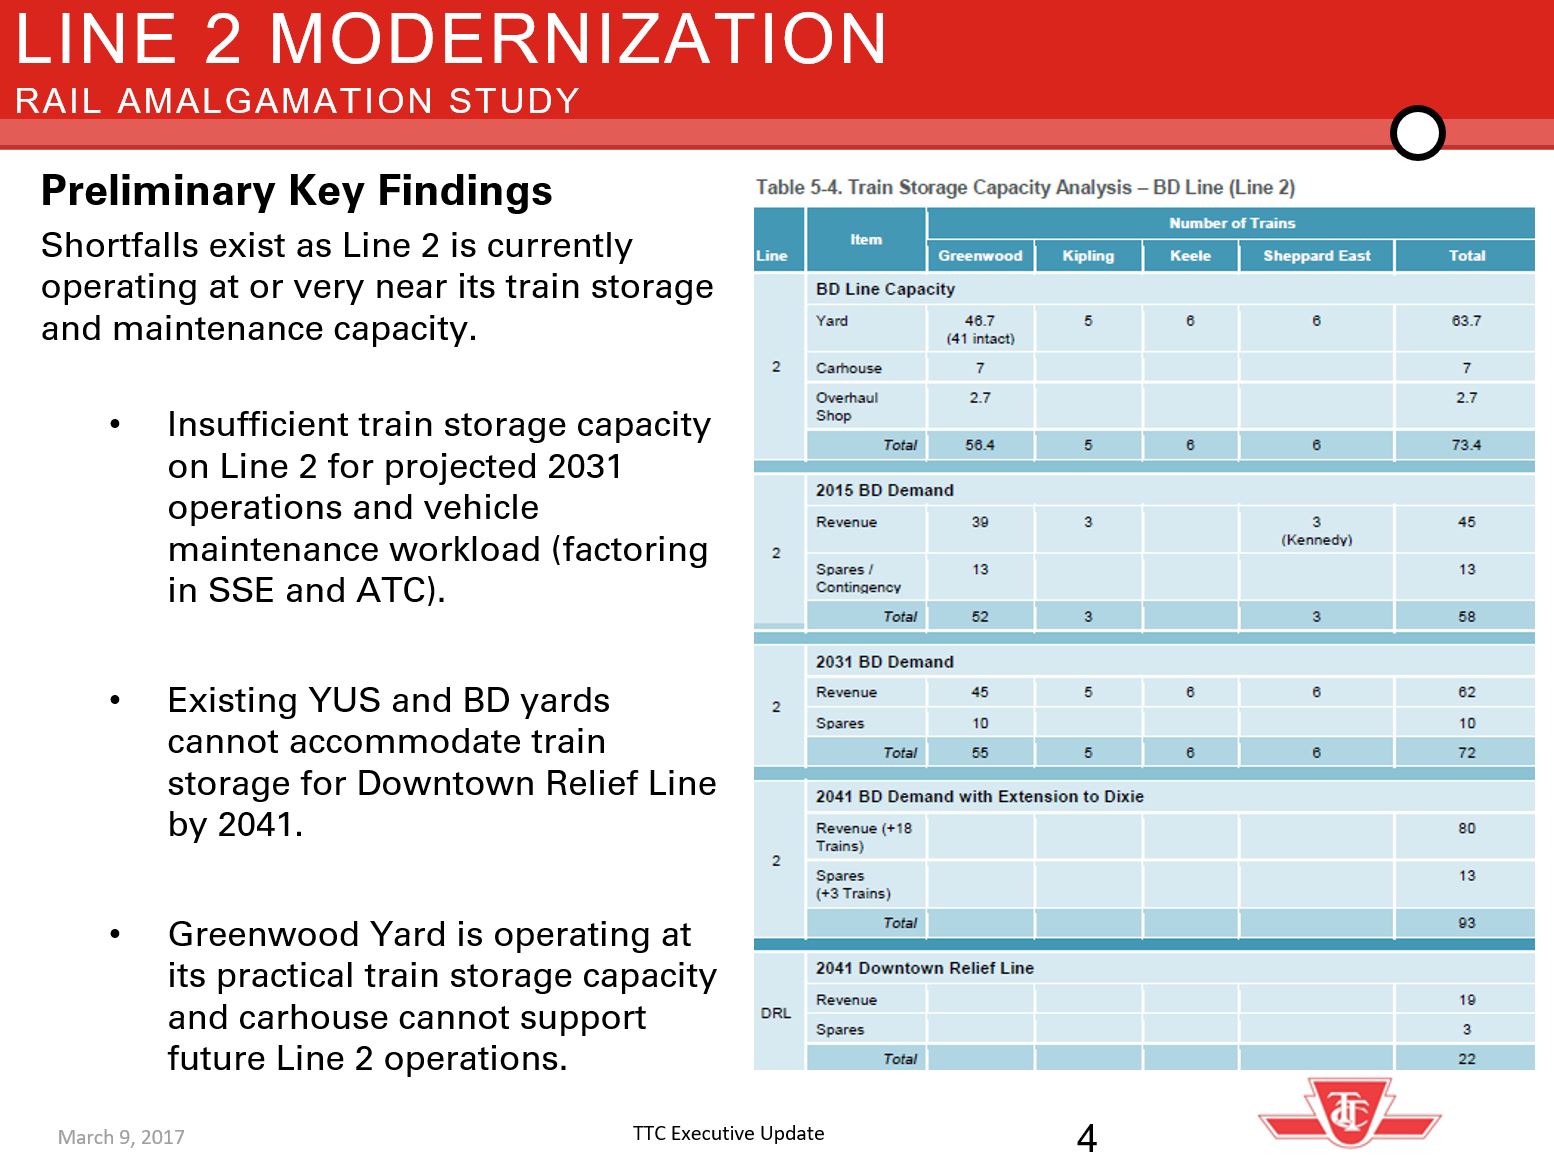
Back in 2017, there was a proposed renewal program for Line 2 that covered many aspects including fleet planning, extensions, future demand growth, signalling and maintenance yard requirements.
Most regular transit followers in Toronto will scratch their heads and ask “what renewal program”. The problem was that it was too rich for political blood at the time and most of it was ditched after CEO Andy Byford was replaced by Rick Leary.
A fundamental premise of the plan was that all of its components would be handled through one master schedule and common overall project management. The TTC had learned from experience on Line 1 that a piecemeal approach was fraught with conflicting timetables and specifications, not to mention the danger that each piece had to be funded separately with little appreciation for the big picture.
A Rail Amalgamation Study was conducted for the TTC by HDR and Gannett Fleming starting in 2015, and it was expected to finish in 2017. The intent was to review the line’s needs based on various future scenarios. For maintenance and storage facilities, it would consider:
The use of 2-car sets rather than the 6-car TR train configuration.
Possible line extensions
Expansion of the work car fleet to support expanding infrastructure
Implementation of ATC (Automatic Train Control) signalling
A preliminary report from the study showed that capacity would be a major problem. Note that in the context of this study, the Ontario Line did not yet exist, and the intent was that Greenwood Yard would host the Downtown Relief Line trains. Even without the DRL, Greenwood would not be able to handle expected growth in demand on Line 2.
The remainder of this article shows the details of the resulting plan, notably proposals for a new Line 2 fleet and expansion of the work car fleet that might have been set in motion had this scheme not been sidelined.
The TTC had a consolidated plan for Line 2 (and for the DRL), but this fell victim to budget cuts, the idea that we could “make do” rebuilding old trains and signal systems, and then the Provincial intervention with Metrolinx showing how they “knew better” how to plan and build rapid transit lines. We all know how that worked out.
A late addition to the TTC Board’s agenda for December 3 is a presentation on the characteristics the TTC should look for in a new CEO by the search firm hired to manage the process.
Updated Dec. 4, 2024: A section has been added at the end with additional information from the Board meeting.
Jayson Phelps, Senior Partner, Phelps Group, will make the presentation, but the deck is already available and contains some interesting reading. Over recent weeks, Phelps Group conducted 1160 surveys via a publicly available web site, as well as 1062 by email invitations. Individual interviews were conducted with 31 people including the TTC Board, Leadership Team and “key stakeholders”. [Full disclosure: I was one of those stakeholders.]
The presentation summarizes feedback from those surveys and interviews. It is broken down into four sections: Experience, Leadership Attributes, Capabilities, and Challenges/Opportunities. There is also a section on Key Success Factors At 18 Months.
Anyone who has read position descriptions for senior management will recognize many points of which these are only a few.
Knowledge of transit systems,
Intergovernmental experience,
Good communications skills,
Ability to build relationships with employees, governments and the public,
Valuing diversity,
Planning, budgeting and capital project management,
Working within limited funding,
Exploiting technology for organizational improvement.
Two particularly stand out:
Demonstrated focus on rider experience, accessibility, and affordability.
Passionate about improving transit systems as essential public services.
There is a long list of challenges including restoration of maintenance and service reliability, but also related issues such as organizational structure, departmental silos, and conflicting priorities.
Through the presentation, some points imply a very troubled background within the TTC. It has been no secret that the past era was not a happy one, but seeing some of these issues in print as part of a new CEO search gives a sense of the rot.
Ethical Leadership and Accountability
Upholds ethical standards, communicates honestly, and takes accountability for decisions.
Stakeholder Engagement and Public Advocacy
Skilled at navigating relationships with unions, government entities, and community organizations, fostering collaboration and trust.
Skilled spokesperson, building credibility with the public and enhancing organizational reputation.
Workforce and Organizational Culture
Low workforce morale, mistrust in leadership, nepotism, favoritism, and resistance to change.
Talent drain to competitors, non-competitive compensation, and limited diversity in leadership.
Operational and Infrastructure Issues
Maintenance backlogs, reliability issues, and slow zones requiring urgent state-of-good-repair projects
Key Success Factors at 18 Months
Public Trust: Strengthened public confidence through visible leadership, improved service quality, and consistent dependability.
Employee Morale: Enhanced employee engagement and reduced turnover through recognition programs, inclusivity, and fostering a collaborative workplace culture.
Workplace Culture: Addressed toxic workplace culture by fostering fairness, collaboration, and transparency
Terms like ethical leadership, honesty, accountability, credibility, low morale, mistrust, nepotism, favouritism and toxic workplace culture do not sound like the kind of organization TTC purports to be. Many senior staff have left either through retirement, buyouts, constructive dismissal, or simply through disgust with the TTC’s leadership.
That list of key characteristics and challenges for a new CEO tells a grim tale.
Rebuilding the TTC will be a challenge on many fronts, not the least of which is getting hold of today’s pressing issues, but simultaneously developing a plan for a new TTC and building the organization’s trust that it can be and should be implemented.
For many years, the TTC Board failed in their duty to manage their CEO and actions taken by him, and were happy to sit back as long as he met the City’s and Mayor’s target of keeping costs down. Whatever investigative details were provided to the Board prior to the CEO’s departure, we will probably never know.
For too long, some Board members chose wilful blindness. They have no place at the TTC.
After this agenda was published, the Federal Government announced its one third support for the purchase of 55 new Line 2 subway trains. See the Major Projects Update below for more details.
A central part of any transit rider’s journey is the wait for a vehicle that may or may not show up when expected. Even with an app that tells you where the bus is, the news might not be good. Rather than being just around the corner, the bus might be several miles away, and heading in the wrong direction.
The only statistic the TTC publishes on service quality is an “on time” metric. This is measured only at terminals, and even there “on time” means that a bus departs within a six-minute window around the scheduled time. Performance is averaged over all time periods and routes to produce system-wide numbers, although there are occasional references to individual routes in the CEO’s Report.
Riders complain, Councillors complain, and they are fobbed off with on time stats that are meaningless to a rider’s experience.
The problem then becomes how to measure the extra time riders spend waiting for their bus, and to report this in a granular way for routes, locations and times.
This article presents a proposed method for generating an index of wait times as a ratio comparing actual times to scheduled values, and their effect on the rider experience. The data are presented hour-by-hour for major locations along a route to see how conditions change from place to place.
An important concept here is that when buses are unevenly spaced, more riders wait for the bus in the long gap and fewer benefit from buses bunched close together. The experience of those longer waits raises the ratio of the rider’s waiting experience to the theoretical scheduled value. The more erratic the service with gaps and bunching, the higher the ratio of rider wait time to scheduled time. This is compounded by comfort and delay problems from crowded buses, and is responsible for rider complaints that do not match the official TTC story.
There’s some math later to explain how the calculations are done for those who want to see how the wheels turn, so to speak.
Note that this is a work in progress for comment by readers with suggestions to fine tune the scheme.
Back in September, I wrote about the gap between the TTC’s claims of service coming back to pre-pandemic levels and the actual service riders face in their daily travels. See:
I will not repeat all of the information in that post, but we are coming into budget season and the most current info should be available for debate.
When the 2025 budget comes out, we will hear much about service recovery including the obligatory photo op with the Mayor, TTC Chair and other worthies. This will be a sham because actual service today has not been restored to early 2020 levels.
The fundamental problem with TTC claims is that they measure “service” by hours for the simple reason that the primary driver of costs is the labour associated with driving vehicles. Some costs don’t actually vary with driving time, but these are generally a smaller component of the total. (For example, some costs vary with mileage, and others such as garaging are per vehicle.) For budget purposes, the variable that counts is hours.
When comparing pre- to post-pandemic service levels, one hour of vehicle operation does not necessarily provide the same amount of service as in the past. The primary reasons for this are:
Buses and streetcars run more slowly today than in early 2020 due to a combination of traffic congestion and operating practices (notably the pervasive slow orders on the streetcar system).
More recovery time is included in schedules to reduce short turning. The premise is that if there is enough padding, vehicles will rarely be late enough that they must turn back before reaching their terminals.
The combined effect is that more vehicles (and hence vehicle hours) are required to provide the same service on many routes today compared with early 2020.
I have tracked the changes in operating speed on various routes in past articles, and will return to that subject to refresh the charts in coming months.
A related problem for riders is that thanks to uneven service (gaps and bunching), the average wait for a transit vehicle can be considerably higher than the advertised headway. TTC reports “on time performance” only at terminals where service tends to be (but is not necessarily) close to schedule. The information is averaged over many routes and all hours of the day, and bears little relevance to a rider at a specific bus stop at a specific time.
I will turn to the problem of experienced vs advertised wait times in a separate article now in preparation.
The remainder of this piece updates the September charts with planned service hours by mode to the end of 2024, and a comparison of service levels by route and time of day in January 2020 versus November 2024. PDF versions of the chart sets are provided at the end.
The primary report among these is from Hatch, a consulting engineering firm with rail industry expertise. Their task, as they state clearly, was to determine the underlying technical reasons for each incident, but not to delve into TTC operational practices.
There are many cases cited of inadequate vehicle inspection and maintenance, lack of procedures and standards, undertrained staff, and poor record-keeping to document the history of affected vehicles. These are not isolated incidents, but ongoing problems.
The Management Action Plan consolidates all of the recommendations from Hatch and APTA together with their current status. Many are “complete” and others are “in progress”. What is clear from the extent of the list is that many problems, some quite serious, required action by the TTC. How did the system get into that state in the first place?
The TTC management report looks only at the hydraulic fluid spills, but does not consider the wider context of two previous reviews of maintenance and record keeping: the Streetcar Overhead Section, and the post-mortem report on the SRT derailment. There is a sense that “we have fixed this” through the substantial implementation of consultant recommendations, but without the broader context.
On a more general level, there are two obvious questions:
How many more sections or processes within the TTC suffer from similar issues, and are problems just waiting to surface?
Is the lower maintenance standard really confined only to work vehicles, or have staffing and funding limitations affected support for revenue vehicles and infrastructure too?
The management report states:
Both reports [Hatch and APTA] identified common root causes, and while they found that the TTC’s practices are typical of the industry, they recommend implementing a more robust preventative maintenance program of procedures, training, and quality control modeled after what the TTC has in place for revenue service vehicles. [Management report at p. 1]
The comment about TTC practices being “typical of the industry” is telling. If the situation described in the reports really is typical, the transit industry is in perilous condition. Saying “everybody else does it this way” does not explain how work car maintenance is nowhere near what one would expect from a once pre-eminent transit system in North America.
The Hatch report described the situation differently:
The lack of detailed documentation for the design and maintenance of the work car fleets is highlighted as a major issue in this report, especially for the repair of hydraulic hoses. However, Hatch’s experience with other major transit agencies in North America like TTC, suggest that design and maintenance documentation supplied by work car OEMs does not usually contain detailed information on the installation of the hydraulic hoses except when mandated by a procurement specification or used for very specific applications (e.g. rigid hoses, specialty hoses and fittings, and components that are hard to procure and/or have long lead times). [Hatch at p. 39]
That remark refers to the availability of documentation, not to day-to-day maintenance practices.
The APTA report is silent on practices at TTC compared to other systems.
This is a significant discrepancy between the management report and the documents from Hatch and APTA, and one cannot help seeing this as “spin” to put TTC practices in the best possible light.
Summary of Incidents
The table below gives an overview of the incidents reviewed by Hatch.
Date
Description
Sun Jan 14
Car RT56 spilled 10L of fluid between Sherbourne and Donlands Stations. Cause: Hydrostatic hose failure
Wed Jan 17
Car RT17 spilled 120L of fluid between Eglinton West and Dupont Stations. Cause: Filter O-ring failure
Sat Feb 10
Car RT7 spilled 5L of fluid in Greenwood Yard during a pre-departure inspection. Cause: A faulty hydraulic filter O-ring
Mon Apr 22
Car RT41 spilled 50L of fluid while shunting into Greenwood wye north of the yard. Cause: O-ring failure
Mon May 13
Car RT56 spilled 100L to 140L of fluid at Spadina Station (Line 1) and other locations while it was being towed back to Greenwood Yard. Cause: Abraded hose Service effect: Line 2 was shut down for over 12 hours as the affected area was greatly expanded by moving a leaking car through the system rather than isolating it for inspection and repair.
Wed May 15
Car RT84 spilled 200L of fluid on the trackbed north of Eglinton Station. Cause: Excessively worn driveshaft clutch plates seized and disintegrated leading to further damage including a severed hose.
Thu May 16
Car RT41 leaked 0.25L of fluid on the trackbed at Keele Station. Cause: O-ring failure under a pressure sensor
Sun May 26
Car RT18 leaked 30L of fluid onto open track between Victoria Park and Kennedy Stations. Cause: Incorrect hose and fitting used in a previous repair cause a hose failure.
Some of these incidents were cleaned up before affecting revenue service, or occurred in yards where there would be no effect. This does not minimize the severity of so many failures in such a short time span. Some of the cleanup efforts required multiple passes to complete satisfactorily.
One outcome of this review is the recognition that clean-up of spills requires better handling than in the past, but the basic issue is that the spills should occur less frequently, if at all, in the first place.
Readers who want to see complete details and photographs of these incidents should peruse the Hatch report.
One key point should be knocked on its head: back in May, there were questions about possible sabotage given the spate of events in a two-week interval. The investigation showed that all incidents were due to component failure from lack of maintenance, or of incorrect maintenance. The May 13 incident was a direct result of the routing of a hose through a floor grate where it would chafe and eventually fail. “Sabotage” was a red herring at the time, and remains so today. [There is an extensive review of the metallurgical condition of the hose and the floor grate in the Acuren Group report.]
TTC plans to up its spending on work cars. It is worth noting that a plan to refresh and expand the work car fleet under former CEO Andy Byford was sidelined when Rick Leary took over as, initially, was the plan to renew the Line 2 fleet.
The TTC’s 2024-2033 Capital Budget and Plan includes $34.0 million of approved funding for work car overhauls and $63.4 million toward work car procurements.
TTC staff will include a funding request in its 2025 Operating Budget submission to establish a more robust work car preventative maintenance program.
This statement is a clear admission that the program now in place is inadequate. A related issue is that the backlog of necessary work is directly related to work car availability, and in turn that drives the longevity of slowdown orders on the subway.