The Cost of Running the Queen Car

Update: Minor changes were made to add some details to the costings presented here at about 10:10 am on June 14.]

The debate over which type of transit vehicle should operate on Queen Street, and by implication on the wider streetcar network, will inevitably get into the question of the cost of streetcar operations. The TTC has cited large ongoing costs of the bus operation:

This summer, the TTC is spending an extra $1 million per month to run buses on the route, according to TTC spokesperson Brad Ross. It also takes 60 buses to provide similar service to the 501 Queen’s usual 45 streetcars.

“Queen is a good example of a route where streetcars make good sense because of the capacity that they offer you in the downtown to reduce congestion,” Ross said, adding that Toronto’s streetcars produce lower emissions than buses.

[From CBC News Toronto]

The ratio of buses to streetcars in this quotation is somewhat misleading for a few reasons:

  • The bus service is scheduled with extra running time in anticipation of construction delays, although the actual construction has not yet begun. This is responsible both for the accumulation of large numbers of buses at terminals.
  • The replacement ratio of 1.3:1 is well below values the TTC normally uses in comparing transit modes, and in their own crowding standards. The design capacities of vehicles for service planning is 51 for a standard bus, 74 for a standard-length streetcar (CLRV), 108 for a two-section articulated streetcar (ALRV) and 130 for the new low floor Flexitys. This implies a replacement ratio of 1.45:1 for CLRVs, 2.12 for ALRVs and 2.55 for Flexitys. These numbers would be adjusted downward to compensate for faster operating speeds with buses, if any, although that adjustment would vary by time of day and route segment as shown in my analyses of operations on the route.
  • The capacity of scheduled bus service is less than the scheduled capacity of streetcars at the beginning of 2017. Service for 501 Queen is based on the capacity of ALRVs.
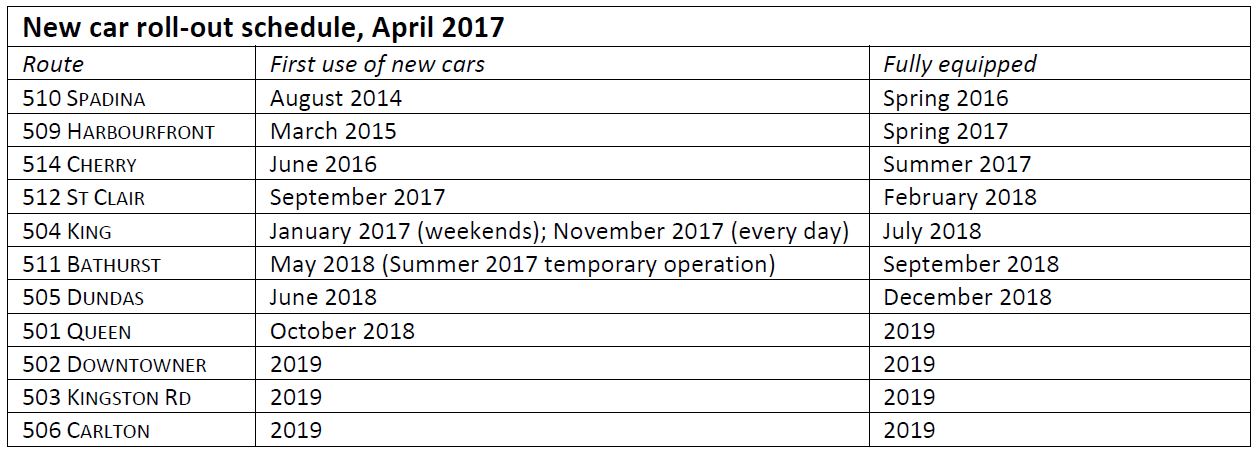
  • The actual streetcar service on Queen before buses began taking over was scheduled to use 33 ALRVs and 7 CLRVs (November 2016 service). The CLRVs were dedicated to the service between Humber and Long Branch Loops.

The TTC’s methodology for allocating operating costs to routes is based on three variables:

  • Vehicle hours (primarily the cost of drivers and related management and overhead costs)
  • Vehicle kilometres (part of the day-to-day cost of running and maintaining buses including fuel)
  • Vehicles (part of day-to-day costs for work such as dispatching, routine inspections and maintenance, cleaning)

The cost of routine streetcar track maintenance is included in the vehicle kilometre cost. This does not include major projects such as the replacement of track which are funded from the Capital Budget.

The factors for the two modes as of 2015 were:

                   Per Hour      Per Km        Per Vehicle
                                                 per Day
     Buses         $ 92.30       $  1.88       $  150
     Streetcars    $ 95.40       $  3.42       $  515

     [Source: TTC Service Planning via Stuart Green in TTC Media Relations]

As 2015 costs, these numbers contain almost no contribution from the new Flexity fleet, but they will be influenced by the cost of maintaining decades old CLRVs and ALRVs. The hourly component of streetcar costs is probably influenced by the relatively higher level of route supervision on that network than on the suburban bus routes.

The TTC’s most recently published detailed statistics for their network date from 2014. (The lack of timely data on route performance is an ongoing issue, but one that is separate from this article.) For 501 Queen, the daily factors for 2014 operation were:

     Vehicle Hours    595
     Vehicle Km     9,100
     Vehicles          36

The number of vehicles listed is lower than the peak requirement, and this will affect the calculated cost as discussed below.

When the streetcar costs are applied to these factors, the daily cost of the Queen car comes out to just over $100k (2015).

     Hourly costs     $ 56,763  53.3%
     Kilometre costs    31,122  29.2%
     Vehicle costs      18,540  17.4%
     Total            $106,425

Adjusting this for the higher number of streetcars actually shown in the schedules would add 4 vehicles (40 vs 36) at a daily cost of $2,060.

On an annual basis (taking one year as equivalent to 305 weekdays, the factor used by the TTC to account for lower demand on weekends and holidays), the Queen car costs about $32.5 million (2015) to operate.

Update: This does not include the cost of the 502 Downtowner nor the 503 Kingston Road Tripper cars. Annualizing the premium for bus service quoted by the TTC to $12m/year puts the relative cost by their estimation in context.

The important point here is that the hourly costs account for about half of the total, and so any calculation is most sensitive to the number of operators required to provide service. Larger vehicles have a strong advantage over smaller ones. Also, larger vehicles mean lower costs for vehicle distance travelled and per vehicle costs, but it is not certain that for a large-scale change in fleet composition that these cost factors would remain stable depending on just which cost components are allocated to each category. For example, a carhouse costs the same amount to operate whether it has 200 small cars or 100 large ones in it. Extrapolation to an all-Flexity environment should be done with care.

In the case of a bus operation, provided that the average speed could be increased during peak periods, this would reduce the total vehicle requirement and bus hours, but it would not change the bus kilometres in comparison to buses scheduled at the same speed as streetcars. (Fewer vehicles travelling at a higher speed run up the same mileage.) The big difference would come in vehicle (operator) hours because of the lower capacity of buses.

The problem of projecting a replacement cost then becomes one of “twirling the dials” of various factors to determine what the replacement service might look like. One obvious starting point is that this must be based on normal route conditions, not on the non-standard schedules now in use for the construction period. Possibilities include:

  • Using an ALRV:Bus replacement ratio of 2:1
  • Using a lower replacement ratio such as 1.5:1 (a sensitivity test to determine how costs would change with larger buses)
  • Using the 2:1 capacity ratio, but assuming a higher average speed for buses
  • Using the higher capacity of Flexitys

The results from these assumptions should be taken with considerable caution because it is far from certain that the cost factors can actually be relied upon across the different vehicle types and usage patterns.

  • On a 2:1 replacement ratio, the cost of bus operation is about 50% higher than for ALRVs. Costs allocated per vehicle are lower, even though there are more buses, but this is more than offset by higher costs for the hourly and mileage components.
  • On a 1.5:1 replacement ratio, the cost of buses is about 10% higher than for ALRVs.
  • On a 2:1 replacement ratio, but with a 10% increase in average speed, bus costs go down about 8%, but are still about 1/3 higher than the cost for ALRVs.
  • For Flexity operations, assuming cost factors are unchanged (valid for hourly costs, but mileage and vehicle costs are another matter), the replacement bus service would cost about 75% more than the streetcar service.
  • Flexity costs fall by 1/6 relative to ALRVs because of the larger Flexity design capacity. This is a comparatively small saving on Queen because the route is already scheduled (if not actually operated) as if it had the larger ALRVs on it. If we were looking at 504 King, for example, the schedule is based on CLRVs and so the replacement by buses would require many more vehicles proportionately than for the Queen route, and replacement by Flexitys would require many fewer vehicles to provide the same scheduled capacity.

[Note: I have deliberately not published exact numbers here because this is only a rough estimate subject to alteration as and when the TTC refines its cost base and the assumptions behind a comparative service design. Also, it is based on 2015 cost data and 2014 schedules.]

These costs do no include major capital projects including ongoing renovation of streetcar track, and one-time costs to bring infrastructure (notably the overhead power distribution system) up to modern standards.

The annual cost of surface track and special work (intersections) varies from year to year based on the scheduled work plans. The average for tangent track over 2017-26 is about $21 million/year although the amounts for 2017 and 2018 are particularly high due to the extent of planned work in those years. From the point where the TTC decided to retain streetcars in late 1972 until 1993, their track construction was not of a standard required for the long life expected of rail assets. Track was not welded, untreated wooden ties were used, and there was no mechanical isolation for vibration between the track and the concrete slab in which it was  laid. The result was that roadbeds fell apart quickly and the lifespan of the infrastructure was about 15 years.

Beginning in 1993, the TTC changed to a much more robust track structure using a new concrete base slab, steel ties, welded rail and rubber sleeves to isolate the track from the concrete around it. The structure is designed so that when track does need to be replaced, only the top layer, the depth of the track itself, needs to be removed. New track can be attached to the steel ties that are already in place. Conversion to this standard across the entire system is almost completed, and track reconstruction costs will drop due both to longer lifespan and simplified renewal work.

The average for special work over 2017-26 is about $14 million/year. Starting in 2003, the complex castings were set in a vibration-absorbent coating. Construction techniques have also advanced so that intersections are pre-assembled and welded off-site and then trucked to street locations for installation in large panels. The most recent intersection, Dundas and Parliament, went from initial demolition of the existing track to full assembly of the new intersection in one week. (Further work was required to complete other road upgrades, and new intersections are typically allowed to cure for a few weeks so that the concrete does not suffer vibration before it has properly set.) With a roughly 30-year cycle for special work replacement, the TTC is only about half way through rebuilding all of its intersections to the new standard.

Update: The Queen route represents about 28% of the track in the streetcar system, and so is responsible for about $10m of the annual capital work averaged over its lifetime. This is a relatively high proportion for one route, especially in relation to the amount of service operated there. 504 King, for example, is much shorter and has considerably more service than 501 Queen.

The cost of track replacement is essentially a fixed value that varies little with the level of transit service, although some of the lighter routes could turn out to have greater lifespans. This capital cost, therefore, represents an investment in the future of the streetcar system and the ridership growth that it could accommodate if only the TTC ran enough service. (The frequency of many routes is very much lower today than it was a few decades ago, and there is a lot of room for growth as residential density builds up along these routes.)

I will review the TTC’s Capital Budget for streetcar infrastructure in the next article in this series.

Any examination of streetcar replacement with buses must consider a variety of factors, but most importantly must look not at the streetcar system as it is today with service levels essentially frozen at or below the levels of two decades ago, but at what it can become as the backbone of travel in the growing “old” City.

The Fords’ Fascination With Streetcars

At a recent meeting of Toronto’s Public Works and Infrastructure Committee (PWIC), a motion was approved asking for reports on the comparative cost of streetcar and bus operations on Queen Street. The author of this was Councillor Michael Ford, although it was actually placed by his colleague, Councillor Holyday because Ford is not a member of PWIC.

1.  City Council request the Toronto Transit Commission, upon completion of the construction projects that have resulted in the removal of the 501 Queen Streetcar route from service for Summer 2017, to defer reintroduction of streetcar service for a period of two weeks, to permit the collection of data for the comparison study.

2.  City Council request the General Manager, Transportation Services, in consultation with the Toronto Police Service and the Toronto Transit Commission, to conduct a comparison study of the efficacy of streetcar service versus bus service on Queen Street, specifically looking at:

a. Schedule reliability of transit vehicles
b. Delays to other users of the road
c. Collisions at transit stops involving transit vehicles and cars, pedestrians, or cyclists
d. Collisions at transit stops between cars, pedestrians and cyclists not including transit vehicles
e. Ridership satisfaction
f. Fleet maintenance costs
g. Fleet operator and operation costs
h. Incidences of driver assault
i. Incidences of passenger disputes
j. Traffic volumes in peak period and off-peak periods

using bus data collected during the two week delayed streetcar re-implementation period, followed by the subsequent two weeks once they have been re-implemented, in order to get a clear and direct comparison during non-construction periods, and report back to the Public Works and Infrastructure Committee in the first quarter of 2018.

The request received little debate coming as it did as an add-on motion to a Friday meeting. Nobody from the TTC was present, nor were there any interventions by downtown Councillors or members of the public. PWIC, although it deals with many issues affecting downtown, contains no members from that area thanks to the gerrymandering of committees by Mayor Tory.

An amendment to this motion by Councillor Lee asked the Deputy City Manager to report to Council with additional information such as the cost and feasibility of such a study.

The package passed on a 3-2 vote and the request goes to the July 2017 Council meeting for approval.

My recent series of articles on bus vs streetcar operations on Queen was already “in the works” when this motion was approved, although this request triggered somewhat more urgency to producing them than I had planned.

Part I: A comparison of travel times for streetcars in April vs buses in May 2017
Part II: An historical review of travel times September 2013 to May 2017
Part III: Capacity of service scheduled and operated
Part IV: Comparative operating speeds in May 2017

One important point flowing through these article is that “comparison” can be challenging when the underlying conditions vary. From the analysis I have published, it is already clear that buses tend to fare better than streetcars where traffic is light and demand is low, but they lose this advantage in busy areas. A further problem is that TTC operating practices for each vehicle type differ and buses tend to be driven more aggressively. Streetcars could be too, but in an attempt to manage service, various practices have resulted in streetcars being forced to drive more slowly than actual road conditions dictate. The longer this goes on, the more it is assumed to be an inherent part of streetcar operations, while those of us who have ridden the TTC for some years know what streetcars can actually do given the chance.

The motion proposes that buses stay in operation for two weeks beyond the point that streetcars would have returned (Labour Day weekend) and that data be collected to compare operations. To be fair to the buses, this may not be an ideal period because early September sees much traffic displaced from King to Queen thanks to TIFF. Other planned construction work will disrupt the street: in September, track will be replaced at Queen & Coxwell, and in October/November at Queen & McCaul. Coxwell, at least, is well out of the core an work there will not affect streetcar service (a bus shuttle will run to Neville). There is also the question of whether the TTC will have enough buses to spare for Queen once the summer service cutbacks end in September.

One issue raised by the motion and by some media reports is that riders feel they are getting a faster trip with buses. My analysis shows that for some times and parts of the route this is true, but not for the most congested areas. Moreover, as already noted, we are seeing buses unconstrained by a “go slow” operating policy compared with streetcars that limp along the route to avoid running early. This is not an apples-to-apples comparison.

We have been down this road before when former Councillor Rob Ford, later Mayor, posed a series of questions to the TTC in 2010. My thanks to Councillor Kristyn Wong-Tam for providing the exchange. For the purposes of this article, I have divided up the material so that I can comment on each section, and reordered the sections to provide a better thread in the current context.

It is no secret that I support the retention and expansion of the streetcar network. Although new suburban lines such as 5 Crosstown and 7 Finch West will use the “Metrolinx” Toronto car, whatever it might be, new lines in the waterfront west to Humber Bay and east to the Port Lands will be part of the “legacy” network. Waterfront plans depend on the capacity that an LRT  link to Union Station can bring.

The question of articulated buses as a streetcar replacement comes up from time to time. My response is that there are suburban routes where these are appropriate, but that in the congested core area, streetcars are the best vehicles for traffic conditions and they have the ability to operate underground where needed. Buses might be made to work, but only if Toronto is prepared to devote much more road space and time to transit vehicles. They are not a panacea for suburban motorists fighting their way through traffic in an oversized SUV.

Continue reading

Metrolinx to Buy LRVs from Alstom

The Globe and Mail reports that Metrolinx has entered into a deal with Alstom, who are already building the LRV fleet for Ottawa, to produce cars for at least some of the Metrolinx projects in the GTHA. In effect, Metrolinx is looking to cut its ties to Bombardier whose car deliveries are long overdue, although the actual mechanics of this will depend on contract negotiations and whether Bombardier actually does manage to produce cars in time for the Eglinton Crosstown line’s opening.

The Alstom cars will go to Eglinton, unless Bombardier comes through, in which case they will be repurposed for the Finch and Hurontario lines. Given the opening dates planned for those lines, a decision to extend the Alstom order would come well before opening day unless the current target dates for Finch and Hurontario were changed.

Metrolinx and Bombardier still must go through a dispute resolution process, but is it clear that Metrolinx feels that they are on solid enough ground to make this move.

Metrolinx press release (May 12, 2017):

METROLINX STATEMENT ON ALSTOM / BOMBARDIER

TORONTO: May 12, 2017 – Metrolinx is taking a major step forward to ensure that the Eglinton Crosstown LRT opens on time, and that our other LRT projects are on track.

We are making great progress on the Eglinton Crosstown and are well on our way to launching this outstanding new service as scheduled in 2021.

Now, we are pleased to be able to say we have certainty that there will be trains to run on this line.  That is because we are entering into an agreement with Alstom as an alternative supplier of light rail vehicles.  Alstom will build 17 vehicles for the Finch West LRT project and, if necessary, 44 for Eglinton Crosstown. If Alstom vehicles are not needed for Eglinton Crosstown, they will be reassigned to the Hurontario LRT project.

We know for sure that Alstom’s light rail vehicles work.  They are currently producing quality vehicles on-time for Ottawa’s Confederation Line LRT project.

We are going through a dispute resolution process with Bombardier, but that could take 8-12 months, and we can’t wait that long to determine whether Bombardier will be able to deliver.

We are hopeful that Bombardier can get its program on track.   However, the steps we are taking give us a safety net if it turns out Bombardier is unable to fulfil its contract.

Our end goal remains opening our LRT projects on time with high-quality vehicles that will provide excellent service to the people of this region.  This new contract with Alstom provides flexibility to ensure that happens.

John Jensen

President & CEO, Metrolinx

Bombardier Statement (May 12, 2017)

From Marc-André Lefebvre, Head of Communications and Public Relations, Canada

Bombardier is ready, able, and willing to deliver these vehicles to the people of Toronto on time. As the Minister and Metrolinx are well aware, these vehicles can be ready ahead of schedule and well before a single track has even been laid on the Eglinton Crosstown.

In fact, the Metrolinx pilot vehicle is ready, undergoing qualification testing, and Bombardier is right now producing vehicles for the Region of Waterloo that are identical to those that will be used on the Eglinton Crosstown. All 14 of those vehicles will be delivered to Waterloo by the end of this year.

We believe what’s best for the people of Toronto and Ontario is that we work together to ensure taxpayers are not on the hook for another cancelled contract. We’ve met each and every major LRV delivery milestone in the last eight months and the proof will be in the performance of these vehicles in Waterloo and on Eglinton. We have addressed the issues raised in the past and we are confident this will be upheld in the dispute resolution process.

We are committed to working with Metrolinx to find a clear path forward; one that ensures the transit riding public has the most efficient, comfortable and reliable transit system in the world.

I will update this article as more information becomes available.

Minister of Transportation’s statement (May 12, 2017)

Youtube video of Alstom Citadis cars for Ottawa

Alstom product page for Citadis Spirit

Alstom press release (May 12, 2017)

Toronto Star article

Just think, this could have been Scarborough. While Toronto has utterly cocked up its transit planning, with substantial help from Queen’s Park, Ottawa has built and is about to open the first phase of their line.

TTC Updates Flexity Roll Out Plan (Updated)

The TTC has issued an updated plan for implementation of the new Flexity streetcars.

This is taken from a Briefing Note that details recent revisions to the plan plus details of the service to be operated on 512 St. Clair once it is fully converted to the new cars.

As of mid-2016, plans were somewhat different for the conversion of routes to the new cars:

  • By the end of 2016: 510 Spadina, 509 Harbourfront, 514 Cherry, 511 Bathurst, 505 Dundas and 501 Queen (part)
  • By the end of 2017: 501 Queen (complete) and 504 King
  • By the end of 2018: 512 St. Clair and 502 Downtowner (part)
  • During 2019: 502 Downtowner (complete), 503 Kingston Road and 506 Carlton

The 512 St. Clair line has moved up in the sequence with conversion beginning in September 2017 and finishing (assuming Bombardier’s deliveries stay on schedule) in February 2018. This route is now overcrowded and needs more capacity. The only way this can be provided is with more and/or larger cars.

The planned service level will use fewer cars, although they will be much larger than those now in service on St. Clair, with the result that greater capacity will operate on the route. The scheduled capacities shown below are based on 74 passengers/car on the existing CLRVs and 130/car on the new Flexitys.

It is worth asking here how many other TTC routes are in this condition, and why a report detailing the degree of the shortfall was not an essential  part of the budget when Toronto was told that the TTC’s planned service was adequate to meet demand.

What does exist in the Capital Budget (albeit in the detailed “Blue Books” which are issued after the budget is finalized) is the fleet plan. Although the timing of route conversions has changed, what remains constant is the planned peak vehicle requirement for each route.

In the table below, the CLRV and ALRV figures are the PM Peak scheduled service for various dates when these routes were operating entirely with streetcars and with no diversions.

Date CLRV ALRV Flexity Capacity Ratio
501 Queen / 508 Lake Shore Mar 2016 6 33 34 1.1 (*)
502 Downtowner Sept 2015 7 8 2.0
503 Kingston Road Sept 2015 6 6 1.8
504 King May 2017 33 7 24 + ALRVs (*)
505 Dundas Jan 2017 19 19 1.8
506 Carlton Jan 2017 29 24 1.5
509 Harbourfront May 2017 8 N/C
510 Spadina May 2017 16 N/C
511 Bathurst Sept 2016 11 11 1.8
512 St. Clair May 2017 22 18 1.4
514 Cherry May 2017 9 N/C

Notes:

  • The actual capacity change on Queen will be greater than 1.1 because many of the “ALRV” runs are now operated with the smaller CLRVs although there has been no adjustment in the schedule to reflect the reduced capacity of the route.
  • The capacity change for King will depend on how many of the 30 ALRVs that will be overhauled for service until 2024 are assigned to this route. The fleet plan indicates that these ALRVs will have to be replaced in a future order. If the TTC were to operate 24 Flexitys plus 20 ALRVs, this would add approximately 65% to the route’s capacity. Other gains might be obtained through transit priority measures now under study, but the actual quantity remains to be seen.

The total of Flexitys in the table above is 177 vehicles which, allowing for 15% spares (a relatively low level for the TTC which uses a higher number for its bus fleet) brings the total to the 204 vehicle fleet now on order. A five percent increase in the spare factor is equivalent to 10 more cars.

Additional cars will be needed to handle ridership growth, replacement of the ALRV fleet, and new routes in the Waterfront. The Fleet Plan provides for 15 Waterfront vehicles, but this number was based on a smaller version of the LRT network than may eventually be built considering the Unilever site development and plans for the Western Waterfront line.

The Fleet Plan notes that the 264-car combined capacity of Leslie, Russell and Roncesvalles will be exhausted by 2027 when a new carhouse will be required. This would not likely be a large facility and could be more of a satellite storage yard. The TTC will have to begin thinking about its need for more streetcars and storage within this decade.

TTC Board Meeting April 20, 2017 (Updated)

The TTC Board will meet on April 20, 2017. Items of interest on the agenda include:

  • The monthly CEO’s Report
  • Repair of SRT Vehicles
  • Disposition of Bay Street Bus Terminal

This article has been updated with a commentary on subway and surface route performance statistics presented at the Board meeting. (Scroll down to the end of the CEO’s Report.)

Continue reading

TTC Vehicle Reliability

Delays in the arrival of the new Bombardier Flexity streetcars, together with last summer’s sauna conditions on the Bloor-Danforth subway, make for ongoing concern about the condition of the TTC’s fleet. Statistics in the January 2017 CEO’s Report triggered media reports and a discussion at the recent TTC Board Meeting.

The numbers, although presented in what is supposed to be an “industry standard” format, lead to much confusion for a variety of reasons:

  • The basic standard is that any fault causing a delay of five minutes or greater counts, while all others do not.
    • A fault that might delay a bus or streetcar (doors not working) may not count against the subway because there is so much redundancy.
    • There is no distinction between a fault that represents a severe failure of a component or a minor annoyance that simply caused a long enough delay to be counted. Similarly, the cost and effort needed to repair faults does not contribute to the metric.
  • Faults are reported “per vehicle kilometre”, but many subsystems fail more on the basis of hours in operation (how long has an air conditioner been running), or number of cycles (how many times did doors open and close).
    • For a specific fleet and type of operation, hours and kilometres are interchangeable because the fleet operates at a consistent average speed within its frame of reference.
    • Fleets (or even subsets of fleets) operating under different conditions (average speed, frequency of stops, loads and grades) will not have the same ratio of hourly-based to distance-based faults. Direct comparison of distance-based statistics between these conditions is meaningless. For example, a well known problem in comparing streetcars with buses is that bus routes tend to operate in suburban conditions at relatively high average speeds. When they shift to more congested, densely used routes, their operating characteristics change. (It is self-evident that fuel consumption is affected by route conditions, and operator wages are paid per hour, not per kilometre. Slower buses run fewer kilometres. Time-based wear and tear, and associated reliability stats will rise when expressed on the basis of distance.)
  • Some fleets are a uniform age, while others are diverse.
    • Toronto’s rail fleets have major vehicle groups each of which was sourced as a single large order: The T1 (BD) and TR (YUS) subway car fleets; the CLRV, ALRV and Flexity streetcar fleets; and the SRT.
    • The bus fleet has a wider range of ages and technologies, and so its statistics are the combined effect of vehicles over a range of ages and conditions.
    • For a list of the TTC fleet by type, see the last page of any Scheduled Service Summary such as the one for January 2017. These are available on the TTC’s Planning webpage.

In the figures reported by the CEO, these issues are not explored in detail, but are at best mentioned in a few footnotes. Unsurprisingly, the media and politicians (even transit pundits) can jump to the wrong conclusion about what the stats actually mean.

To ensure that even without taking these factors into account, we are dealing with similar methodologies for each fleet, I asked the TTC whether the same principles apply across the system.

SM: Is it correct that there is a different set of criteria for a “defect” charged to the streetcar fleets and to the subway fleet? Are the criteria used for buses yet another way of measuring defect rates, or are they the same as for streetcars?

TTC: Same principle applies.  In principle, the calculation of MKBD is the same for each mode.   Overall vehicle reliability is dependent upon component and systems reliability. 

MKBD is calculated from the number of chargeable Road Calls and Change Offs (RCCO) during service.  The definition of a chargeable RCCO is any disruption to revenue service caused by a preventable equipment failure.  This definition is applied to all modes of operation.  It should, however, be noted that there are slight differences to the criteria of RCCO for each mode.   For example, a failure to a set of doors on a subway train may not cause a disruption or a delay to service.  Line mechanics may respond to the failure and barricade the inoperable doors. This may happen with no impact to customer or to service. This is due to the fact that subways have multiple sets of doors that customers can enter or egress from. Transit Control, therefore,  may decide not to remove a train from service if one set of doors is inoperable.  For a 40’ bus, however, the option to continue in service with a set of inoperable doors is not an option. Passenger flow on and off the bus will be significantly impacted.  Therefore, in this case … the same equipment failure may be handled differently on buses, streetcars and subways.   Differences in types of equipment, life cycles of these equipment and operating environments will also contribute to the differences in calculating RCCO and MKBD between modes. [Email of January 16, 2017]

Continue reading

Mayor Tory Discovers We Don’t Have Enough Transit Service

Budget season brings some of the more extreme and ill-informed statements from the Poo-Bahs who govern our fair city. For the benefit of those unfamiliar with the Gilbert & Sullivan operatta “The Mikado”, the Oxford Dictionary defines the name/term thus:

A person having much influence or holding many offices at the same time, especially one perceived as pompously self-important.

Throughout the development of the TTC Operating Budget, a central question has been that of projected ridership and the service it will require. The accept wisdom goes roughly like this:

  • We expected lots and lots of new riders in 2016, but we aimed rather high, a “stretch target” as CEO Andy Byford described it.
  • They didn’t all show up. This led to a shortfall both in ridership and in revenue compared to the original 2016 budget.
  • Service improvements were planned for fall 2016 based on the target numbers, but as there are fewer riders, the improvements were not required.
  • Ridership for 2017 is projected to be only barely above 2016 levels, and the service operating in fall 2016 is adequate to handle the demand.
  • There is no provision in the 2017 budget for service increases beyond the full-year effect of changes made partway through 2016.

All of this is quite plausible, but it runs headlong into conflicts with other factors. The most recent of these is a letter from Mayor Tory and TTC Chair Josh Colle to Bombardier complaining about the late delivery of streetcars.

Continue reading

TTC Board Meeting: November 30, 2016

The TTC Board will meet on November 30, 2016 at 1 pm in the Council Chamber at City Hall. This is not a budget meeting, but the agenda contains a number of items of interest.

  • CEO’s Report for November 2016
  • Purchase of Air Conditioning Parts for T1 Subway Cars
  • Purchase of land to expand bus storage capacity
  • Reports related to the Hillcrest Complex including a review of property usage, approval of new equipment for Duncan Shops, and approval of a new Streetcar Way Building.
  • Expansion of Davisville Carhouse
  • St. Patrick Station Easier Access Elevators

Continue reading

The Travails of Cherry Street

A recent meeting of the Corktown Residents’ and Business Association included a discussion of problems with the new 514 Cherry service. As reported by thebuletin.ca

… a resident of the King/Sumach area … commented that the screech of the streetcars turning at King and Sumach was so loud as to prevent sleep. Apparently the issue has been ongoing since the inauguration of the 514 (Distillery Loop–Dufferin) line on June 19.

The issue—which took the meeting somewhat by surprise—was amplified by other attendees, who also noted that there were substantial problems with streetlight timings at the Cherry/Front and Cherry/Eastern intersections, as well as with poorly-delineated turning lane stripes which have led to vehicles accidentally getting onto the streetcar right-of-way and then being unable to get off. (There have been earlier, similar incidents with the slightly older right-of-way at Queen’s Quay.)

Deputy Mayor and area councillor Pam McConnell’s office was aware of the issues and noted that streetcar service was now suspended (replaced with shuttle buses) between 10 p.m. and 7 a.m. A public meeting was subsequently scheduled with the councillor’s office and the TTC.

Problems at King & Sumach have continued since the 514 opened for service including:

  • dewirements causing overhead to be pulled down
  • derailments
  • traffic signals that do more to delay transit service than “prioritize” it (this is also a problem further south on Cherry)

When the TTC began rerouting the 514 service late in the evening, the alleged purpose was “railgrinding” and this is still reflected in the URL for the service notice which is called “514_railgrinding.jsp”. The activities underway at the intersection were clearly aimed at the derailment problems by altering the rail profile on the curves.

There is a long-standing slow order for east-west operation on King that has nothing to do with this, but is no doubt related to a few cases of overhead failure.

Meanwhile, the traffic signals here and at other locations on Cherry appear to be on a fixed cycle that has no relationship to whether transit vehicles are present. So much for “transit priority”.

On the subject of wheel squeal, the TTC’s official line is that the new streetcars are supposed to be self-lubricating, and that this would be triggered by GPS information. That’s a good line, but it does not fit with actual conditions.

  • There is a wheel greaser on the southbound approach to Distillery Loop.
  • The GPS-based automatic greasing has not yet been turned on for the new cars. (Anyone with contrary information is welcome to correct me in the comments.)
  • Most of the service on 514 Cherry is provided by CLRVs that do not have automatic greasers.

I have outstanding requests for further information on these issues to both the TTC and to City Transportation, and will update this post as and when they reply.

TTC Service in 1928

A recent comment sent me looking for service levels early in the TTC’s existence (post 1921), and I was pleasantly surprised to rediscover that this information is in a book, now long out-of-print, by John F. Bromley called TTC ’28. This book provides a view of the system when the electric street railway in Toronto was at its height.

In a recent presentation to the TTC Board, staff argued that the streetcars were an integral part of the growth of Toronto, but their viewpoint was comparatively recent, from the 1950s onward, and even that did not fully show the former extent of the transit network which was once almost entirely operated with streetcars.

I often get questions about the streetcar system as it was, and this article is intended to consolidate the bits and pieces in one place. The route histories will give some indication of why there is so much streetcar track in apparently odd places today. Remember also that the downtown one-way streets date from the 1950s when the DVP/Gardiner recruited several streets as on/off ramps to the expressway network and “optimised” them for use by motorists.

Information for 1928 is taken mainly from Bromley’s book. Other sources are Rails From The Junction by James V. Salmon, Riding the Radials by Robert M. Stamp, and The Toronto Trolley Car Story by Louis H. Pursley.

The following map shows TTC routes in August 1928. It was scanned by Pete Coulman from a guidebook, and the original scan lives on the TransitToronto website’s maps page.

ttc-map-1928-08-22

Only a few routes on this map are bus operations, generally small lines on the periphery of the system.

Serving Downtown

Anyone born in the past half-century is used to the idea that the Yonge-University and Bloor-Danforth subways (now known as Lines 1 and 2 respectively) provide the lion’s share of transit capacity into the core area, supplemented by the streetcar network and GO Transit. However, before the subways opened, their role was provided not just by streetcars on their namesake streets, but on parallel routes that fed into a common area. This was an essential part of service design not simply to spread out the network through many neighbourhoods, but because all of the streetcars needed to serve the core could not fit onto one street.

“Downtown” was quite different from the area we think of today, and much of the development was concentrated south of Dundas with areas to the north more residential than commercial. Construction of Eaton’s College Street store began in 1928, and it was thought to be a huge risk building so far away from downtown. The building is much smaller than original plans because of the combined effect of its location and the recession.

The land around the port and the railway corridor was used mainly for industrial purposes, and the large workforce in these areas required a lot of transit service. This land is now home to tens of thousands as the condo boom recycles the old city and changes travel demands.

Services to downtown in 1928:

  • Bathurst cars ran south from Vaughan Loop at St. Clair to Front, then east to Frederick Loop at Sherbourne Street. (Although there was track linking Bathurst to the Exhibition ground, it was used only during special events such as the CNE or Royal Winter Fair.)
  • Bathurst trippers (peak period cars) ran from Caledonia Loop on St. Clair east to Vaughan/Bathurst, south to Adelaide and then east to Church.
  • Bay cars ran from Caledonia Loop on St. Clair east to Avenue Road, then south to Bloor, east to Bay and south to Ferry Loop (York & Queens Quay where the circular ramp from the Gardiner is today).
  • Beach cars ran between Neville Loop on Queen to Sunnyside Loop west of Roncesvalles. Today the route is 501 Queen.
  • Beach trippers ran from Neville Loop to King & Bay looping via Bay, Wellington and Sherbourne. Today’s 503 Kingston Road Tripper is a descendant of this route.
  • Queen cars ran initially from Bingham Loop on Kingston Road (still in use by routes 502, 503 and 12) looping downtown via Victoria, Richmond and York. During 1928, service was extended east to Birchmount Loop, but streetcar service was cut back to the City of Toronto boundary in 1954 with the creation of “Metro Toronto”. Today’s 502 Downtowner is a descendent of this route.
  • Bloor cars ran between Luttrell Loop (between Dawes Road and Victoria Park on Danforth) and Jane Loop (south side of Bloor opposite the foot of Jane Street).
  • Danforth trippers ran from Luttrell Loop west to Church & Bloor, then south to Queen looping via Queen, York and Richmond.
  • Carlton cars ran between Luttrell Loop and High Park over almost the same route as today’s 506 Carlton. College Street ended at Lansdowne, and so streetcars jogged south to Dundas to continue their trip west.
  • Carlton tripper cars followed the east end route to Parliament, then jogged south to Dundas and west to loop via Victoria, Adelaide and Church.
  • Church cars began at Christie Loop (corner of Dupont & Christie) and ran east via Dupont, Avenue Road and Bloor to Church, then south to loop via Front, Yonge and Wellington.
  • College cars took a rather scenic route from Royce Loop (southeast corner of what is now Lansdowne & Dupont, formerly Royce Street) via Lansdowne, College, Bay, Dundas, Broadview, Gerrard, Carlaw, Riverdale and Pape to Lipton Loop (current site of Pape Station).
  • Harbord cars also originated at Royce Loop, but took a different route into downtown via Lansdowne, Lappin, Dufferin, Hallam, Ossington, Harbord, Spadina and Adelaide to Church looping via Richmond and Victoria. Sunday service followed much of the College route from downtown to Lipton Loop. This evolved eventually into a consolidated Harbord route which was its form until 1966 when the BD subway opened.
  • College trippers ran from Royce Loop to College and McCaul where they turned south and then east to York looping via Richmond, Bay and Adelaide.
  • Dovercourt cars ran from Townsley Loop at St. Clair & Old Weston Road (the loop still exists as the western terminus of 127 Davenport) then later in 1928 from Prescott Loop (a small parkette west of the railway at Caledonia). They operated via Old Weston, Davenport, Dovercourt, College, Ossington, Queen, Shaw to loop via Adelaide, Crawford and King. This route served the Massey-Ferguson industrial district which is now the eastern part of Liberty Village. Peak period service extended via King looping via Church, Front and George Streets. The most substantial remnant of the Dovercourt car is the 63 Ossington bus which was once operated with trolley coaches taking advantage of the electrical system already in place.
  • Dovercourt Trippers originated at Davenport & Dovercourt (reversing using the wye at that location as there was no loop) and followed the main route to King & Church.
  • Dundas cars operated between Runnymede Loop (now the western terminus of 40 Junction) and City Hall Loop (from Bay via Louisa, James and Albert Streets). This route has operated through to Broadview Station (now as the 505) ever since part of City Hall Loop disappeared under the Eaton Centre development.
  • King cars operated over essentially the same route as they do today between Vincent Loop (across the street from Dundas West Station) and Erindale Loop (one block north of Broadview Station). Peak service was extended in the west to Jane Loop and in the east to Danforth & Coxwell with some trippers looping downtown via Sherbourne, Front and Bay.
  • Parliament cars ran from Viaduct Loop (now a parkette at Bloor & Parliament) south to Queen then west to loop via Church, Richmond and Victoria.
  • Sherbourne cars ran from Rosedale Loop (at Rachael Street) south to King and then west to York and Front to Station Loop (Simcoe, Station and York Streets). Peak service operated east to Danforth & Coxwell rather than to Rosedale Loop.
  • Spadina operated with double-end cars between crossovers at Bloor and Front.
  • Yonge cars operated between Glen Echo Loop (east side of Yonge, just before the hill down to Hogg’s Hollow, the originally proposed name for York Mills Station) and Station Loop. Short turn services operated as far north as Lawton Loop (now a parkette on the west side of Yonge north of Heath Street) and AM peak trippers originated at Eglinton Carhouse (of which parts remain in the bus garage now recycled into a “temporary” bus terminal).

This is a huge number of routes that collectively linked the commercial and industrial core of Toronto to the residential neighbourhoods, some of which were comparatively recent “suburbs”.

The level of service was equally impressive. In the table below, numbers under “Two-Car Trains” give the number of trains (a motor car plus a trailer) operated followed by the total number of runs so that, for example, the Beach car has 44 runs of which 37 operated with trailers.

Route                 PM Peak      Two-Car
                      Headway      Trains

Bathurst                2'00"        3/30
Bathurst Tripper        5'00"        9/14
Bay                     1'15"
Beach                   2'30"        37/44
Beach Tripper           3'00"
Bloor                   3'00"        All 41
Carlton                 3'00"
Carlton Tripper         4'00"        14/17
Church                  4'00"
College                 4'00"        2/23
College Tripper         7'00"
Danforth Tripper        7'30"        7/10
Dovercourt              2'45"
Dovercourt Tripper      4'00"
Dundas                  2'00"
Harbord                 2'30"
King                    2'00"        31/54
King Rush               4'00"
Parliament              3'00"
Queen                   5'00"        16/17
Queen Tripper           5'00"
Sherbourne Tripper      2'45"        10/26
Spadina                 2'45"
Yonge                   1'45"        All 42

The West End and Suburbs

In addition to many routes listed above, a few were entirely “local” to their areas, and others were part of separate suburban network, the lines called “radials” that had been built separately from the “city” system.

  • The Davenport route was a remnant of a longer route on the Toronto Suburban Railway, but by 1928 was reduced to operating a shuttle service from Bathurst to Dovercourt. It survived until 1940 when it was replaced by a bus.
  • Lansdowne operated as two separate routes because of the railway level crossing (now an underpass) north of Dupont (Royce). The Lansdowne North route operated as a shuttle from St. Clair to the north side of the railway. Service from Royce Loop southward was provided by the College car weekdays and Saturdays, but there was a Lansdowne South Sunday service from Royce Loop to Dundas.

The TTC operated routes for York Township under contract.

  • Oakwood cars operated from Oakwood Loop at St. Clair (still existing) north to Eglinton and west to Gilbert Loop (west of Caledonia Road).
  • Rogers Road cars also operated from Oakwood Loop north to Rogers and west to Bicknell Loop (east of Weston Road).
  • Lambton cars, a remnant of the Toronto Suburban Railway, operated from Runnymede Loop west to Lambton Park. The line did not carry well, and it was converted to a bus route in August 1928.
  • Weston Road cars operated from Keele & Dundas north to Humber Street in Weston. This was another TSR line that originally had operated to Woodbridge (1914-1926). The line was converted to TTC gauge in stages, and for a time ended at a loop at Northland Avenue (at the City limits).

The Oakwood and Rogers routes eventually became trolley coach lines as part of what is now 63 Ossington, although Rogers Road has been extended and split off from Ossington for many years. The Weston Road route also became a trolley coach, although streetcar service remained as a peak-only extension of St. Clair until 1966. That extension was not possible until the opening of the “St. Clair Subway” under the Weston rail corridor in 1932, and the streetcars originally operated to Northland Loop. That is the reason why St. Clair cars were signed “Northland” even after they were extended to Avon Loop at Rogers Road.

Another leftover from the radial system was the line on Lake Shore Boulevard West.

  • Mimico cars operated from Roncesvalles Carhouse via the old trackage on Lake Shore (pre-Gardiner Expressway) west to Stavebank Road, just east of the Credit River in Port Credit. In the fall of 1928, the city trackage was extended to Long Branch, and the “Mimico” route disappeared. “Port Credit” cars ran on the remaining “radial” line until February 1935.

Updated: I have been remiss when listing routes operating in 1928 by omitting the Toronto Suburban’s line to Guelph. This was not a TTC operation, but remained part of CN’s electric operations to the end.

The line began at Keele & St. Clair, but was abandoned in 1931. This electric railway was never extended into downtown and suffered from its “suburban” nature even though its terminus was on the CN corridor now used by GO’s Kitchener-Waterloo service. The small station building remained for decades after. A fragment of the line still sees streetcar operation as the Halton County Radial Railway museum.

The East End and Suburbs

Most of the services in the east end ran to the downtown area and they are included in the main list above.

  • Coxwell cars shuttled between Danforth and Queen with Sunday/Holiday service extended via Queen and Kingston Road to Bingham Loop. This route exists almost unchanged today.

Service on Kingston Road east of Victoria Park was provided by the Scarboro radial car to a point east of Morningside Avenue where Kingston Road and Old Kingston Road diverge today. In late 1928, the line was double-tracked to Birchmount, the city routes were extended into Scarborough and the radial service operated from there east. Rail service ended in two stages: east of Scarborough Post Office in 1930, and the rest of the line in 1936 to allow highway widening.

The North End and Suburbs

The northernmost of the remaining streetcar lines is on St. Clair. In 1928, it operated from Caledonia Loop to Mt. Pleasant Loop at Eglinton, although service on St. Clair was also provided by the Bay and Bathurst cars west to Caledonia (see above). Eventually, the line was extended west to Keele Loop (replaced now by Gunn’s Loop) when the underpasses at Caledonia (1931) and at Weston Road (1932) opened. Caledonia and Prescott Loops were no longer needed.

By far the most extensive of the radial lines was the Metropolitan Division of the Toronto & York Radial Railway. This was not taken over by the TTC until 1927. Cars ran from Glen Echo Terminal north to Richmond Hill and Lake Simcoe with the line ending in Sutton. Service operated every 15-20 minutes during peak periods to/from Richmond Hill with some cars running through to Newmarket every 45-60 minutes all day. Cars to and from Sutton operated every two hours or so leaving from Sutton between 5:50 am and 10:25 pm with a running time of 2 hours and 25 minutes. The Lake Simcoe route was cut back to Richmond Hill in 1930.