
Delays in the arrival of the new Bombardier Flexity streetcars, together with last summer’s sauna conditions on the Bloor-Danforth subway, make for ongoing concern about the condition of the TTC’s fleet. Statistics in the January 2017 CEO’s Report triggered media reports and a discussion at the recent TTC Board Meeting.
The numbers, although presented in what is supposed to be an “industry standard” format, lead to much confusion for a variety of reasons:
- The basic standard is that any fault causing a delay of five minutes or greater counts, while all others do not.
- A fault that might delay a bus or streetcar (doors not working) may not count against the subway because there is so much redundancy.
- There is no distinction between a fault that represents a severe failure of a component or a minor annoyance that simply caused a long enough delay to be counted. Similarly, the cost and effort needed to repair faults does not contribute to the metric.
- Faults are reported “per vehicle kilometre”, but many subsystems fail more on the basis of hours in operation (how long has an air conditioner been running), or number of cycles (how many times did doors open and close).
- For a specific fleet and type of operation, hours and kilometres are interchangeable because the fleet operates at a consistent average speed within its frame of reference.
- Fleets (or even subsets of fleets) operating under different conditions (average speed, frequency of stops, loads and grades) will not have the same ratio of hourly-based to distance-based faults. Direct comparison of distance-based statistics between these conditions is meaningless. For example, a well known problem in comparing streetcars with buses is that bus routes tend to operate in suburban conditions at relatively high average speeds. When they shift to more congested, densely used routes, their operating characteristics change. (It is self-evident that fuel consumption is affected by route conditions, and operator wages are paid per hour, not per kilometre. Slower buses run fewer kilometres. Time-based wear and tear, and associated reliability stats will rise when expressed on the basis of distance.)
- Some fleets are a uniform age, while others are diverse.
- Toronto’s rail fleets have major vehicle groups each of which was sourced as a single large order: The T1 (BD) and TR (YUS) subway car fleets; the CLRV, ALRV and Flexity streetcar fleets; and the SRT.
- The bus fleet has a wider range of ages and technologies, and so its statistics are the combined effect of vehicles over a range of ages and conditions.
- For a list of the TTC fleet by type, see the last page of any Scheduled Service Summary such as the one for January 2017. These are available on the TTC’s Planning webpage.
In the figures reported by the CEO, these issues are not explored in detail, but are at best mentioned in a few footnotes. Unsurprisingly, the media and politicians (even transit pundits) can jump to the wrong conclusion about what the stats actually mean.
To ensure that even without taking these factors into account, we are dealing with similar methodologies for each fleet, I asked the TTC whether the same principles apply across the system.
SM: Is it correct that there is a different set of criteria for a “defect” charged to the streetcar fleets and to the subway fleet? Are the criteria used for buses yet another way of measuring defect rates, or are they the same as for streetcars?
TTC: Same principle applies. In principle, the calculation of MKBD is the same for each mode. Overall vehicle reliability is dependent upon component and systems reliability.
MKBD is calculated from the number of chargeable Road Calls and Change Offs (RCCO) during service. The definition of a chargeable RCCO is any disruption to revenue service caused by a preventable equipment failure. This definition is applied to all modes of operation. It should, however, be noted that there are slight differences to the criteria of RCCO for each mode. For example, a failure to a set of doors on a subway train may not cause a disruption or a delay to service. Line mechanics may respond to the failure and barricade the inoperable doors. This may happen with no impact to customer or to service. This is due to the fact that subways have multiple sets of doors that customers can enter or egress from. Transit Control, therefore, may decide not to remove a train from service if one set of doors is inoperable. For a 40’ bus, however, the option to continue in service with a set of inoperable doors is not an option. Passenger flow on and off the bus will be significantly impacted. Therefore, in this case … the same equipment failure may be handled differently on buses, streetcars and subways. Differences in types of equipment, life cycles of these equipment and operating environments will also contribute to the differences in calculating RCCO and MKBD between modes. [Email of January 16, 2017]
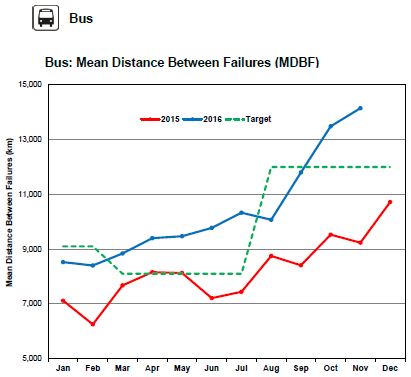
Bus Fleet
There are three major groups of vehicles in the bus fleet, although within these there are subgroups depending on vendor, age, and overhaul status:
- Regular sized (12m) diesels
- Regular sized (12m) diesel-electric hybrids
- Articulated (18m) diesels
Reliability numbers are not reported separately within the CEO’s report although the TTC does have them.
Garage technical staff continues to focus on quality repairs and analysis of repeaters as well as heating and cooling systems. Maintenance facilities staff will continue to focus efforts on the quality of repairs. [p. 44]
It is quite clear that the TTC has achieved a considerable improvement in bus reliability. An outstanding issue, however, is the proposed move to pro-active maintenance with the cycle time for routine inspection and overhauls reduced to a level below the failure rate. This would require a larger number of spare buses, and the City has not yet approved the funding needed for this regime. TTC fleet plans include a large order of new buses in the short term using new subsidy money from Ottawa. This will temporarily give Toronto a “younger” fleet with higher reliability, but in the longer term, as the fleet ages, the average reliability could fall.
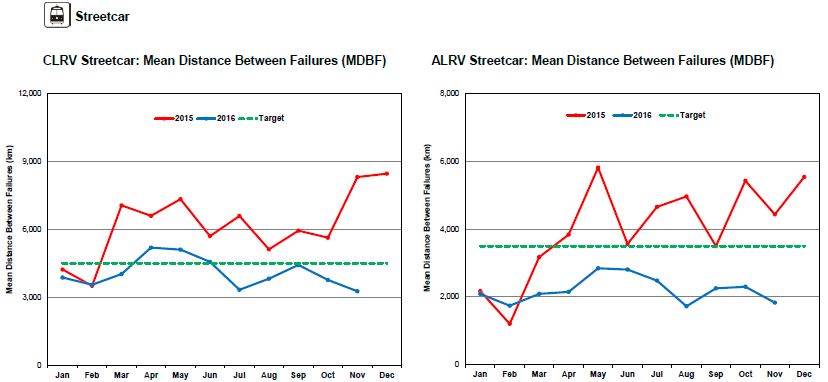
Streetcar Fleets
The media latched onto a chart showing that the Flexity cars are “failing” at a rate very much below the target level set in the contract with Bombardier, and the stats have not been improving for several months. [CEO’s Report, p. 43]
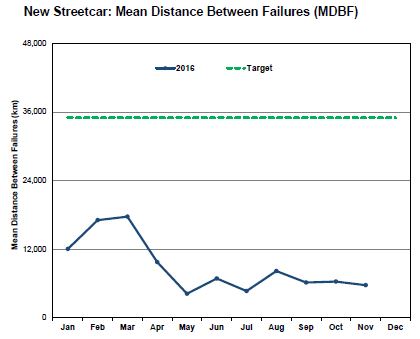
CEO Andy Byford went to some lengths to stress that many of these “failures” are small, but because of how the statistic is derived it gives the impression that cars that are basically quite reliable are not up to snuff. The situation is complicated by the fact that this metric is part of the contracted target for Bombardier.
TTC management stress that the numbers will not improve until there is a larger fleet because the average is dragged down by the relatively small amount of mileage accumulated by the fleet as a whole, and the fact that small numbers of failures can have a large effect on the average.
I explored this issue with the TTC:
SM: With respect to the Flexity cars, they showed good stats until about April 2015 and then fell to the current level from which they are very slowly recovering. The explanation is that there are not enough cars in the fleet to get reliable stats yet. That argument only holds water if comparatively “new” cars have a higher defect rate, and there are not enough “older” cars without such problems to dilute the defects and raise the MKPD value closer to the target. Is this a correct assumption?
TTC: The assumption is NOT correct due to the complexity of Reliability Theories. The first few cars could have problems that could surface over a statistically probable time – wiper motor shaft or bearing, trolley pole base insulators, etc. start to fail after a number of cycles, for example. These point to the need to have statistically meaningful (accumulated) fleet miles in connection with the Growth Rate of defects and vehicles.
SM: A related question is: what is the “burn in” time for a “new” car to reach the point that its MKPD is at the level of an “older” car? In other words, how long does it take to work through the trivial problems on a new car?
TTC: Reliability performance is largely random. Certainly there are repeater cars that are monitored and addressed. Based on the originally negotiated contract through the “structured multi-phase bid process” that all carbuilders agreed upon (Siemens, Alstom and Bombardier at the last phase of the SMPBP, reliability performance should reach “maturity” or “stabilized” at around 60 cars for the 204 car order.
These are valid arguments, but at some point the “fixes” to cars already in service should begin to improve the overall numbers. It would be troubling if new problems continue to appear as the vehicles age, and obviously the frequency of “failures”, however defined, must be reduced if the fleet is to reach anywhere near its target performance.
On a related point, CEO Andy Byford has agreed to include the delivery schedule for the Flexity cars in future CEO Reports starting in February 2017.
As for the “legacy” streetcar fleets, their performance numbers reflect their age which is beyond the limit usually associated with rail vehicle design. These numbers could improve as cars now in the shops for major overhauls return to service, but this could also be offset by the declining reliability of the remaining fleet. The degree to which old cars stay in service will be determined by Flexity delivery rates and by the degree to which buses are available to replace streetcar services.
Subway Fleets
There are two fleets of subway cars:
- The TR trains operating on Lines 1 Yonge-University-Spadina and 4 Sheppard. As of December 13, 2016, only two 6-car sets for YUS and two 4-car sets for Sheppard remained to be delivered. [Source: January 2017 Scheduled Service Summary]
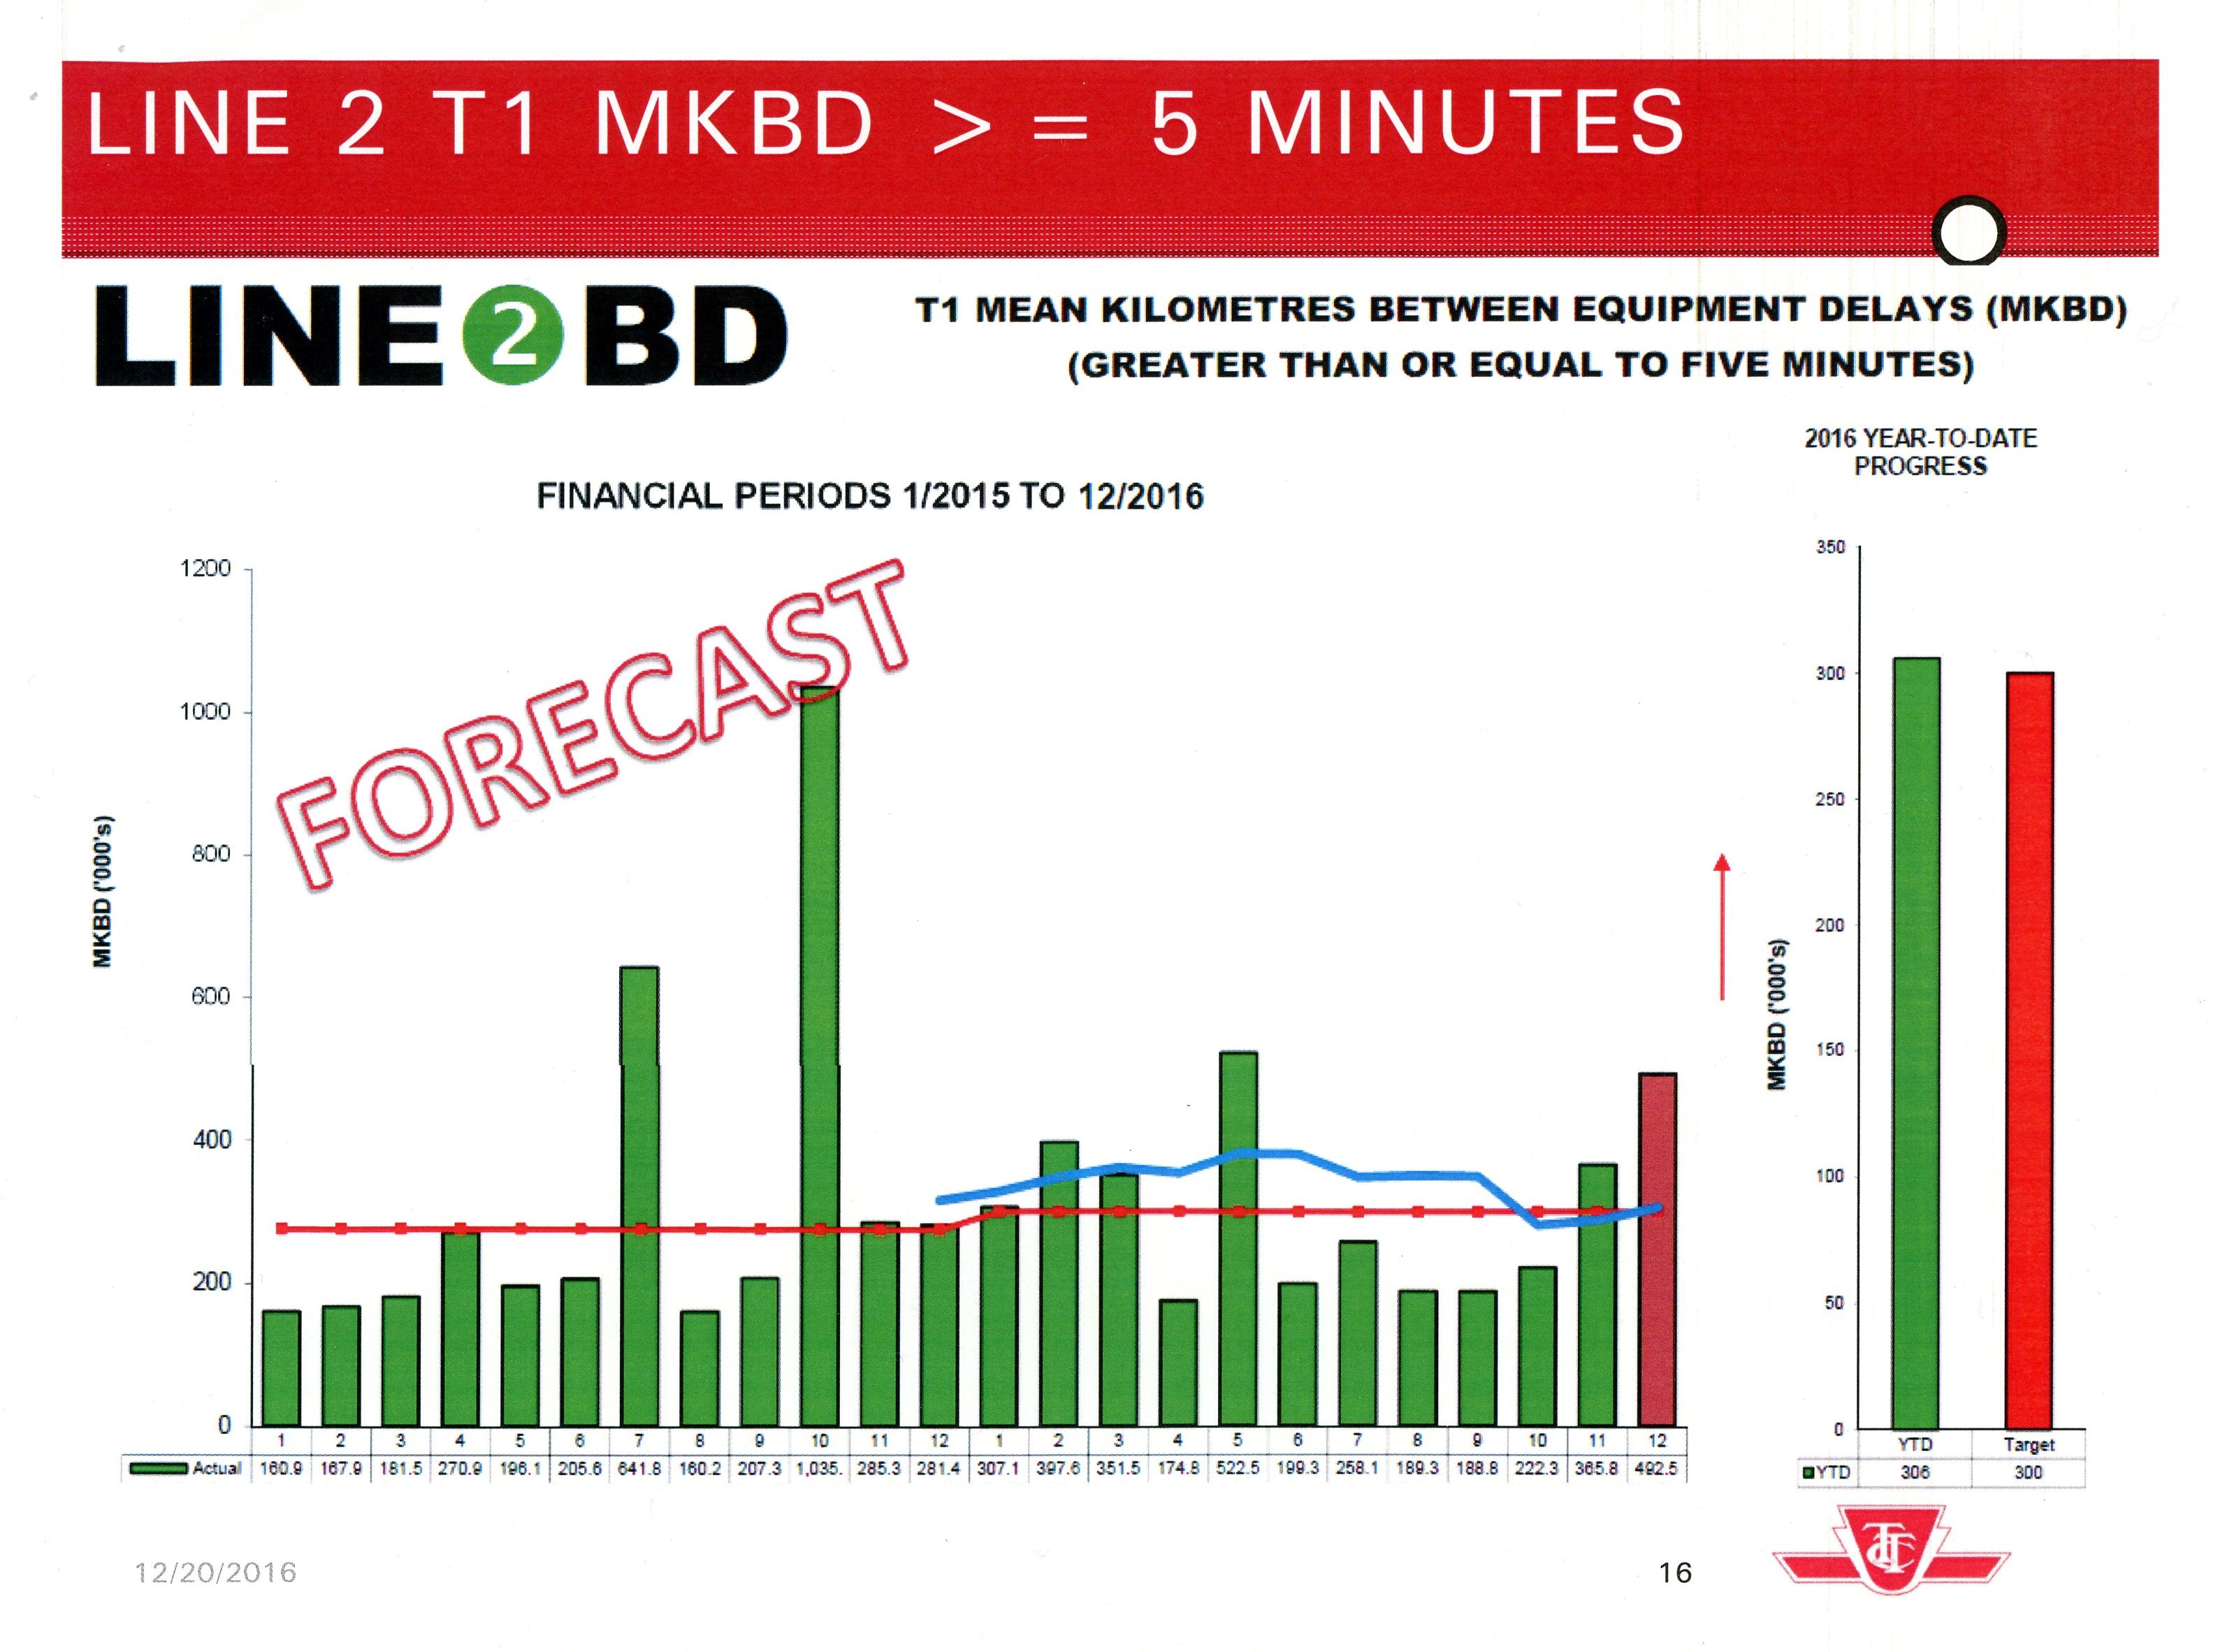
- The T1 trains operating on Line 2 Bloor-Danforth. This fleet was delivered between 1995 and 2001.
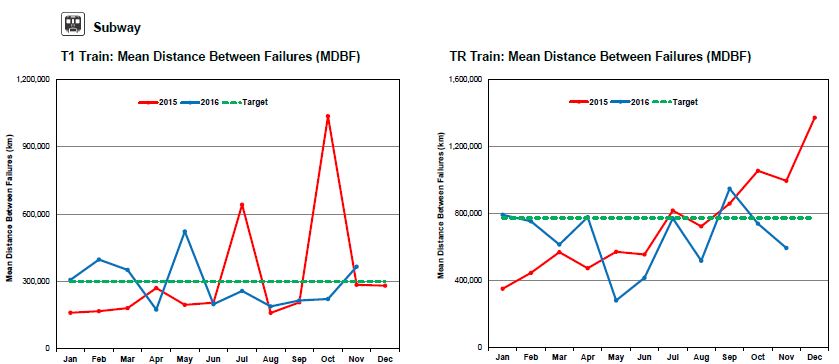
The target for T1 reliability is lower than for the TRs because of their age, and because design changes with the TRs are supposed to give improve reliability for this fleet. Whether this will be achieved over their lifetime remains to be seen.
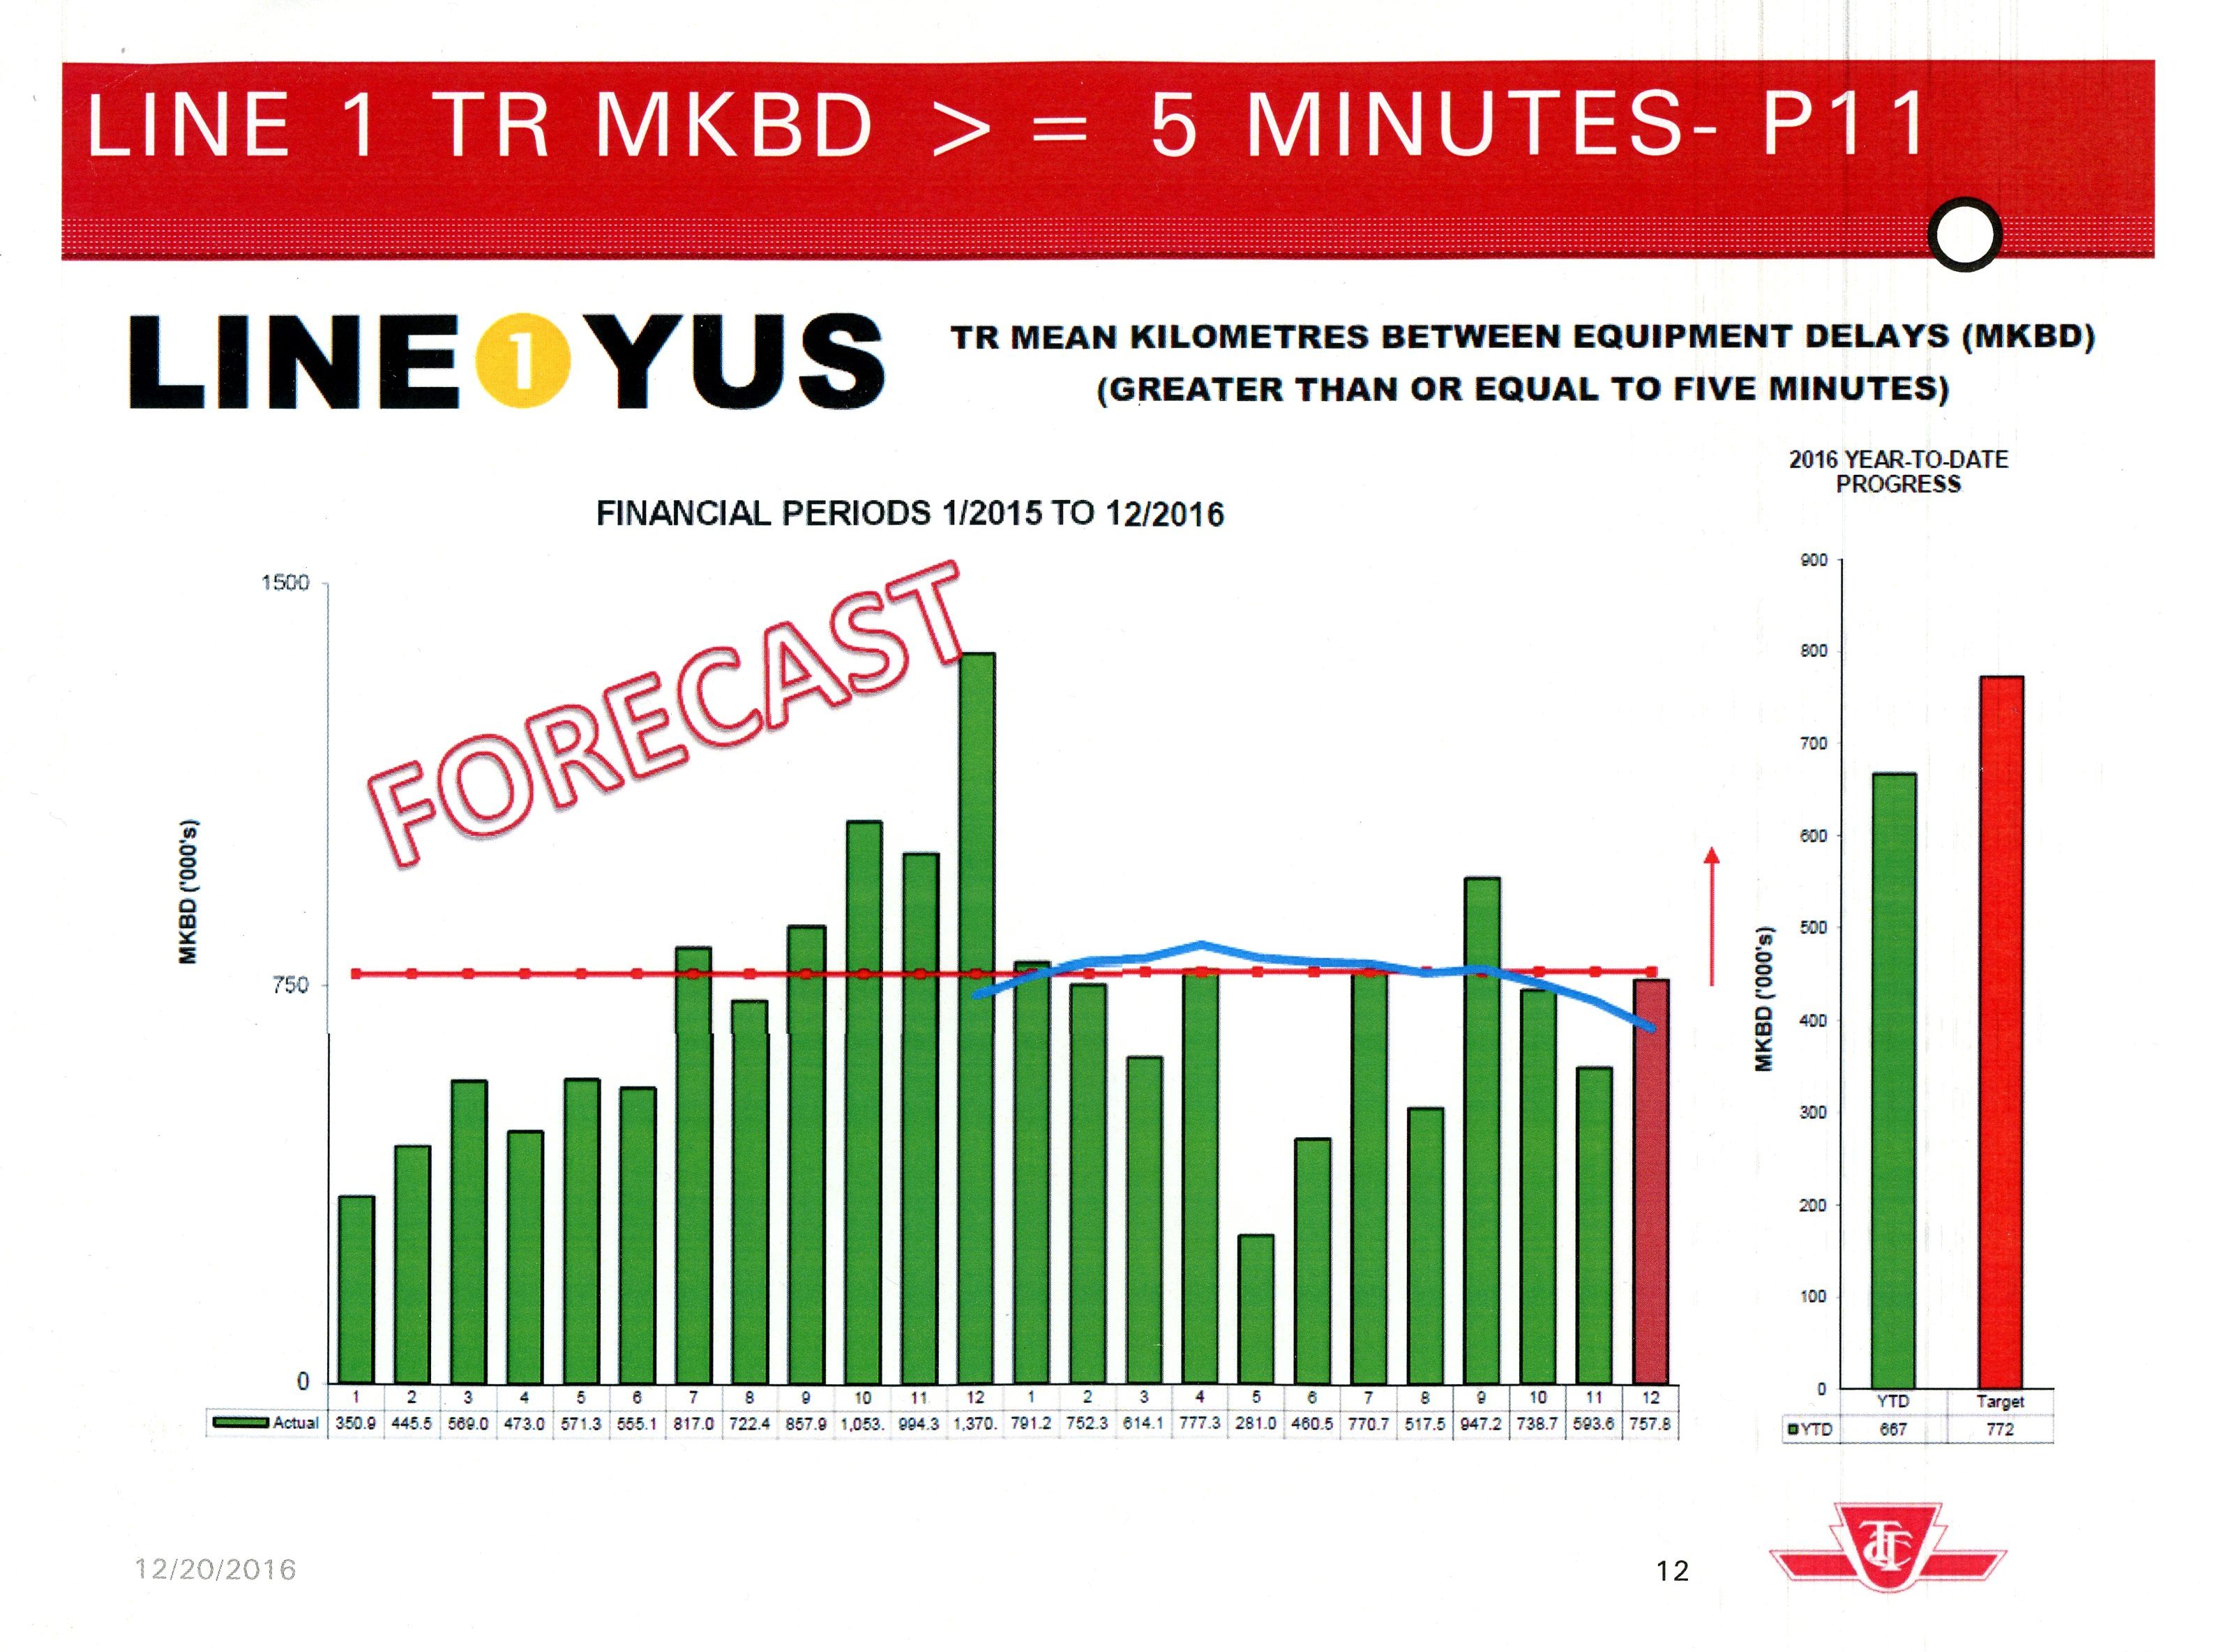
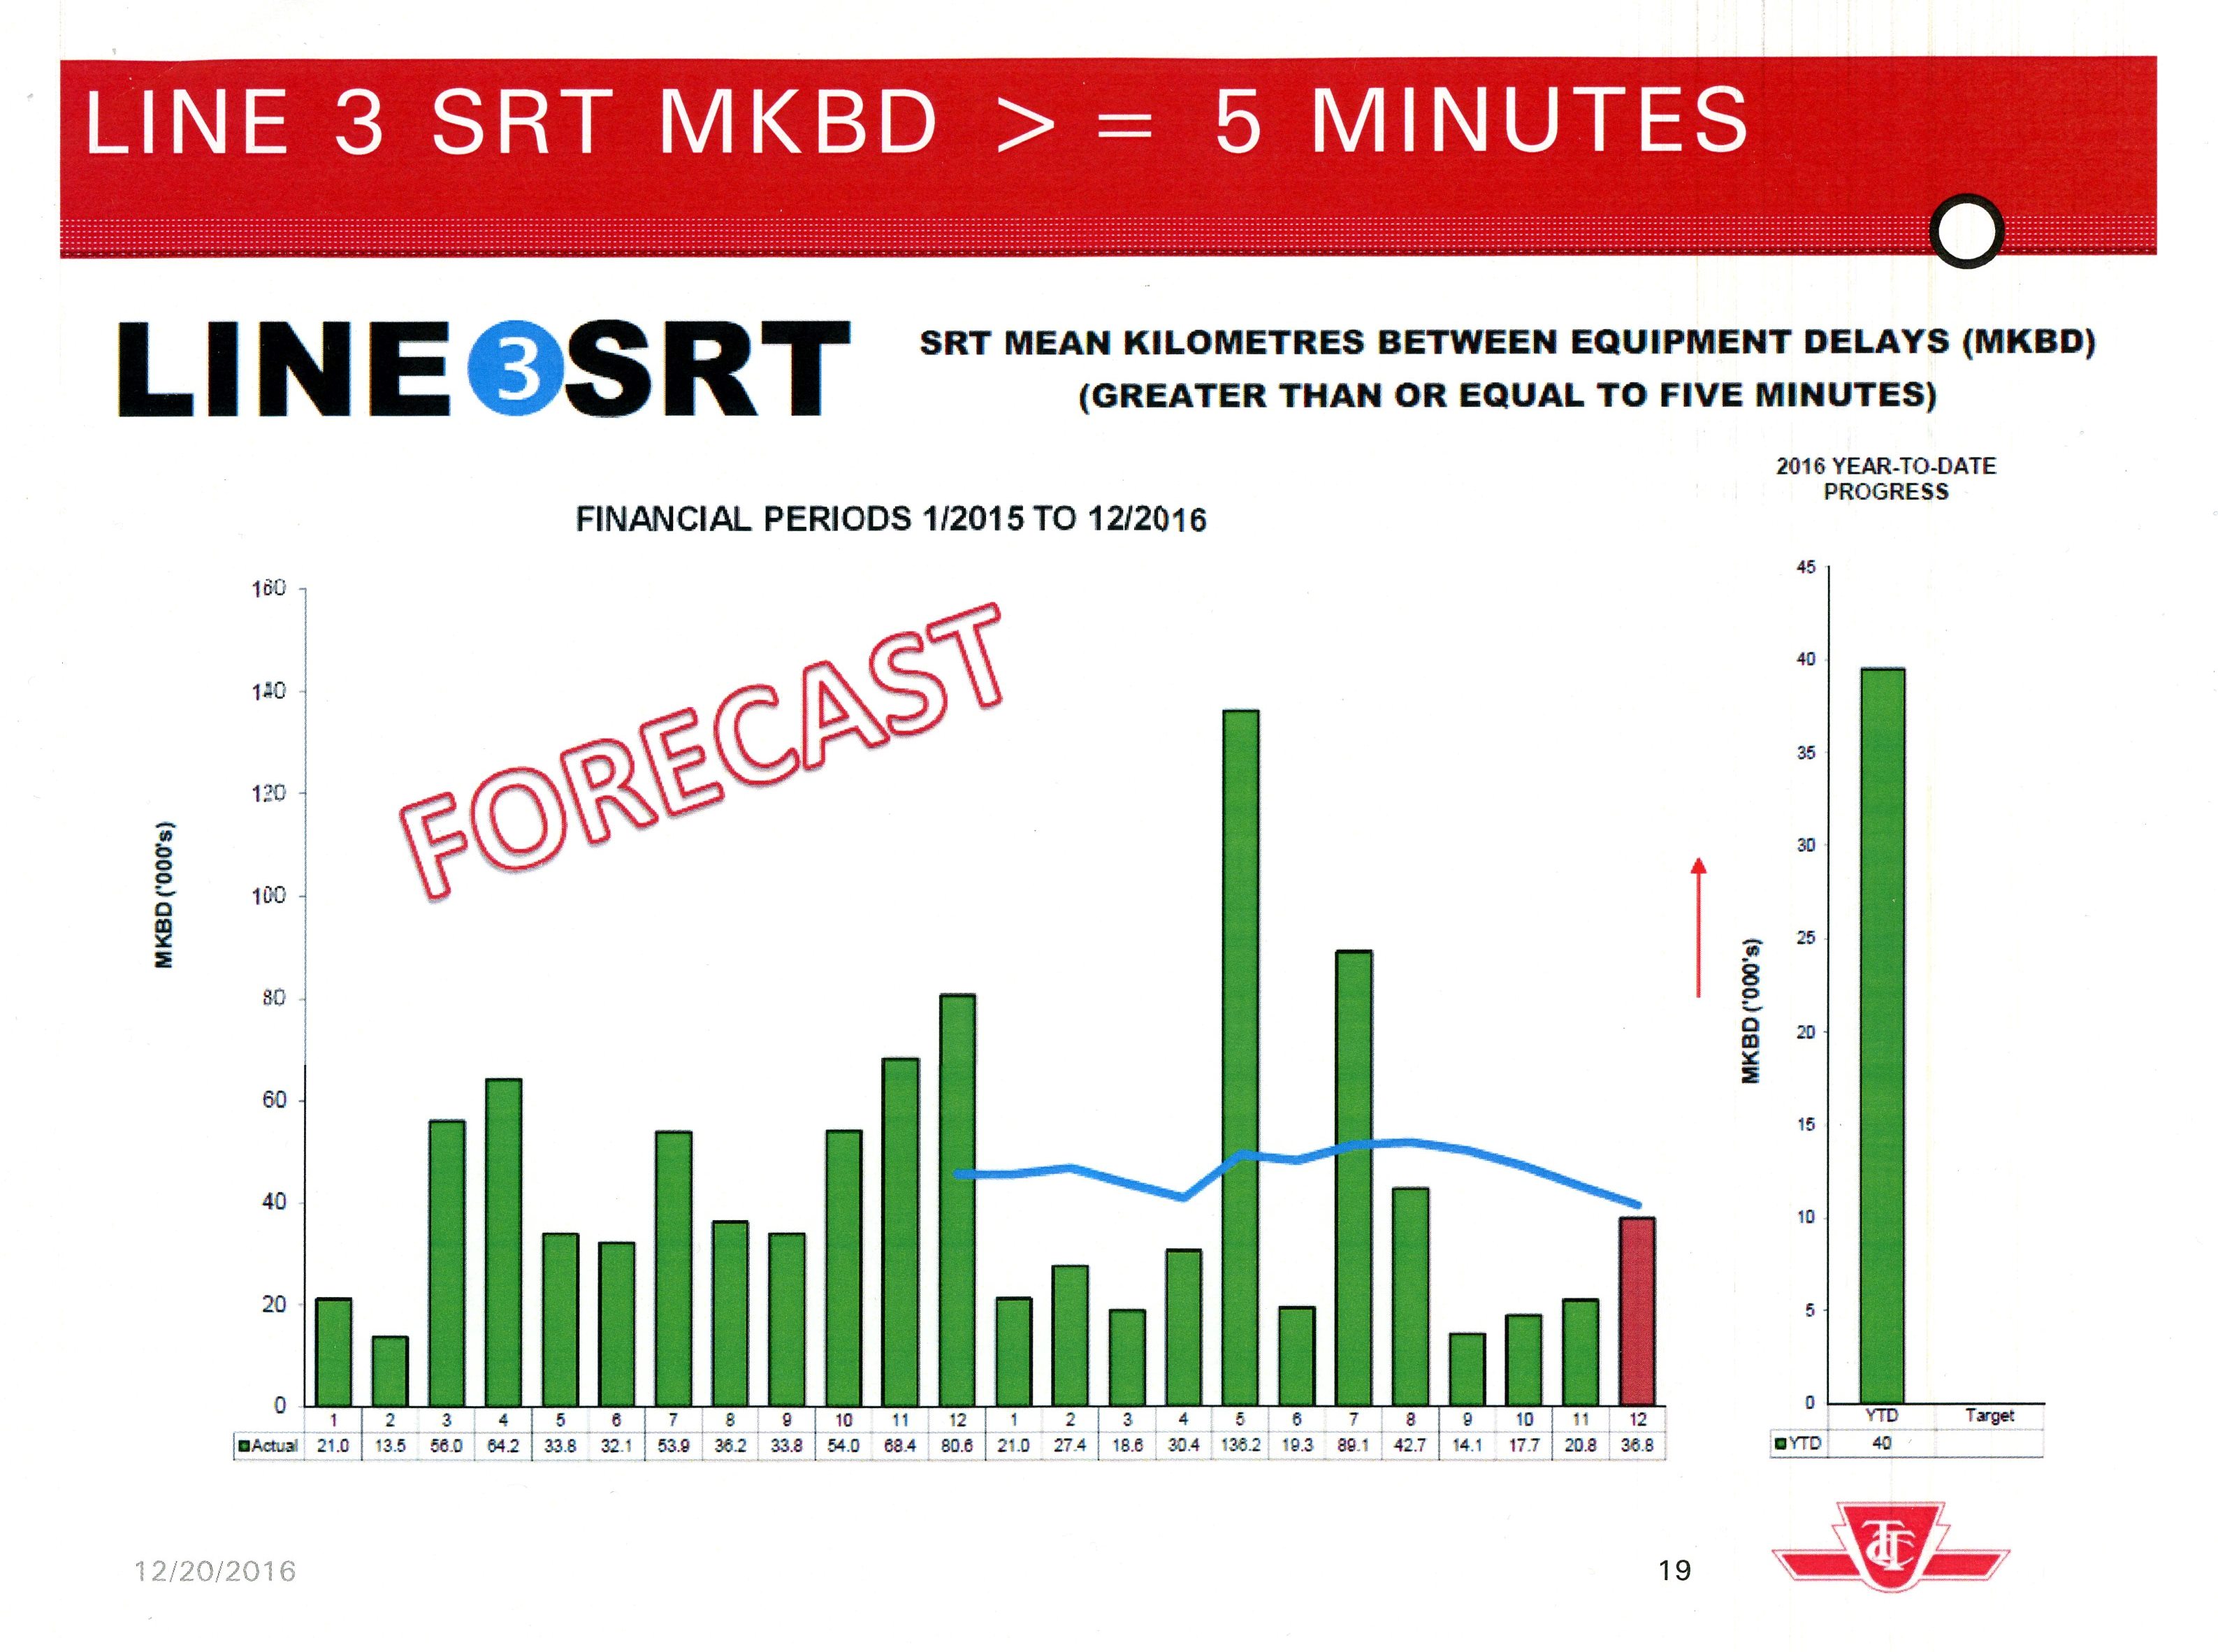
The “spiky” nature of values in these charts is caused by the fact that the number of failures is small, and so the averages bounce up and down from month to month. More detail on reliability is available from internal reports that are not included with the CEO’s report. (The following charts are courtesy of Mike Palmer, Acting Chief Operating Officer.)
The first two charts illustrate the effect of a low number of incidents (“Actual Defects” in the table) on the wide swing in monthly reported values.
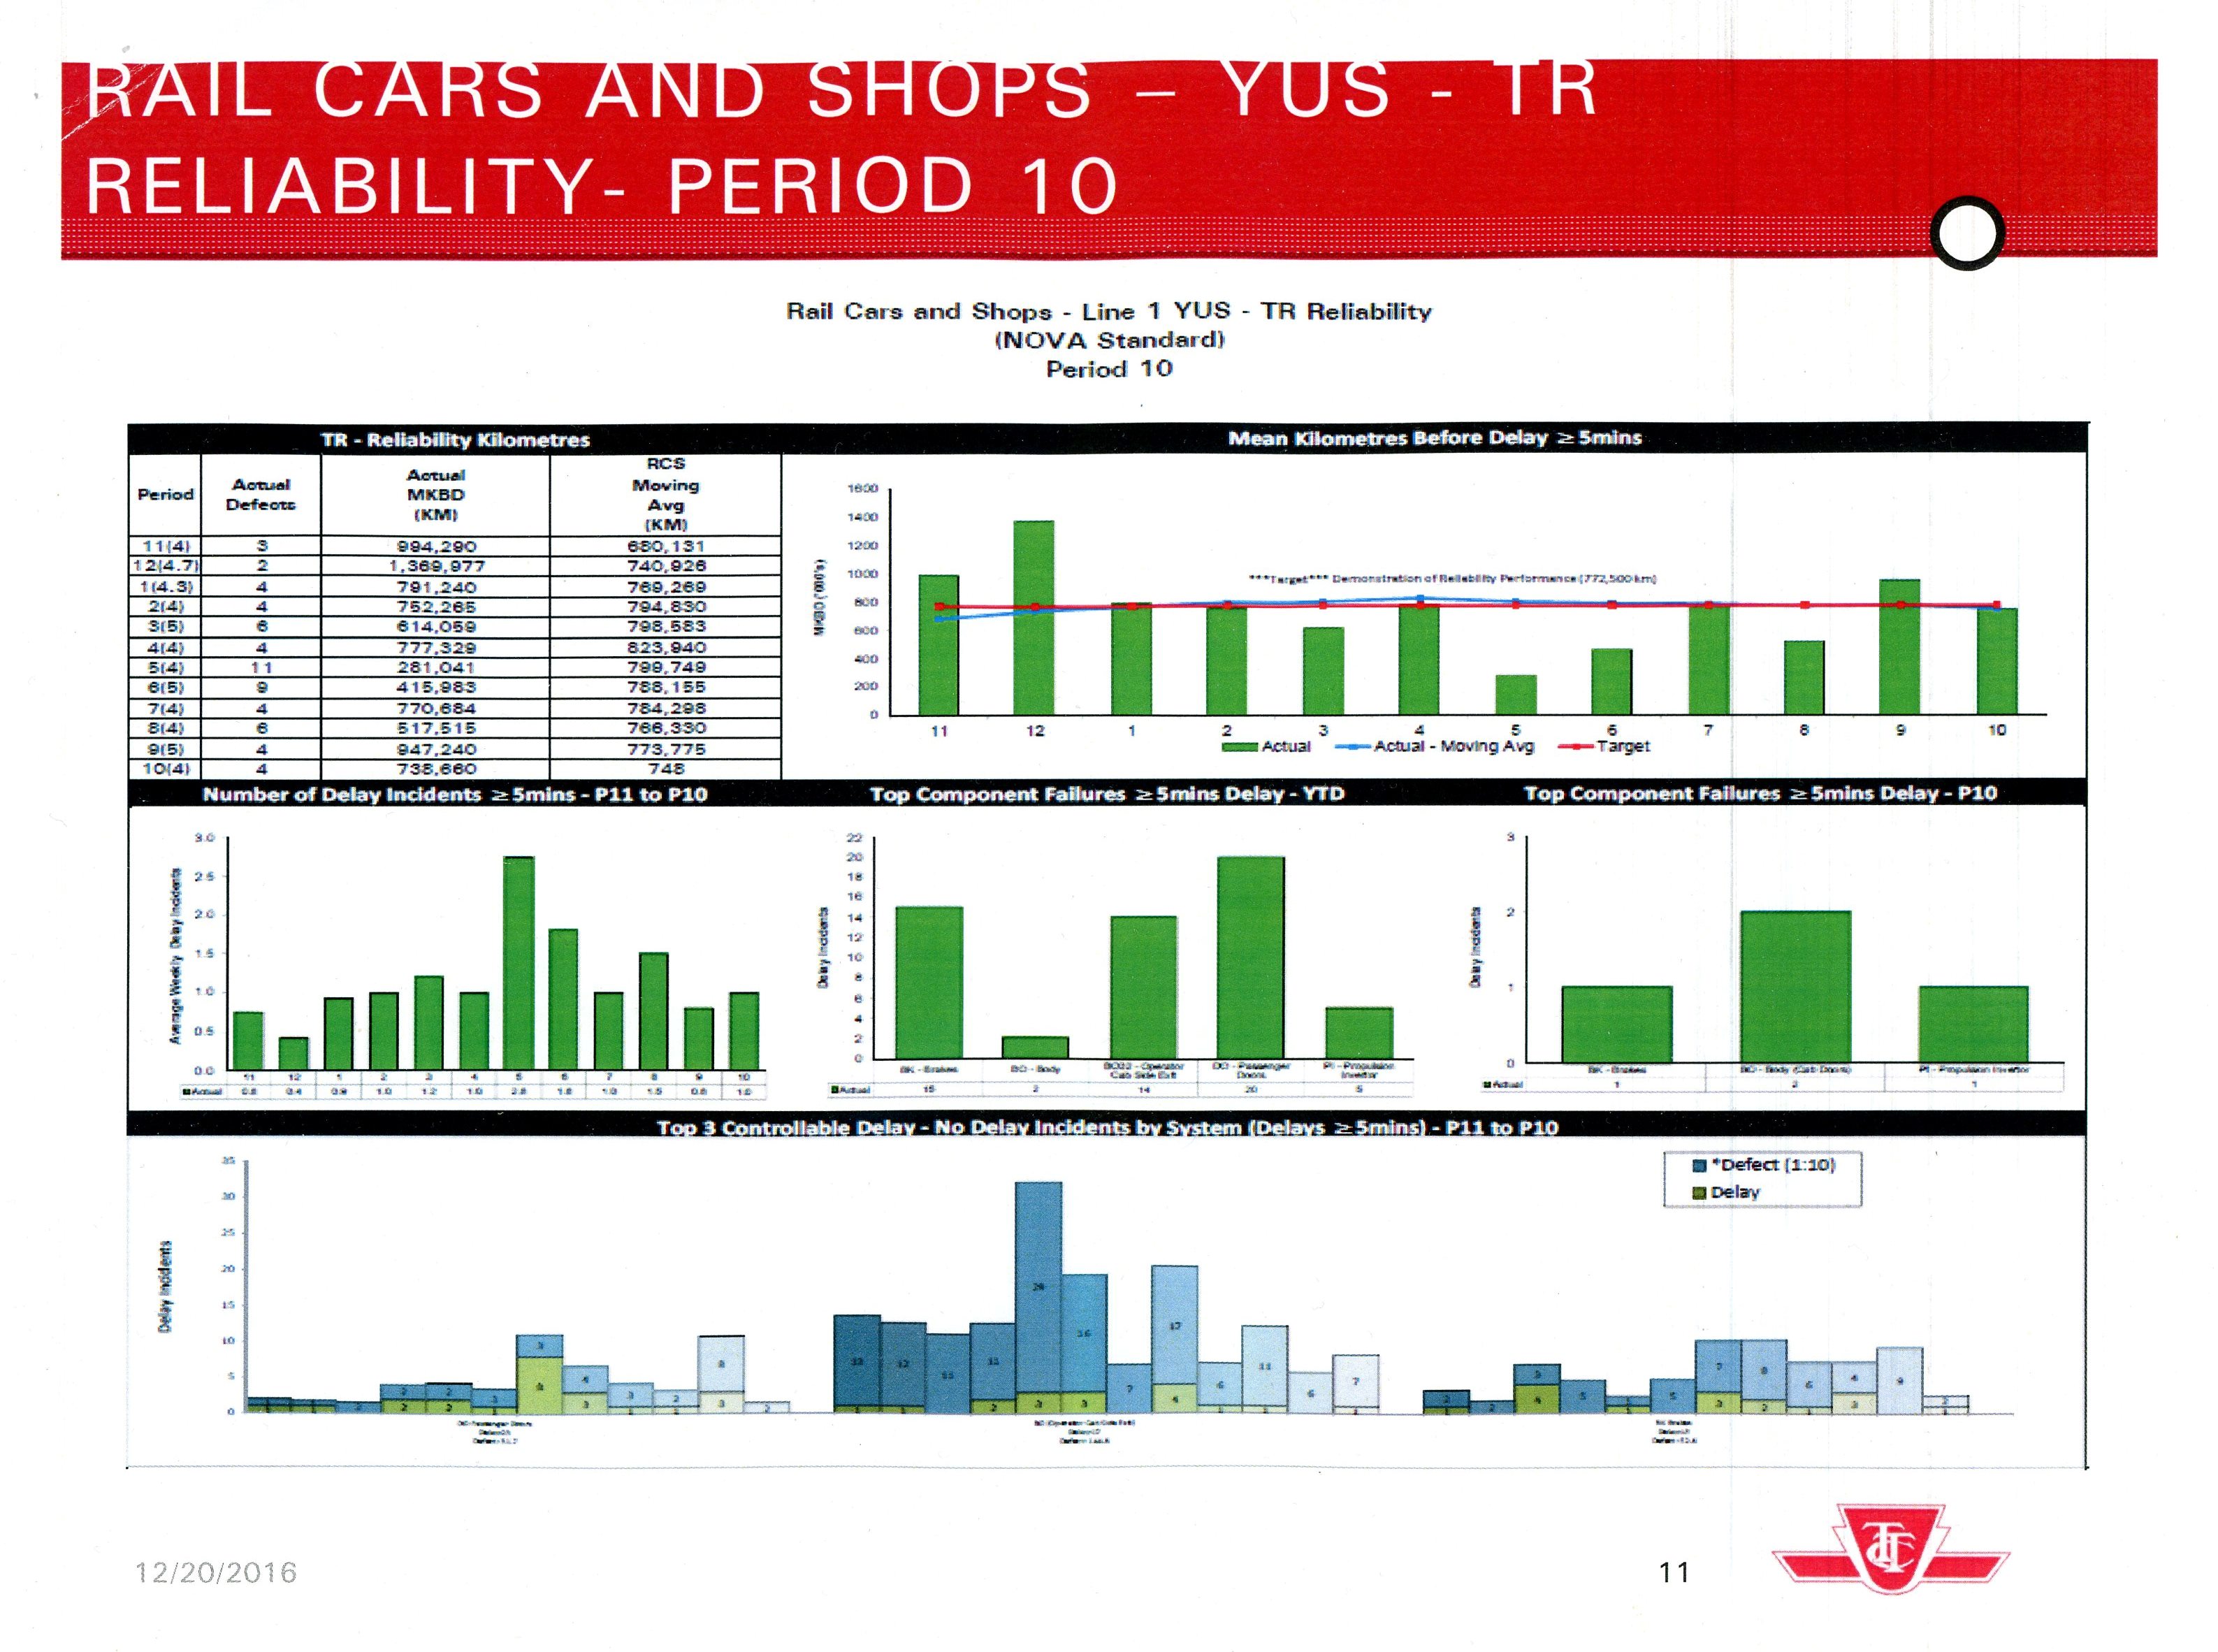
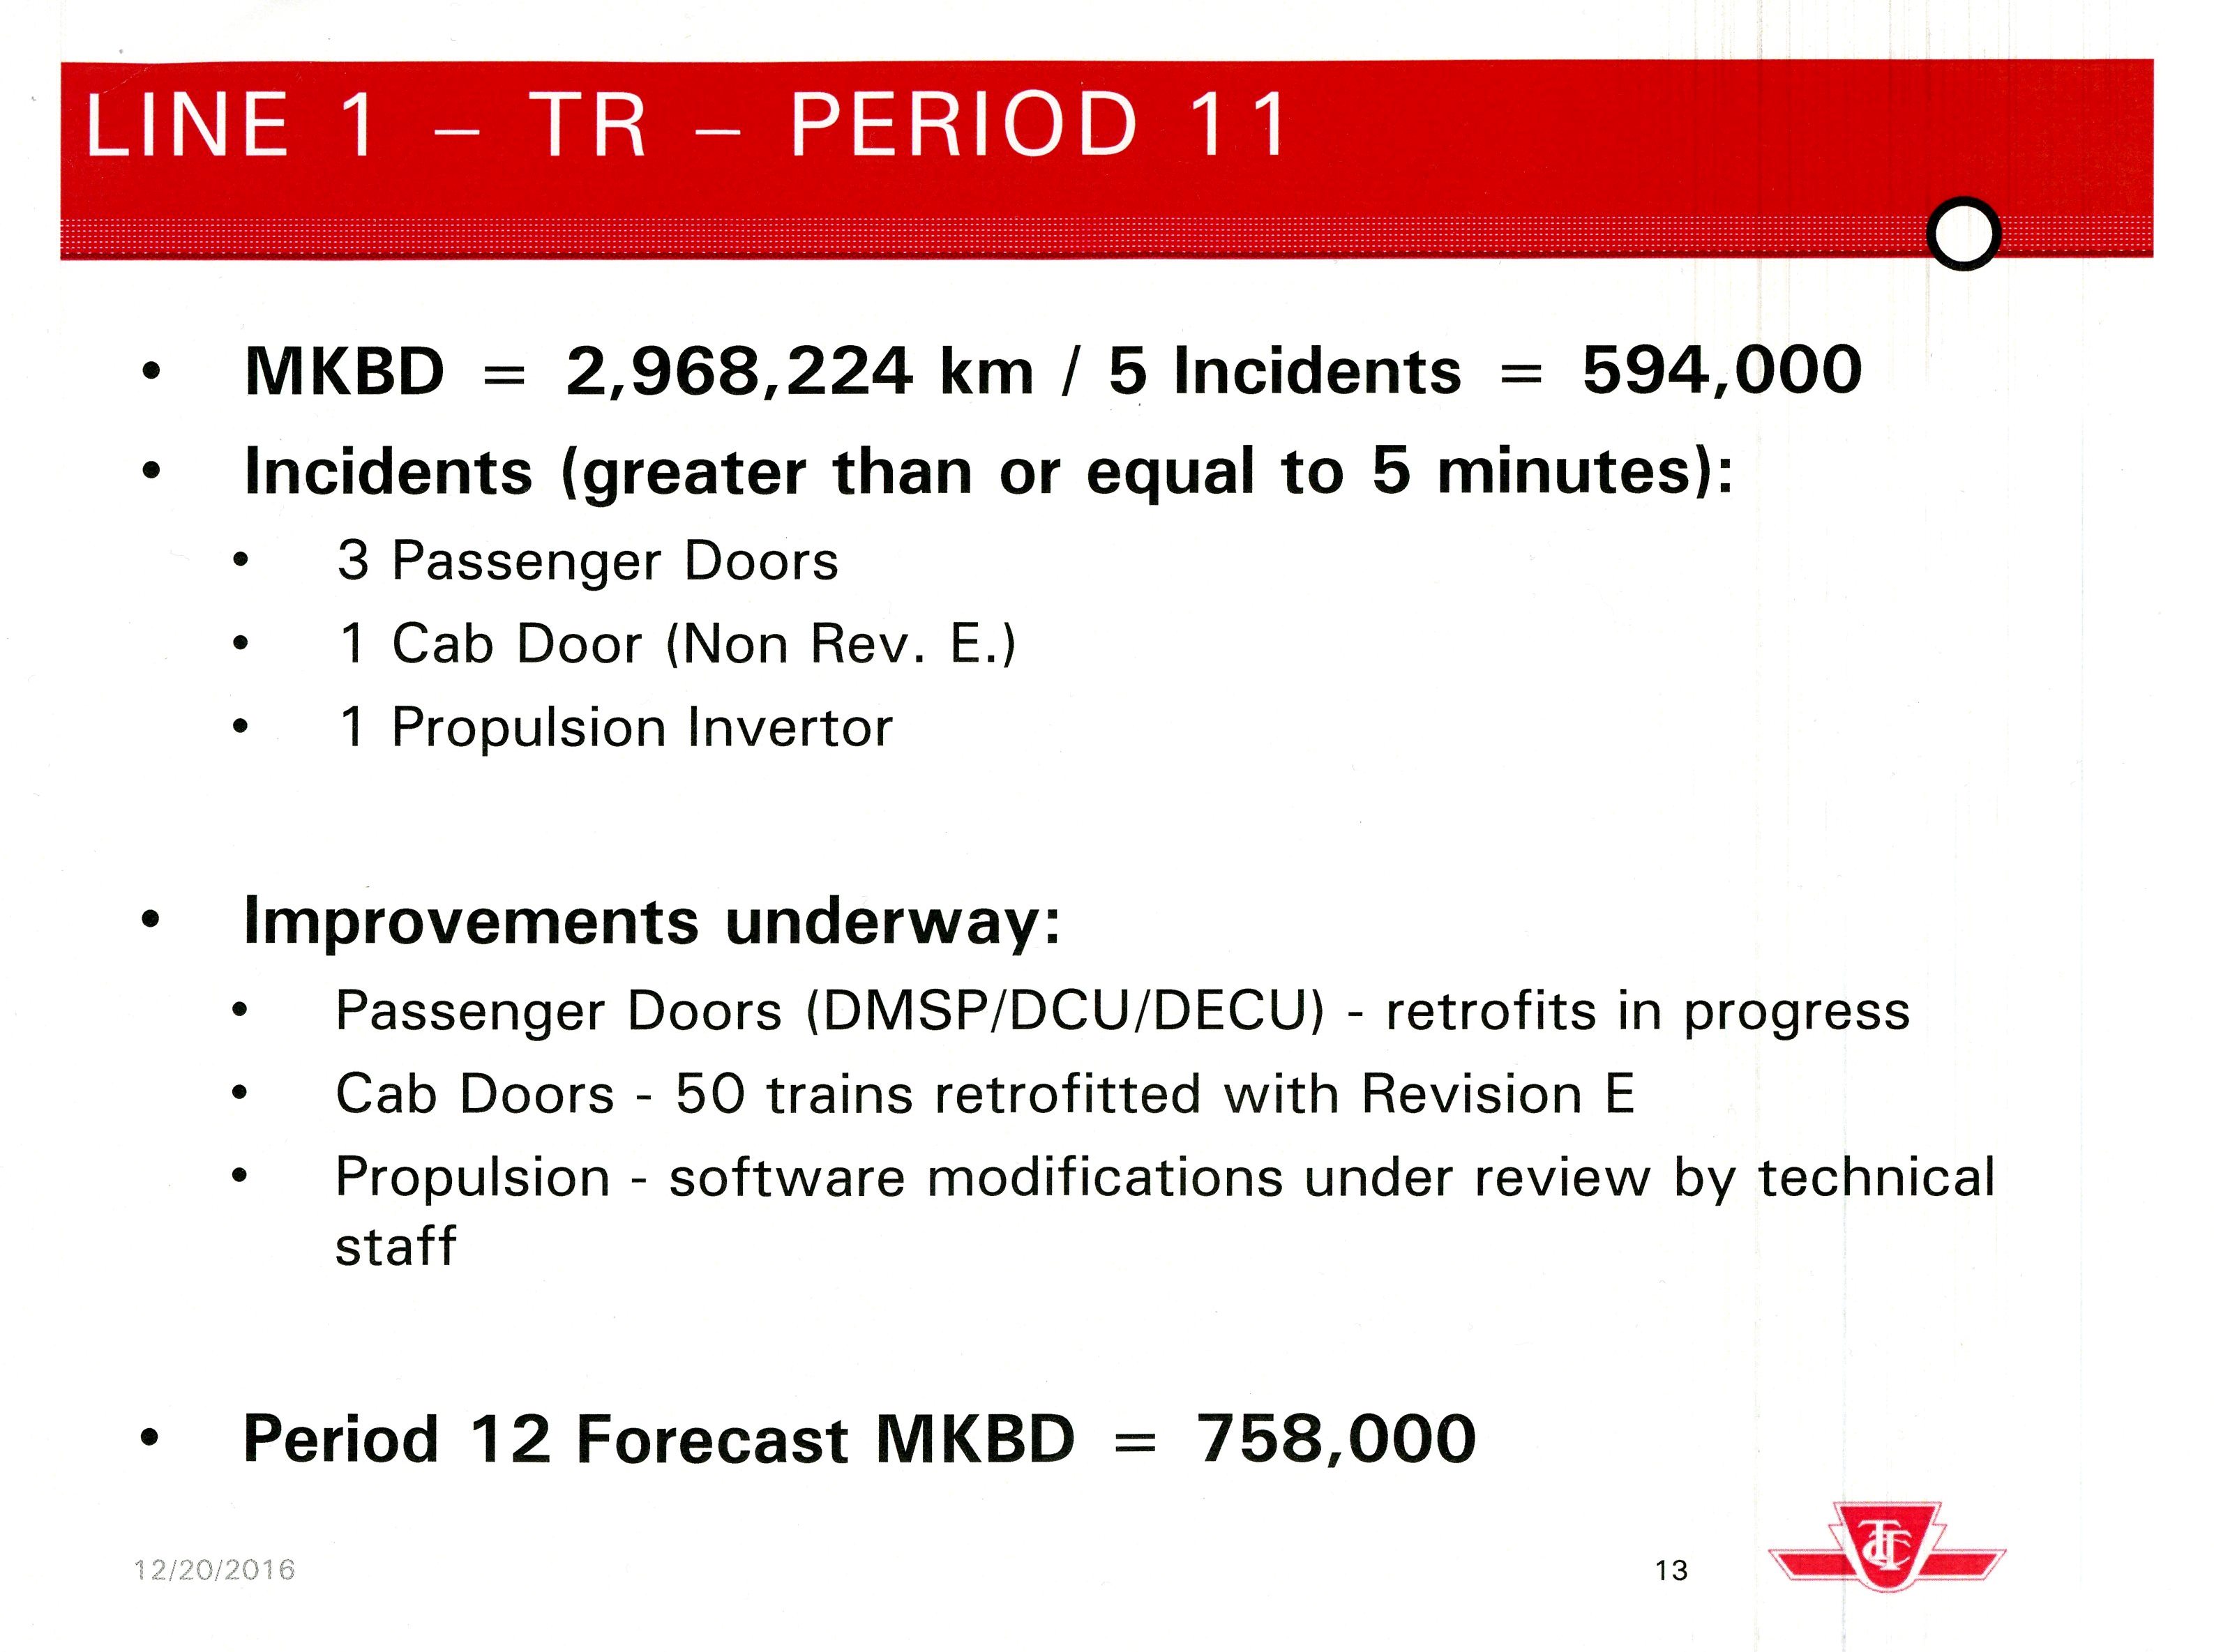
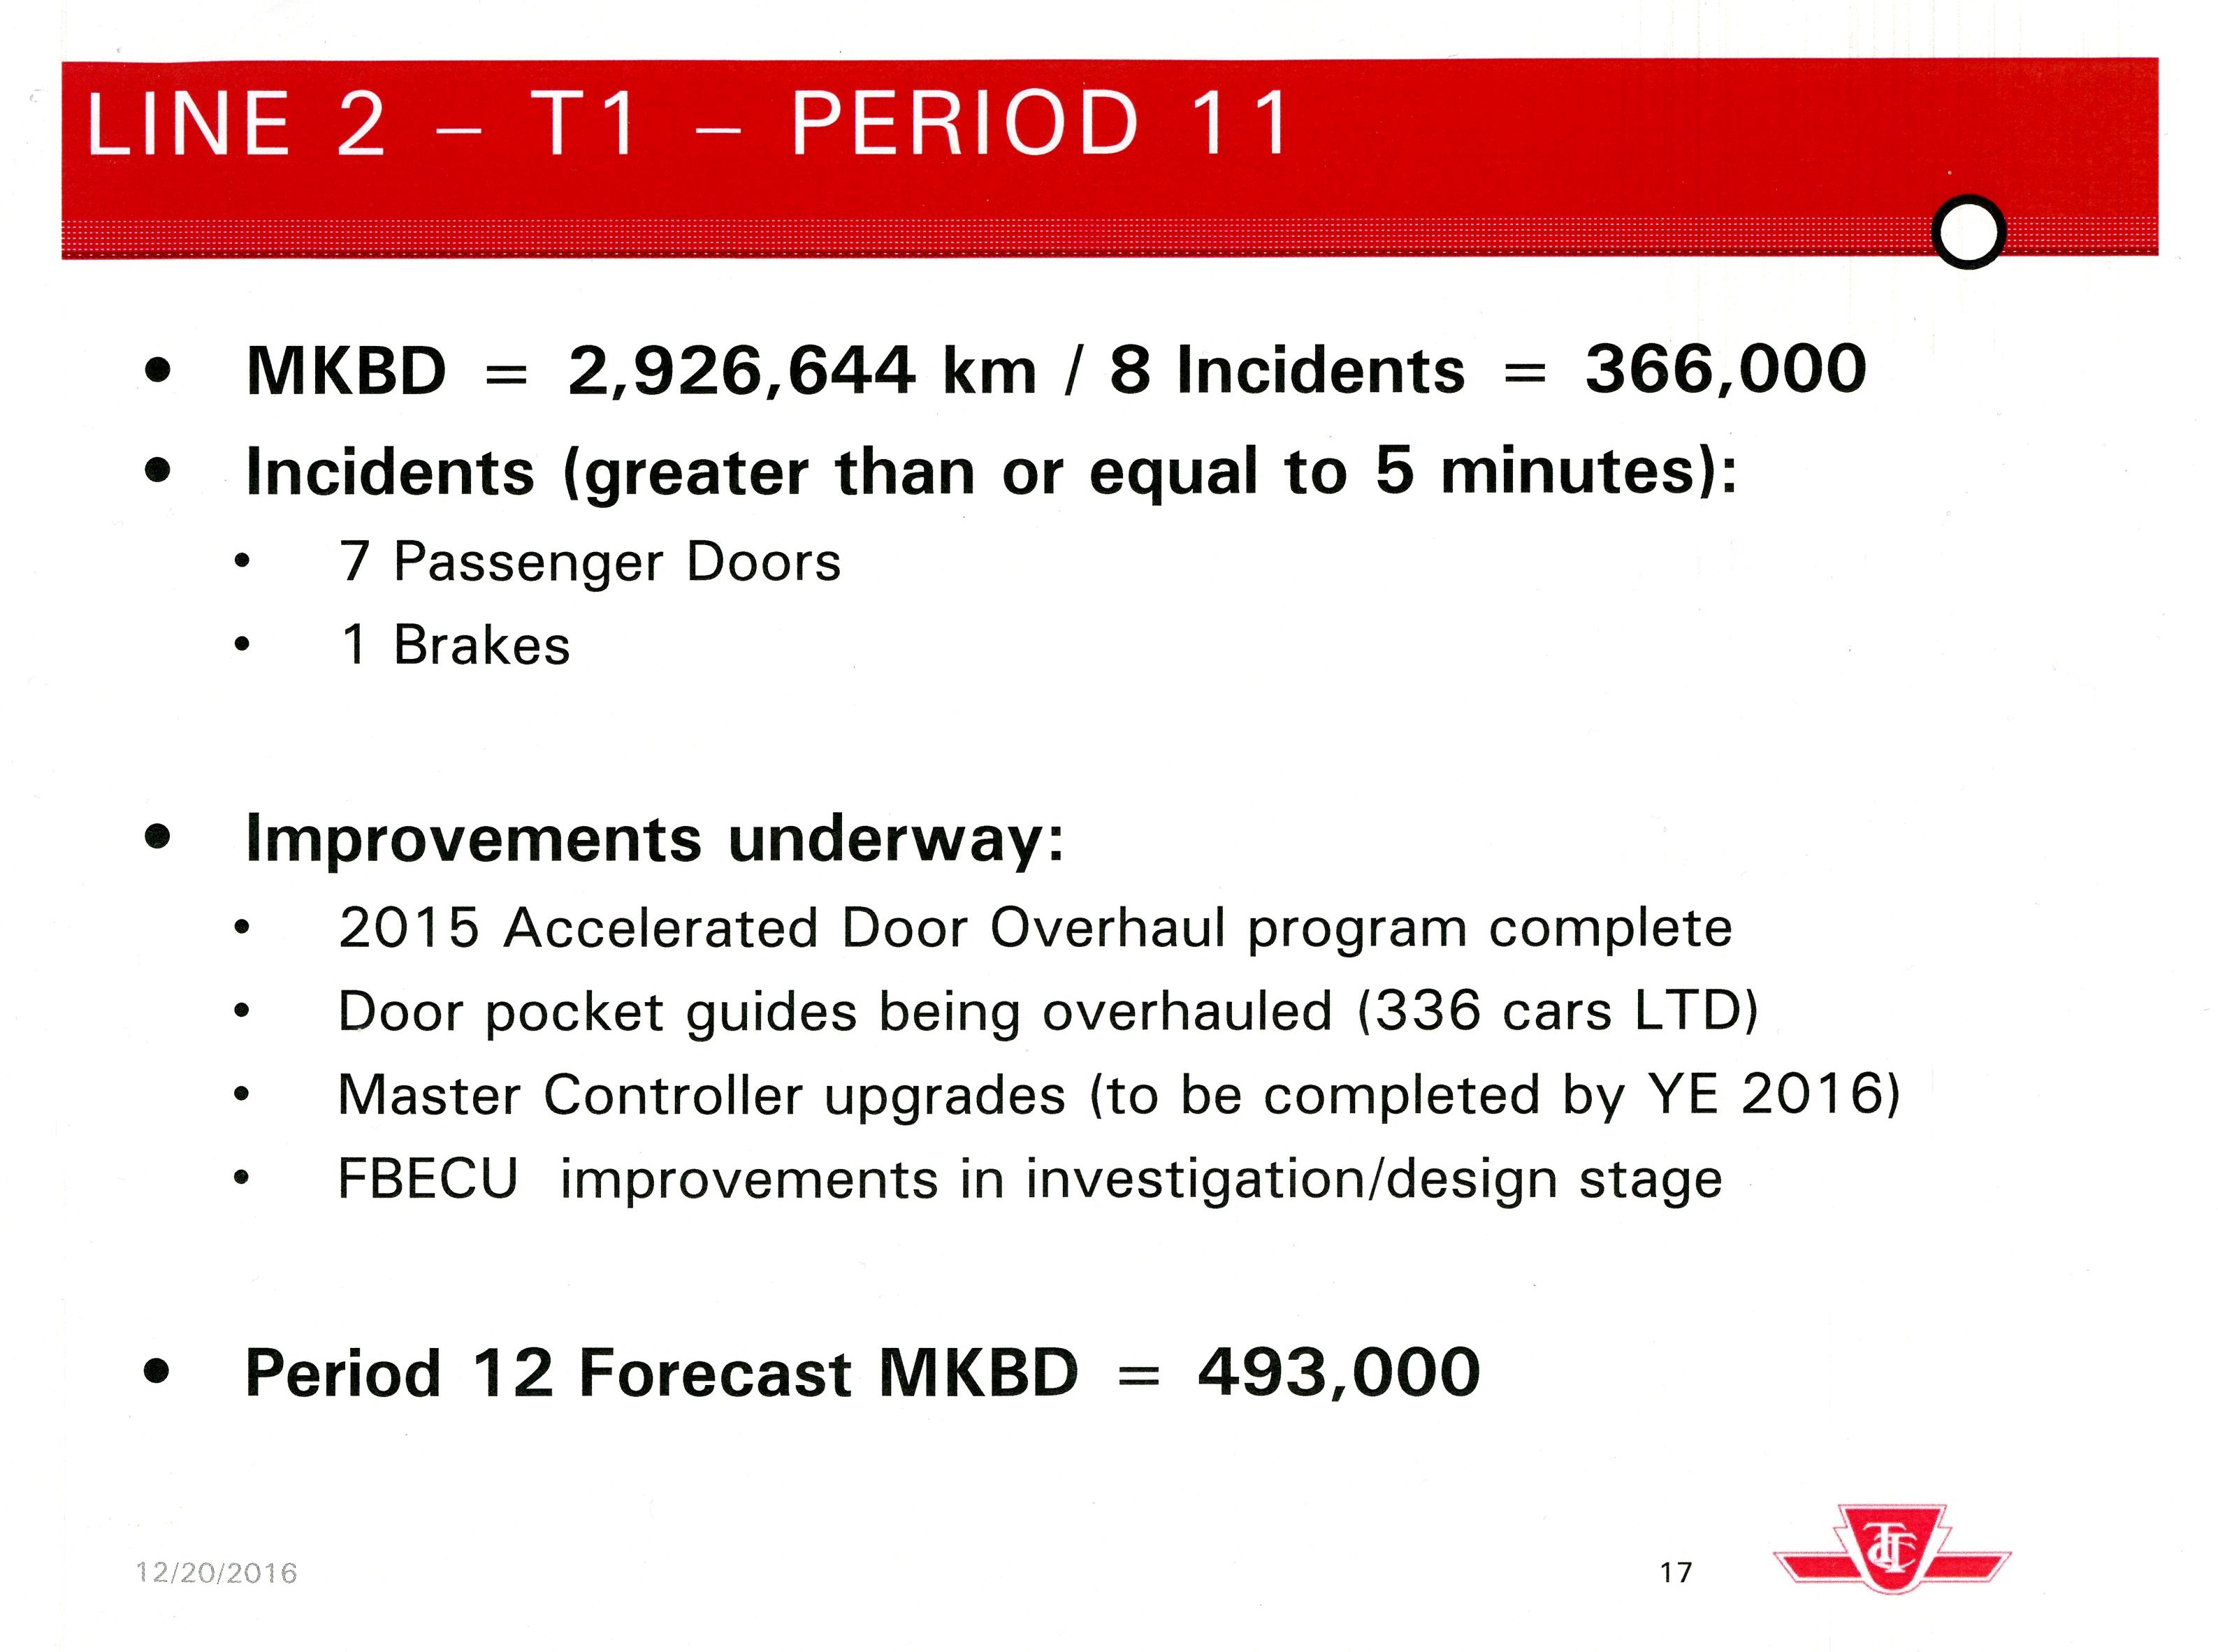
A considerable source of failure is with the passenger doors, typically because they are forced off of their tracks by passengers. Whether these incidents are due to inappropriate behaviour, or due to crowding, is not reported. Another type of failure that has been noted in several CEO Reports is associated with the external cab door. This door has an interlock that prevents train movement when the door is open, and a design revision is in progress across the fleet to eliminate this as a source of delay.
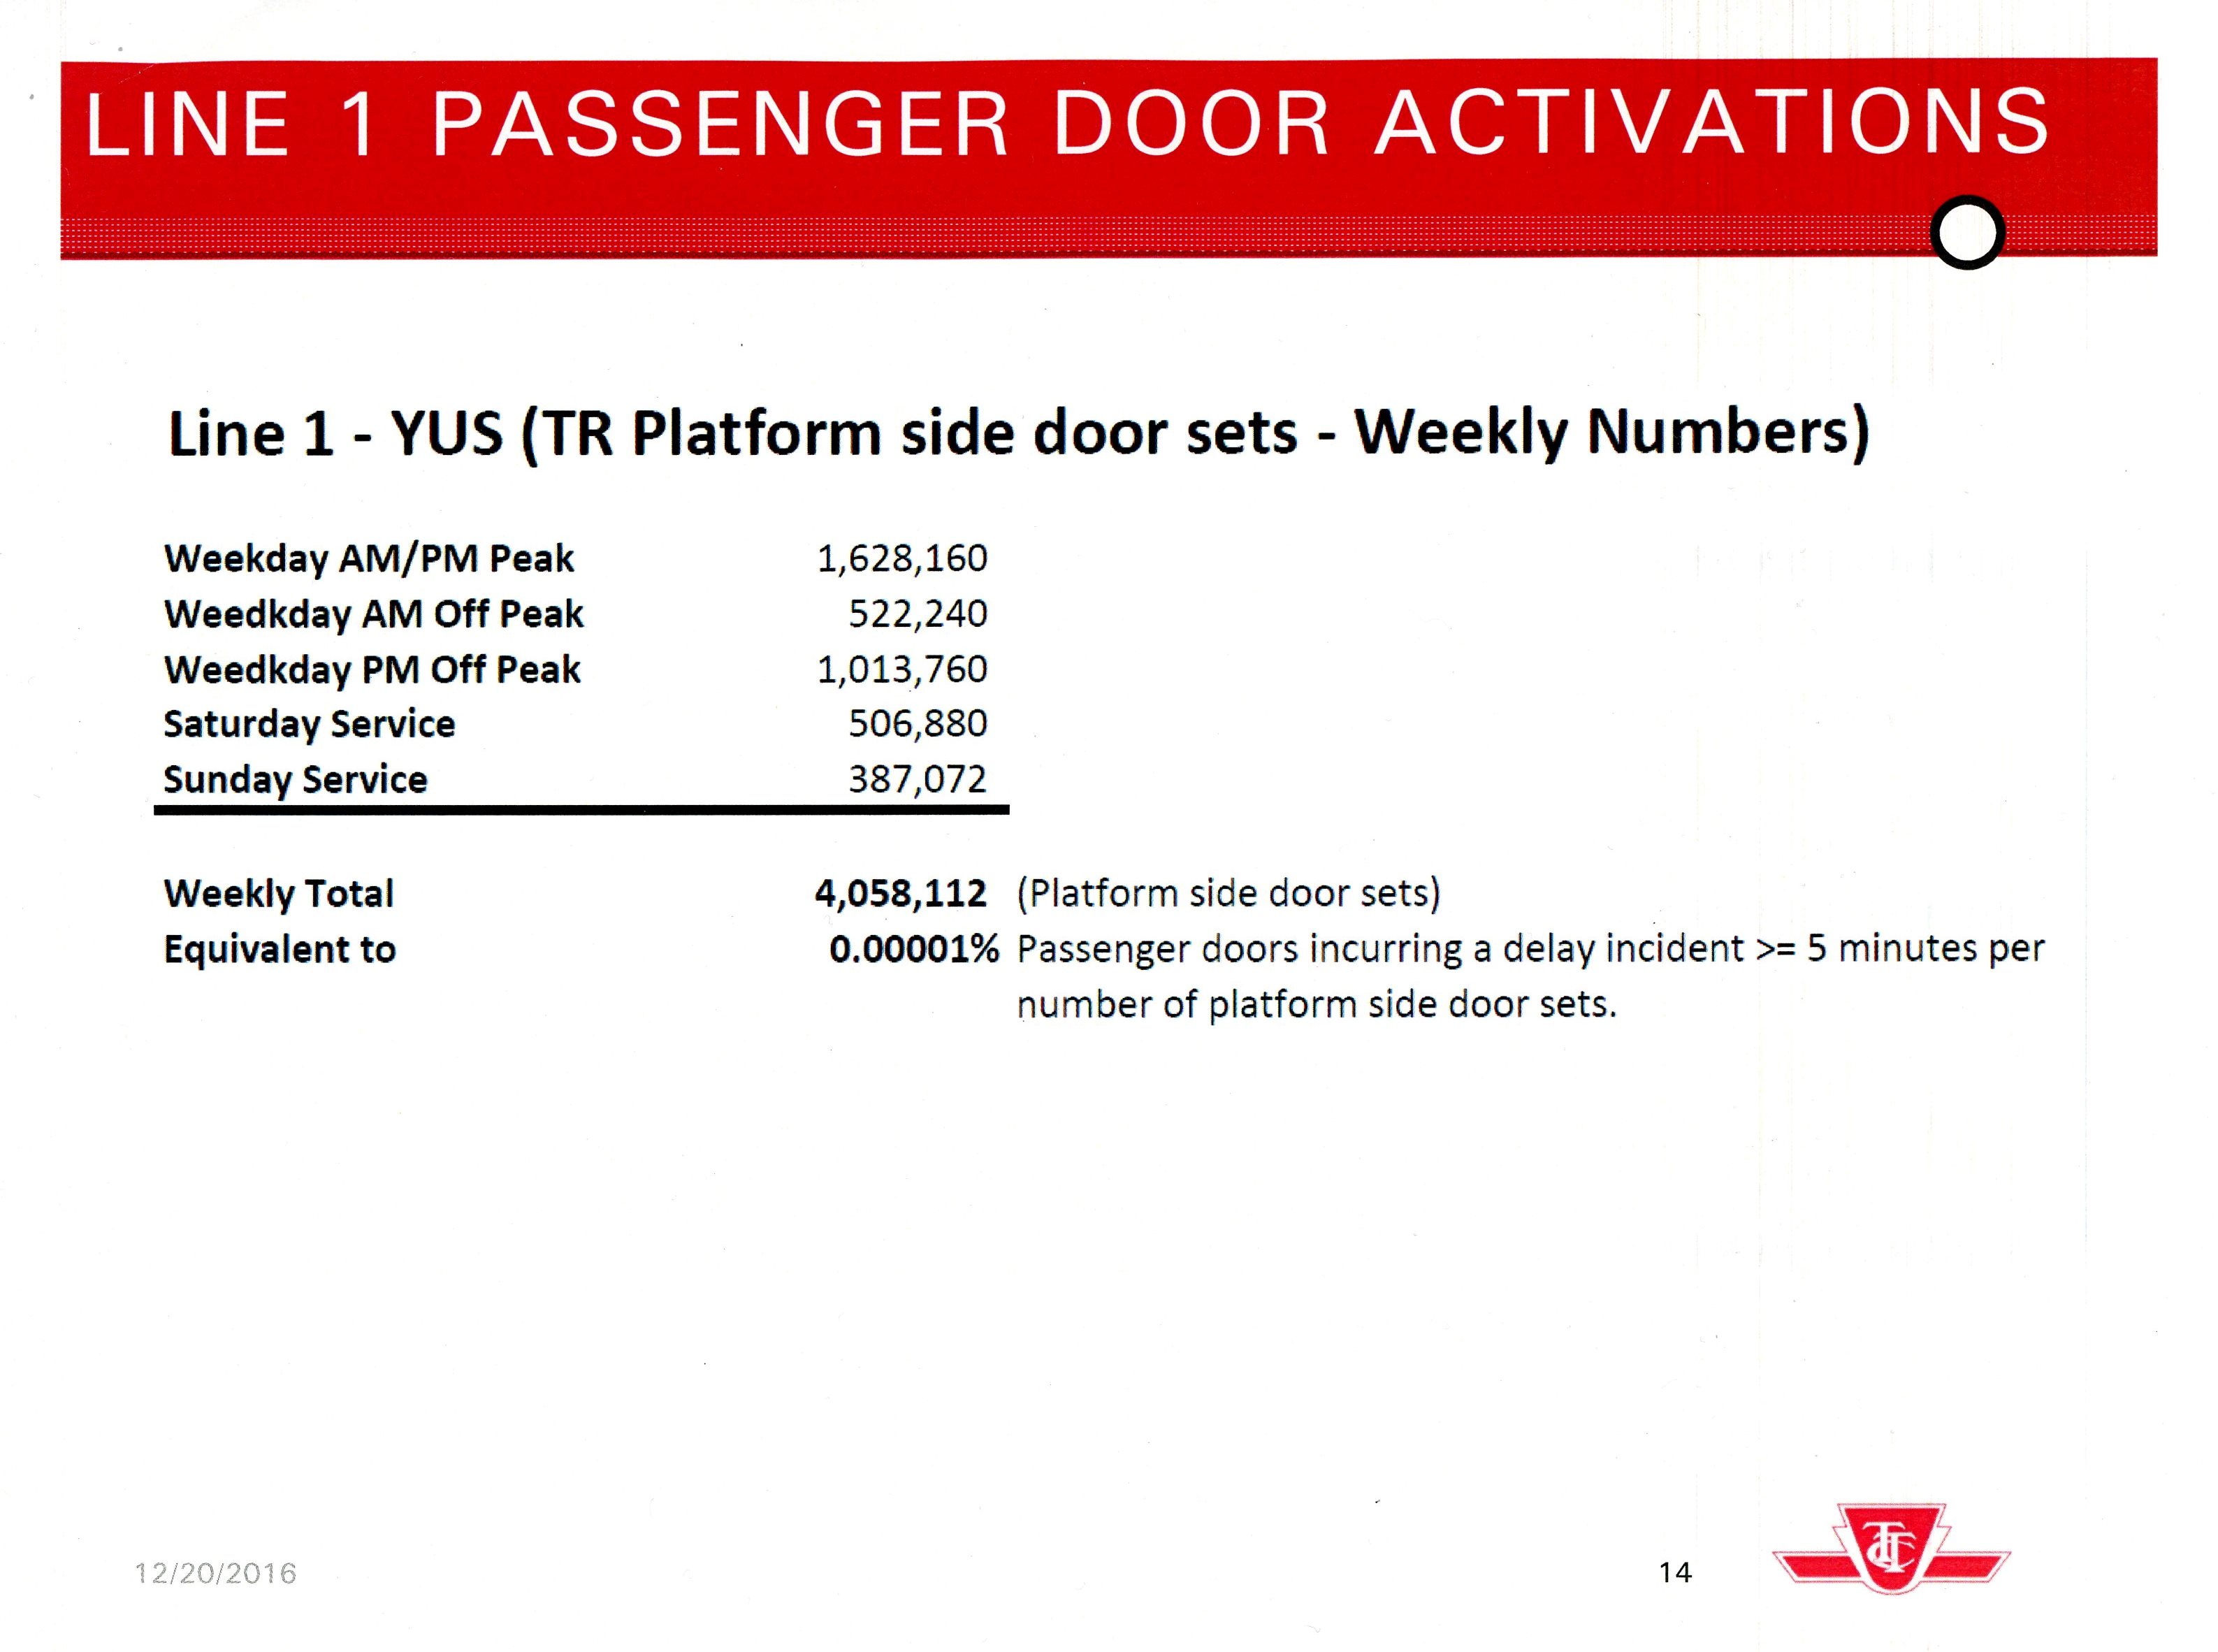
The table below illustrates a duty cycle – the opening and closing of passenger doors – that is a function of the number of stations served, not of train mileage. The failure rate expressed as a percentage of door cycles is very low, but there are a lot of cycles in one week. This is a comparatively simple subsystem, but it must work at an extremely high level of reliability.
For the T1 fleet, the defects reported per period are higher. As with the TRs, door problems are a source of many delays.
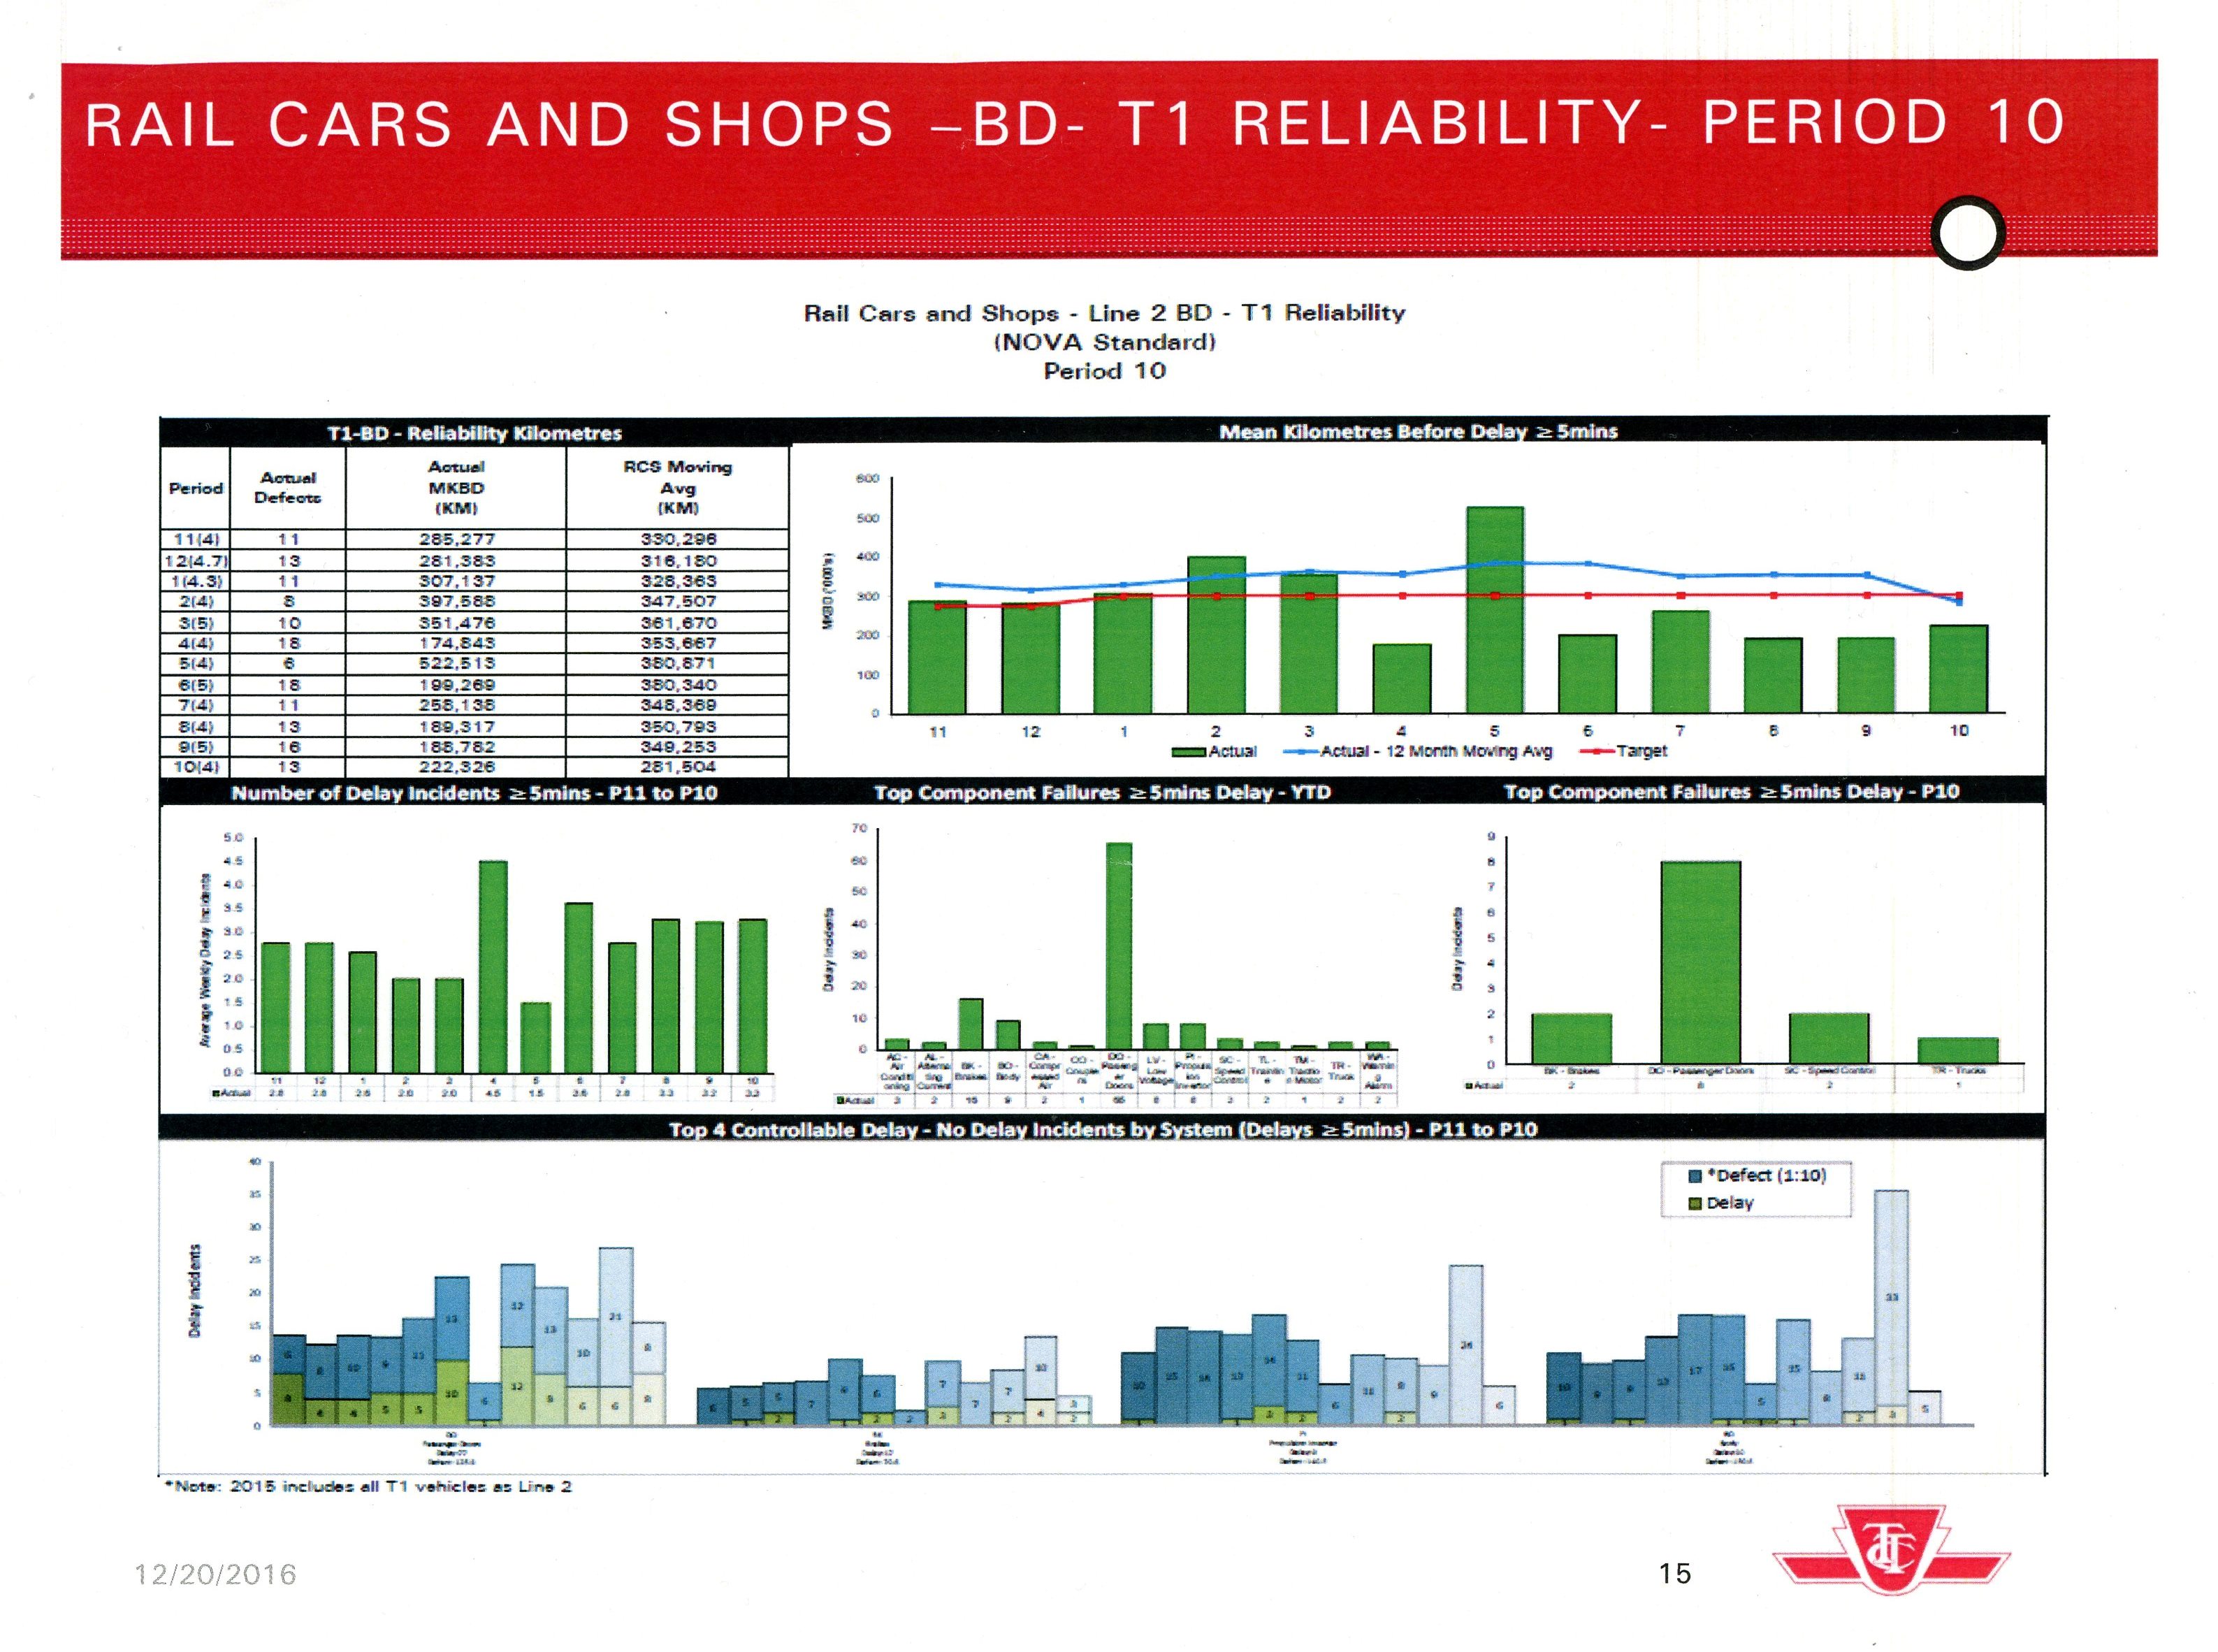
The T1 trains were the “pride of the fleet” when they were delivered, but recent experiences on the BD line have sullied their reputation.
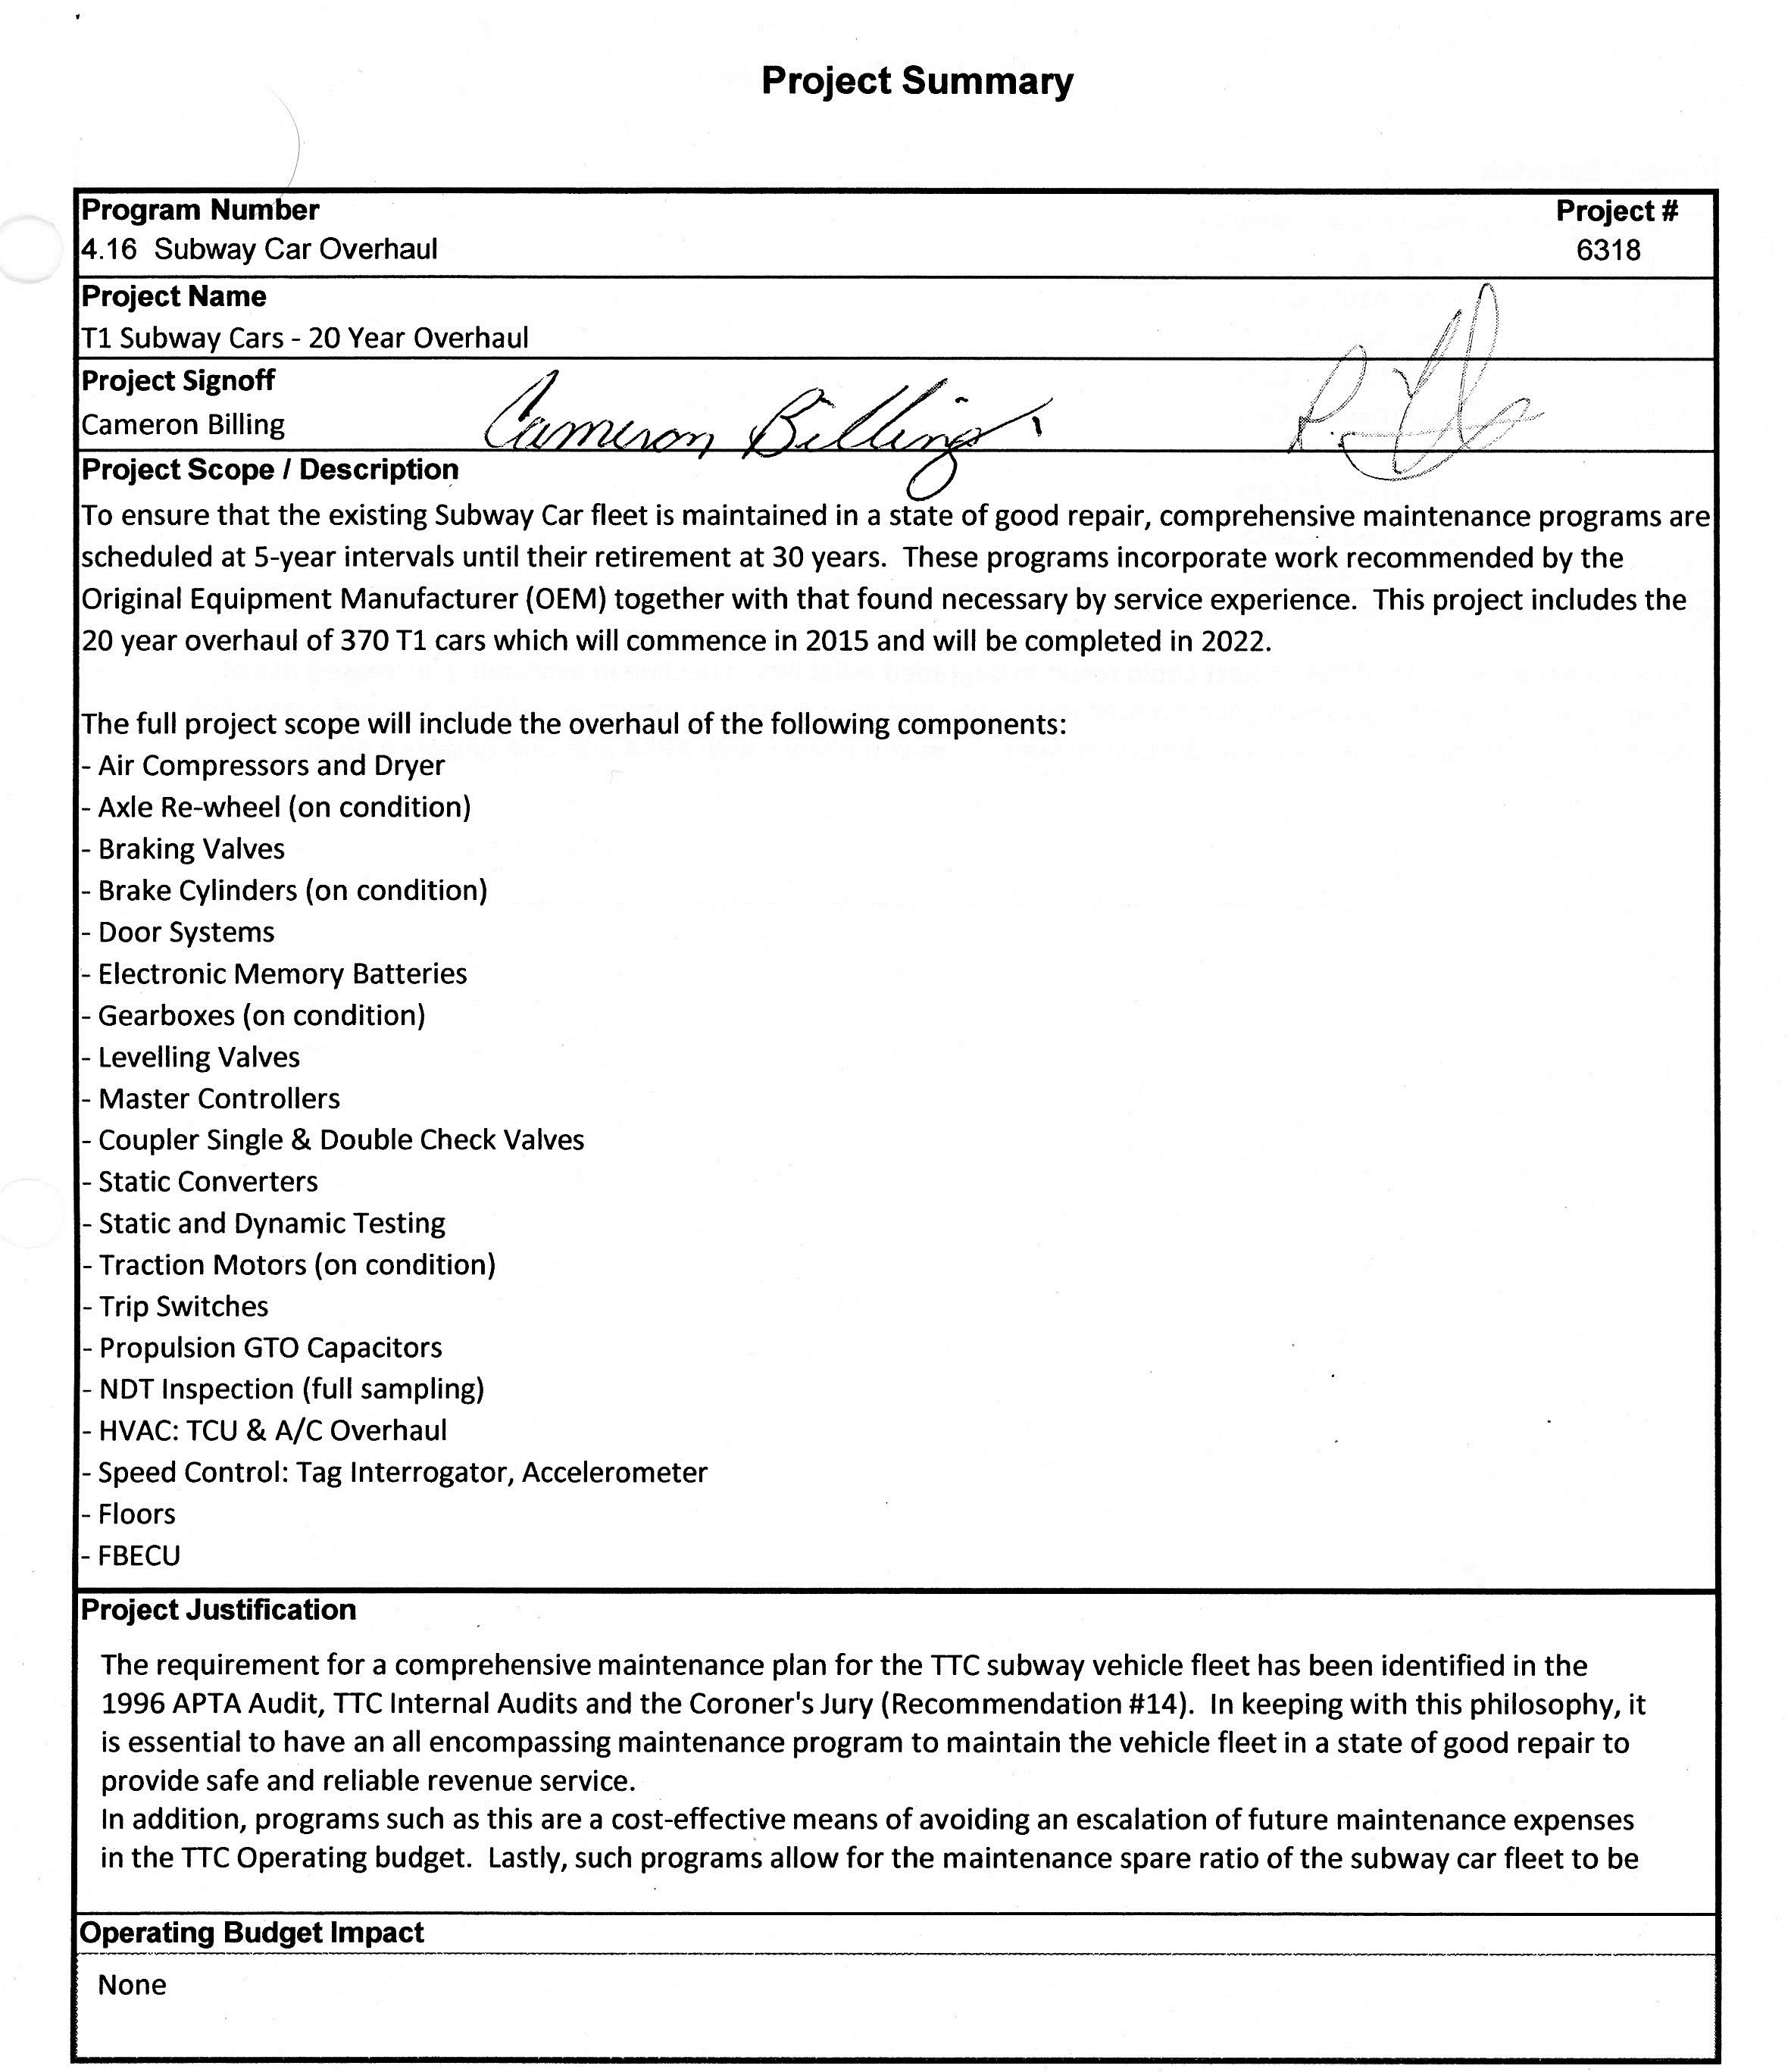
Problems with failing air conditioning units began to appear in summer 2015, but hit crisis levels during the heatwave of 2016. For a time, the TTC downplayed the extent of this problem, but eventually had to admit that they were caught short on a major failure in preventative maintenance. In the long-term fleet overhaul plans, the AC units were originally scheduled for the 20-year overhaul, a cycle that the oldest T1s have only now reached. Given the backlog of repairs, the TTC is not yet sure whether all of the old AC units will have been replaced in time for the 2017 summer season. The original schedule is shown in the project description from the 2016 Capital Budget “Blue Books” (pp. 725-726):
The cars physically look dirtier because they have brushed aluminum bodies as opposed to the T1’s stainless steel, but the problem was compounded a few years ago when the car washing equipment at Greenwood Shops was out of service for an extended period, and T1 trains were shuttled, infrequently, to Wilson to be cleaned. The result was that trains were routinely filthy with an accumulation of black (mainly brake shoe dust) from tunnels. This contributed to the sense that the BD line gets the second-class equipment, and that the TTC does not really care about its passengers. Indeed, the argument was conflated with the whole “Scarborough deserves better” chorus on which the subway scheme is based.
The problems continue for various reasons as described in an email from the TTC (April 19, 2016):
You’re correct that some of the T1 cars are not as clean as we like.
There are a number of factors in play here.
Trains are not washed regularly through the winter when the ground temperature drops below a certain point. Every winter, it follows that the trains become less clean. We do wash trains mechanically but it is less effective.
Each summer we employ summer students to hand wash the trains using detergent and pressure washers. They can do a train or so a day. they look pretty good, but with the condition of the body and it’s design – it takes time.
Chemicals used also make the aluminium more porous and so we have to be careful how much we use, or we potentially make the issue worse over time as the body will attract even more dirt.
The work is made more difficult due to the number of rivets used on the sides of the train. You can see more staining around the doors in general where the normal train wash (think of a car wash for trains) just doesn’t get into these nooks and crannies. On the TR we designed this dirt trap out by the smooth car body
The students have started work and you’ll see a gradual improvement in the fleet. That said, progress will be slower this year as we are using them to clean also airfilters on the train’s heating system which whilst invisible to customers needs doing across the fleet and is a higher priority.
We will be targeting the worst units first, and working through the fleet on a priority basis.
Whether trains are clean or not, the combined effect is to give the impression that the BD fleet doesn’t get the same attention as on YUS.
The T1 fleet’s replacement is unlikely to occur until early in the next decade as it reaches its 30th birthday, and because the Scarborough subway will require a conversion to Automatic Train Control (ATC) on the BD line. This would not be cost effective for a fleet close to retirement.
A full plan for upgrading the BD line including new signals, trains and a west-end yard is expected at the TTC Board in March 2017.
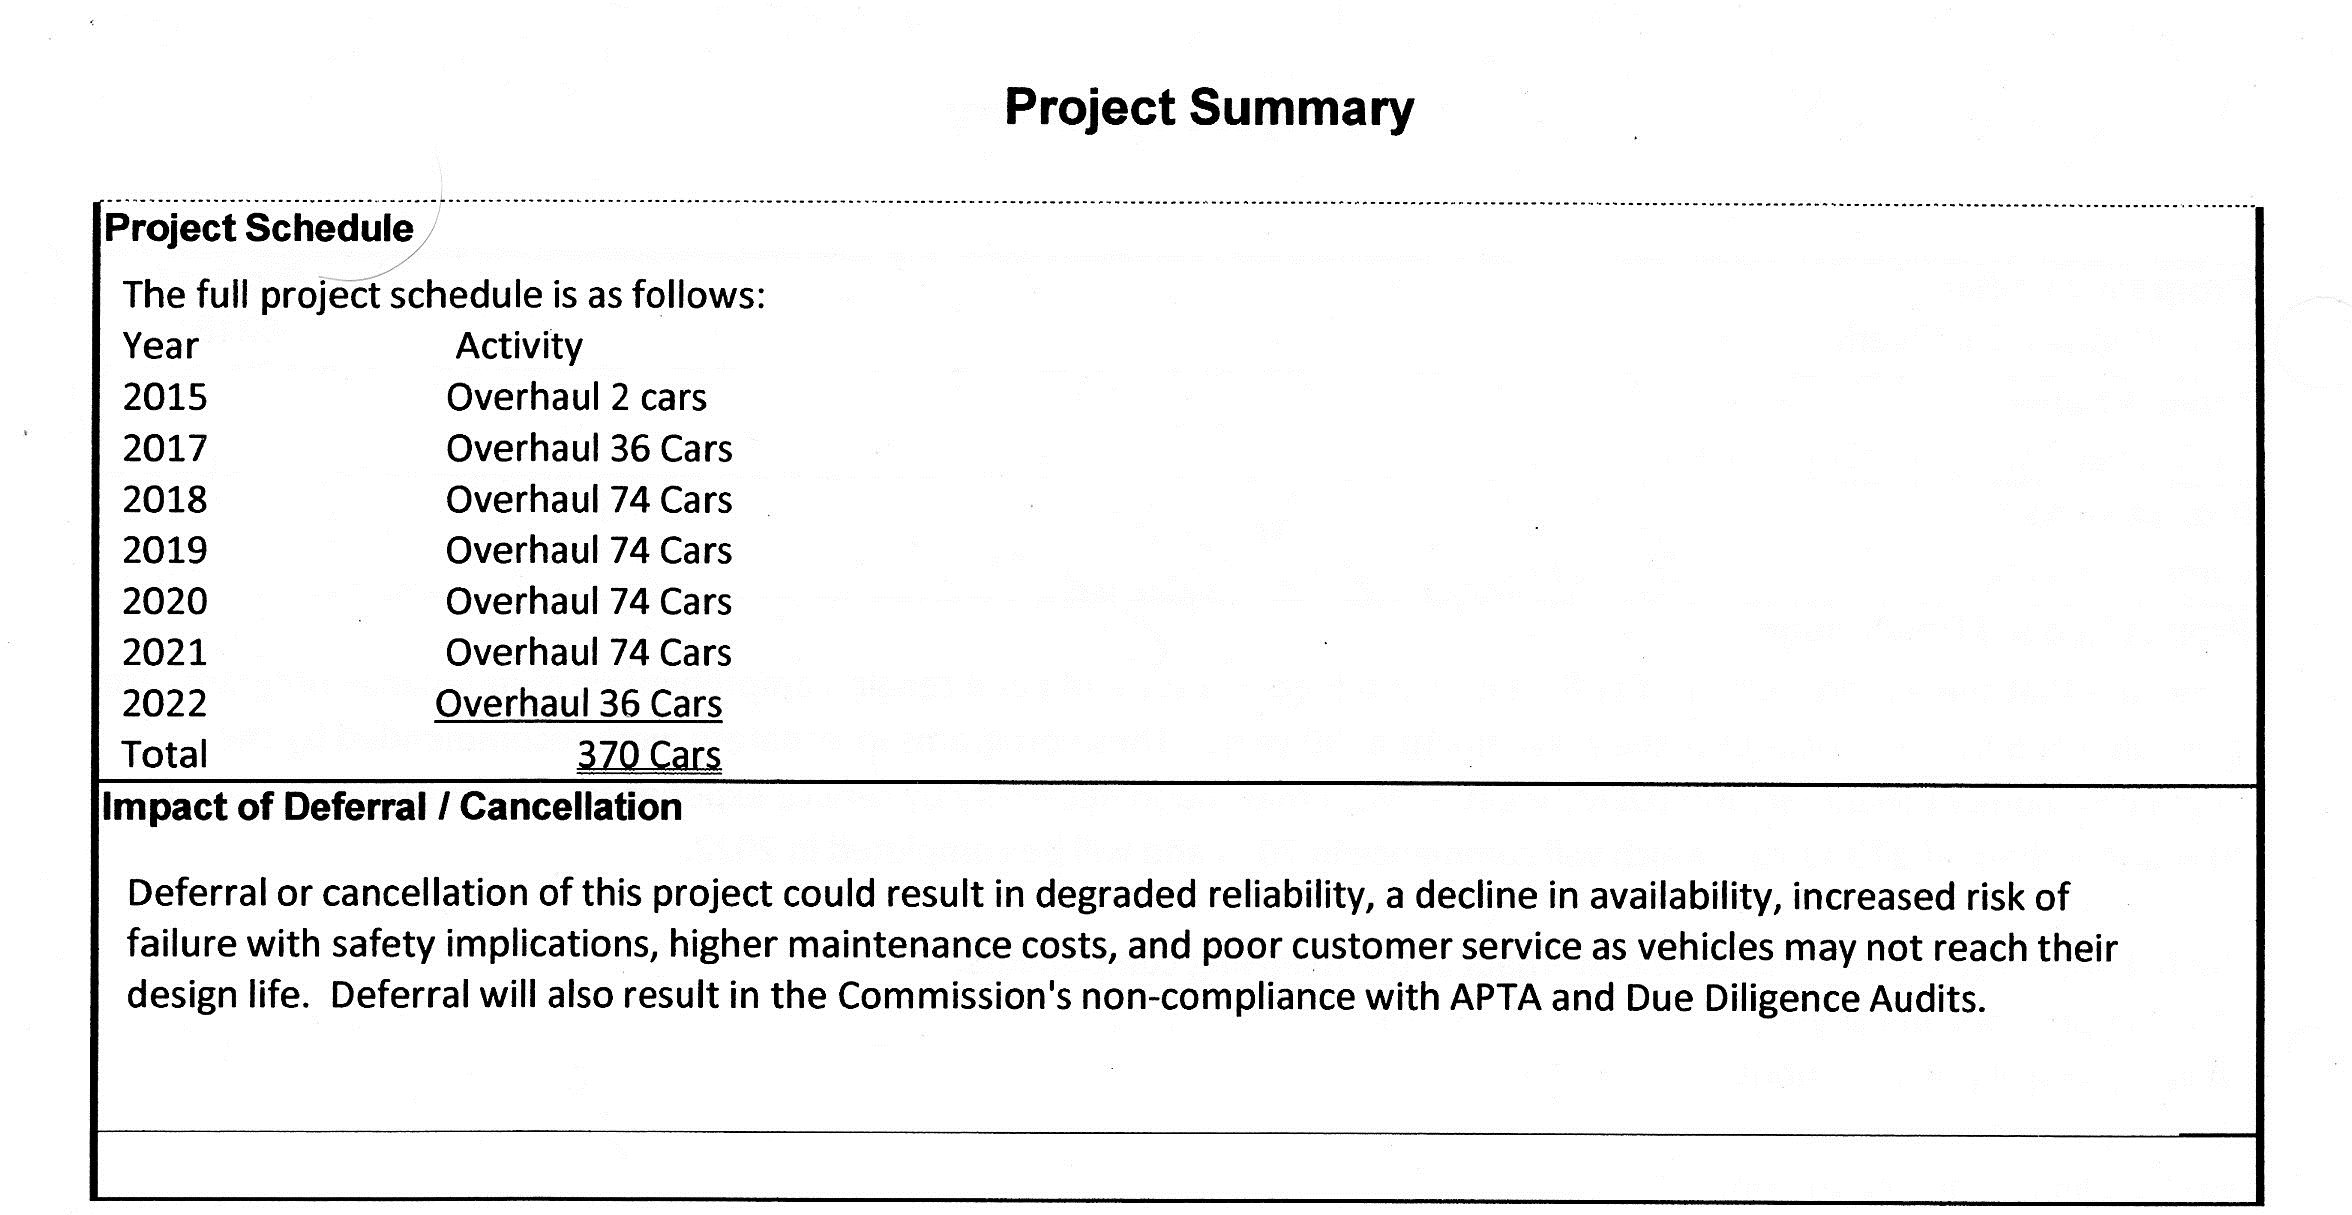
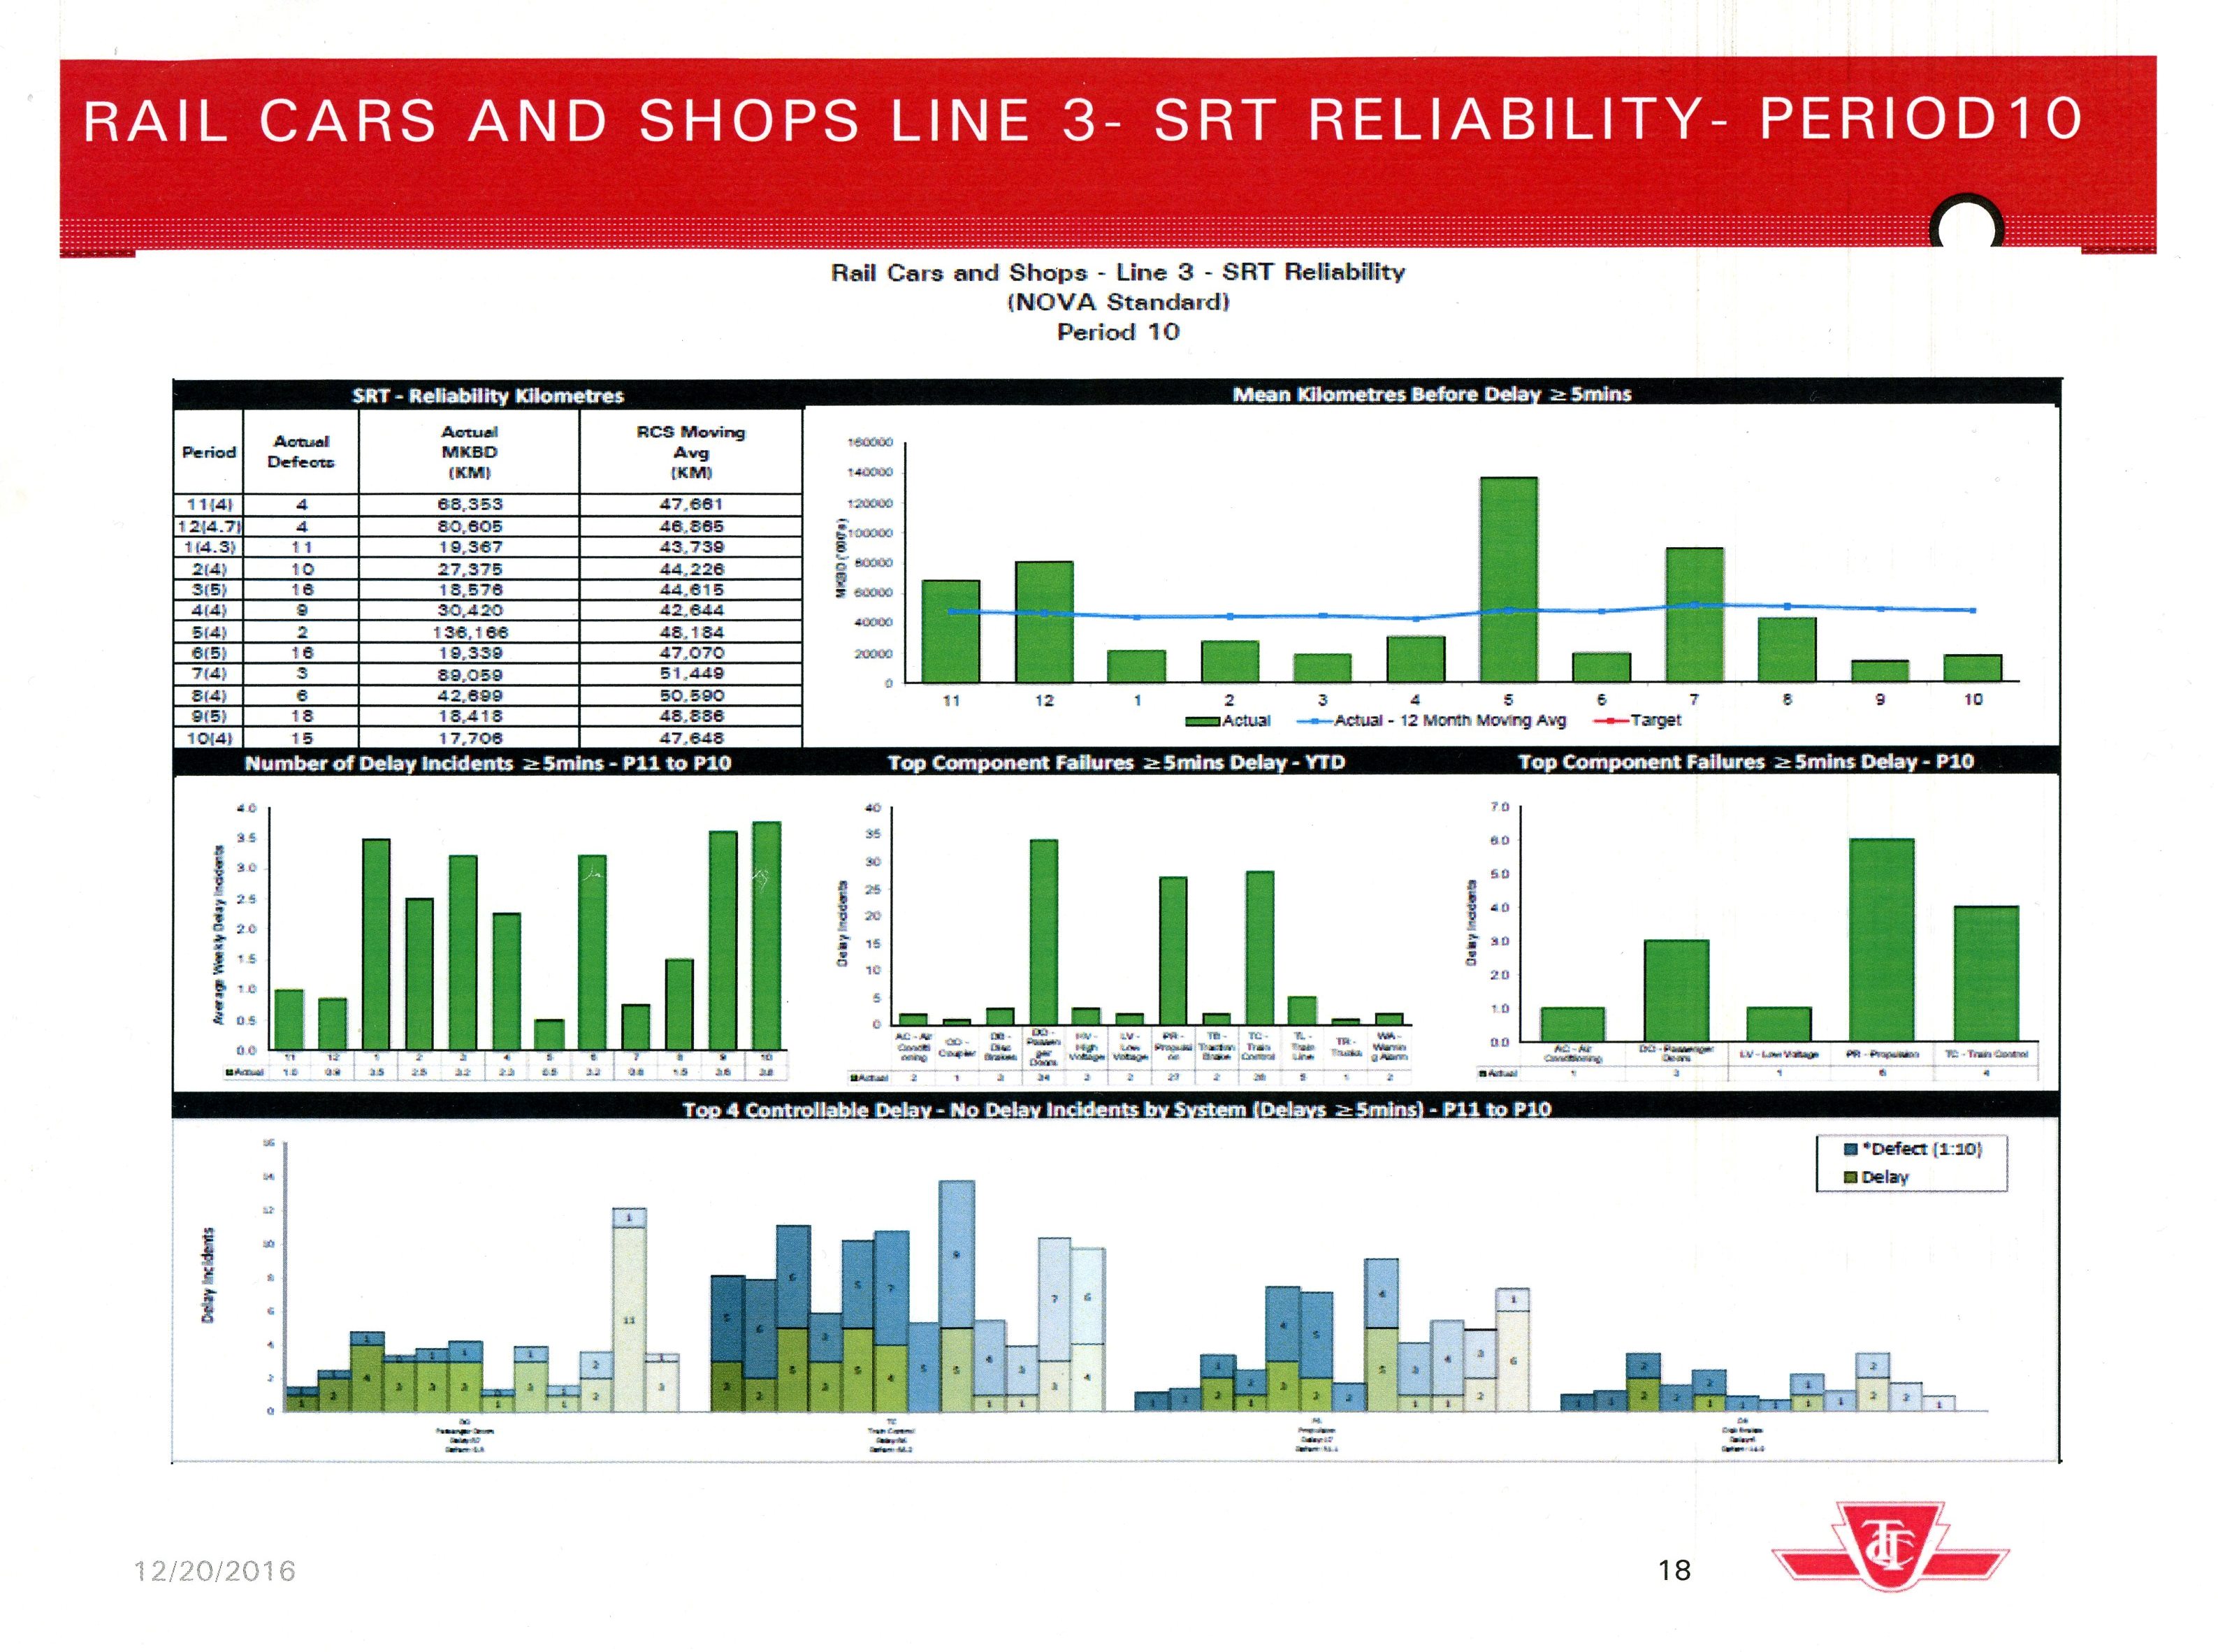
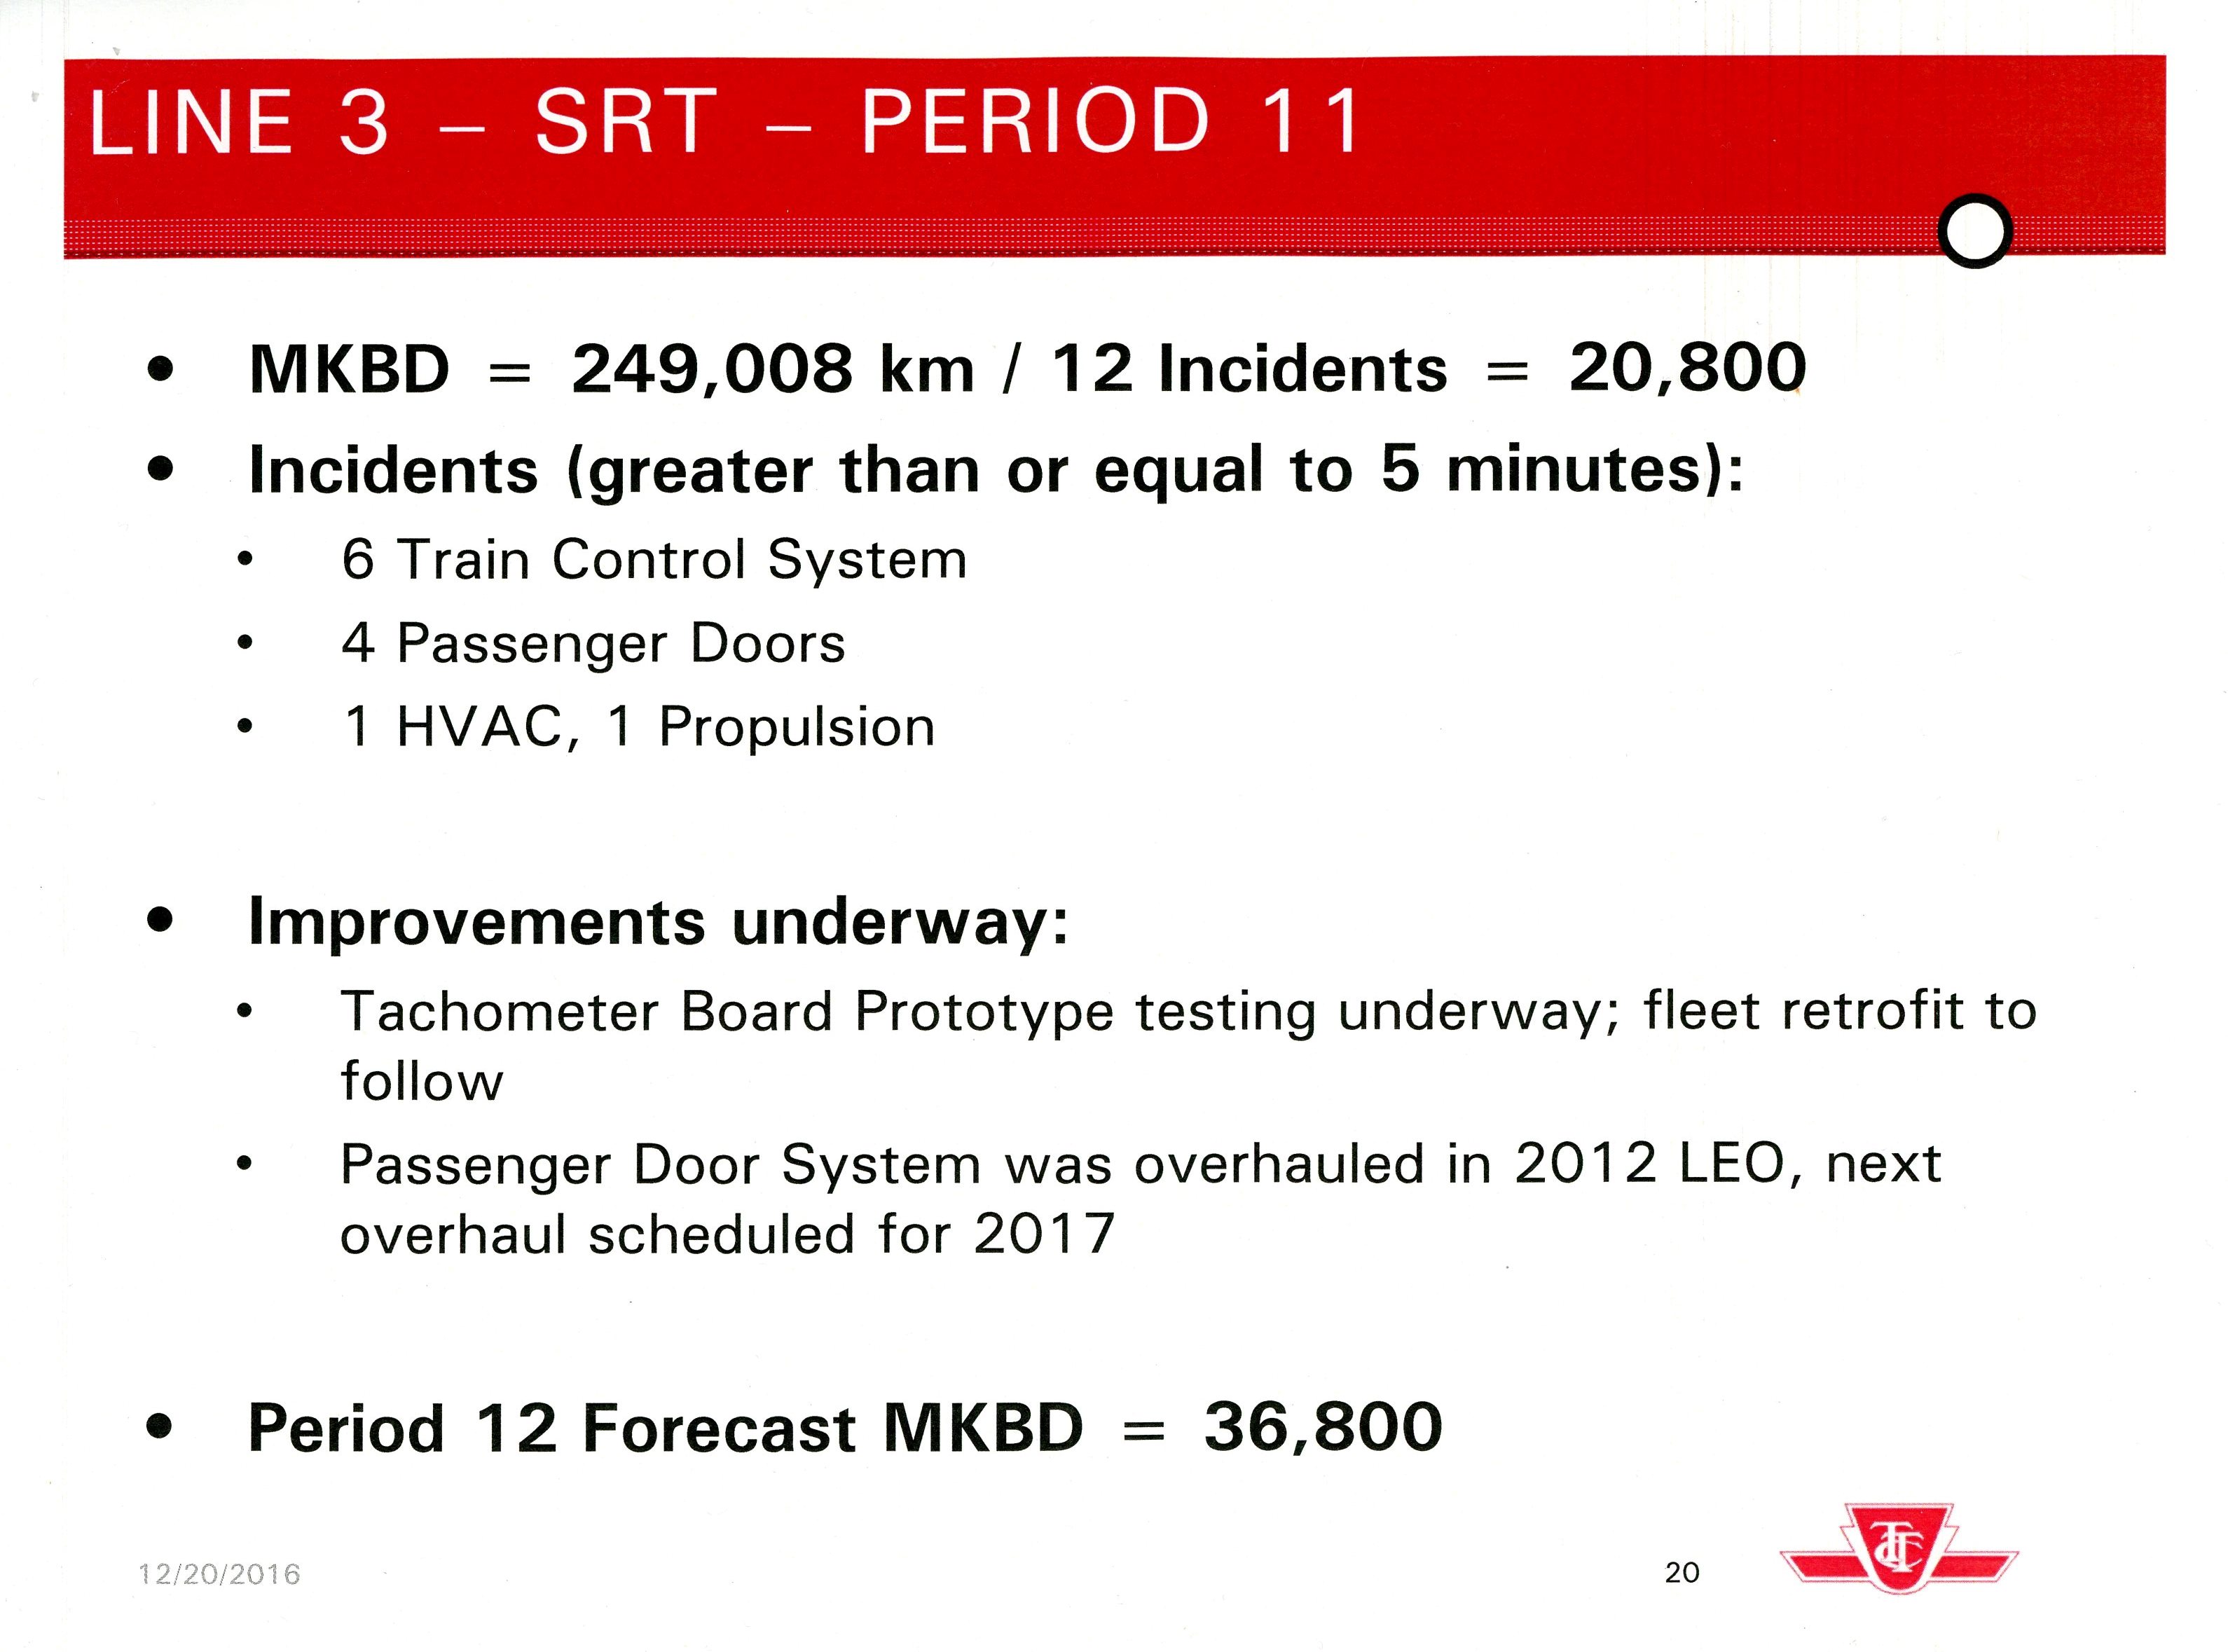
The SRT
SRT vehicle reliability is not included in the CEO’s Report. This fleet is currently going through a major overhaul to extend its life pending replacement by the Scarborough subway extension in 2026 when the cars will be over 40 years old. The availability of the fleet for service is constrained through 2017 by various factors:
- With only 7 trains in the fleet, service cannot be greater than 5 trains allowing for 1 spare and 1 in the overhaul program.
- During hot weather, there are speed restrictions due to overheating of the Linear Induction Motors (LIMs). As part of the overhaul, the TTC is reducing the gap between the face of the LIM (under the car) and the reaction rail to improve motor efficiency. This change will improve performance, but requires closer tolerances on the reaction rail structure and the “flying height” of the LIM relative to that rail.
In past years, the TTC has explored the option of buying used Mark I RT cars from Vancouver, but had been quoted an unacceptably high price. Whether this will change given the age of these cars remains to be seen, but it could be possible to “marry” Vancouver and Toronto cars into new four-car sets with Toronto’s cab-equipped cars on the ends of trains and Vancouver cars in the middle. This approach is the only way to improve SRT capacity in advance of the subway’s opening.
The SRT reliability numbers are much lower than those for the subway fleets, and the problems are not mainly due to door issues.
Historical Data
After a few decades of tracking TTC issues, I have archives, and they are worth poring through to see what information was reported in years past. Vehicle reliability numbers have appeared in public reports on and off over the years, although “off” is more the case in recent years. The TTC Board went through a period of wanting information in simple, bite-sized pieces, and without hard-to-understand details. Under Andy Byford, the CEO’s Report started out at a fairly superficial level, but more details are now appearing.
I asked the TTC for historical vehicle performance data to look back a few years beyond the 2015 numbers shown in the charts above. Their response was not encouraging.
SM: Defect rates for the various fleets only began to appear in the CEO’s report comparatively recently, although they must have existed for years before. Therefore I wish to obtain the subway, bus and streetcar stats for the past five years, separated by major fleet type: TR trains, T1 trains, H trains, SRT, CLRV, ALRV, Flexity, diesel bus, hybrid bus.
TTC: This will be a huge undertaking. Some benchmarking references have changed / tightened. The Fleet Plan and maintenance plan for the legacy streetcars, for example, have been lagging behind the need and ability to maintain equipment for the desired Reliability due to the delay in Bombardier’s deliveries, for example.
Given the rather straightforward definition of a “defect” as an event causing a service delay of five minutes or more, not to mention the long-standing tracking of fleet performance by the TTC, this is an odd response. One might expect that the main work involved would be to collate the physical or electronic data together with footnotes about discontinuities in calculation of the metrics.
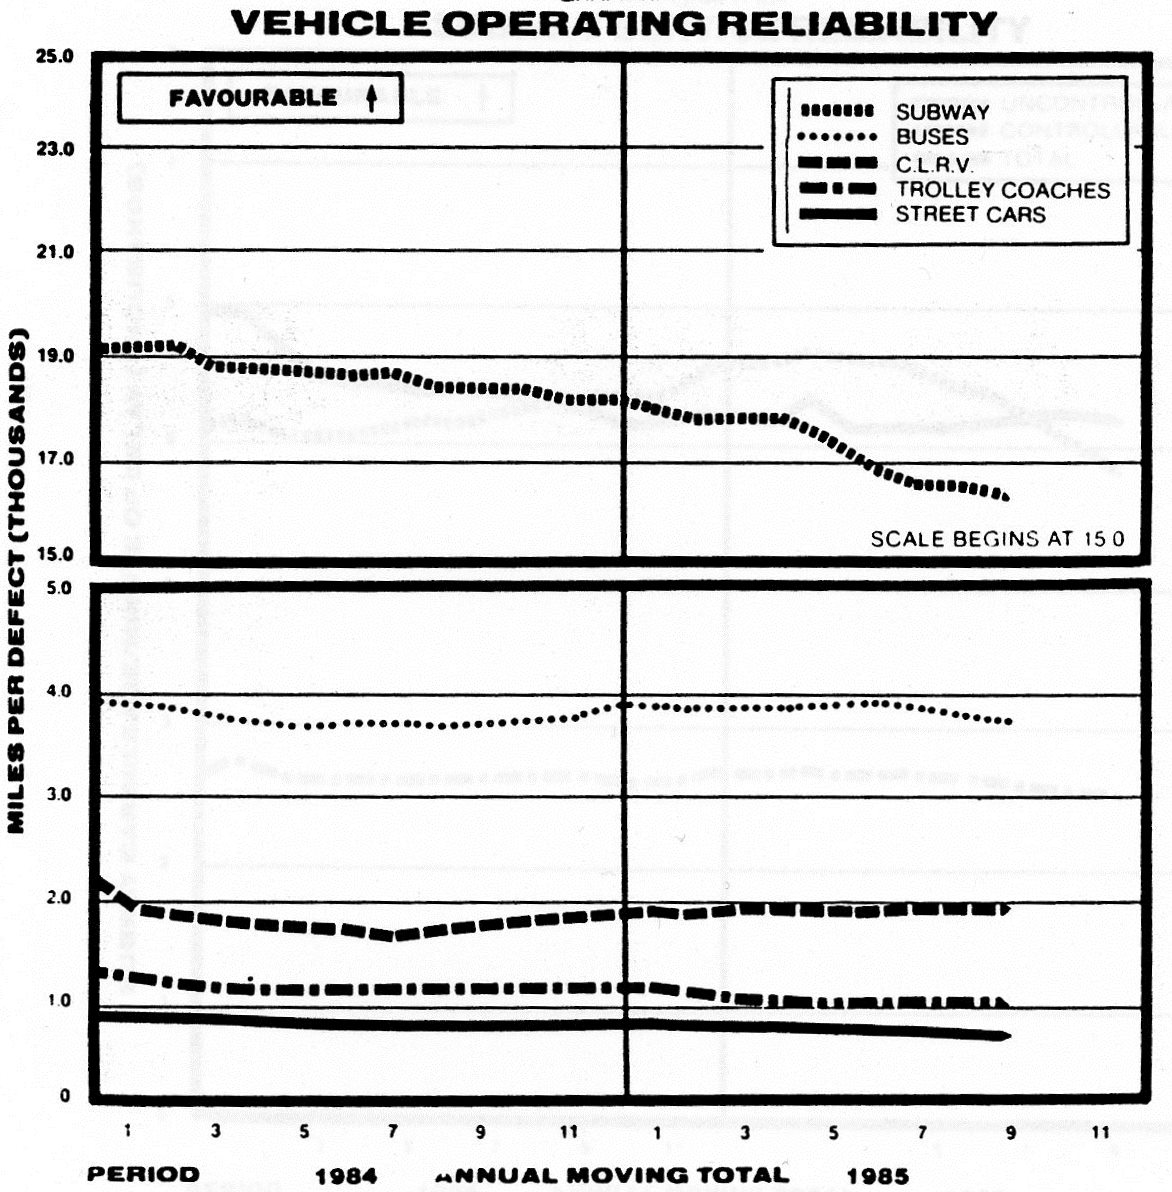
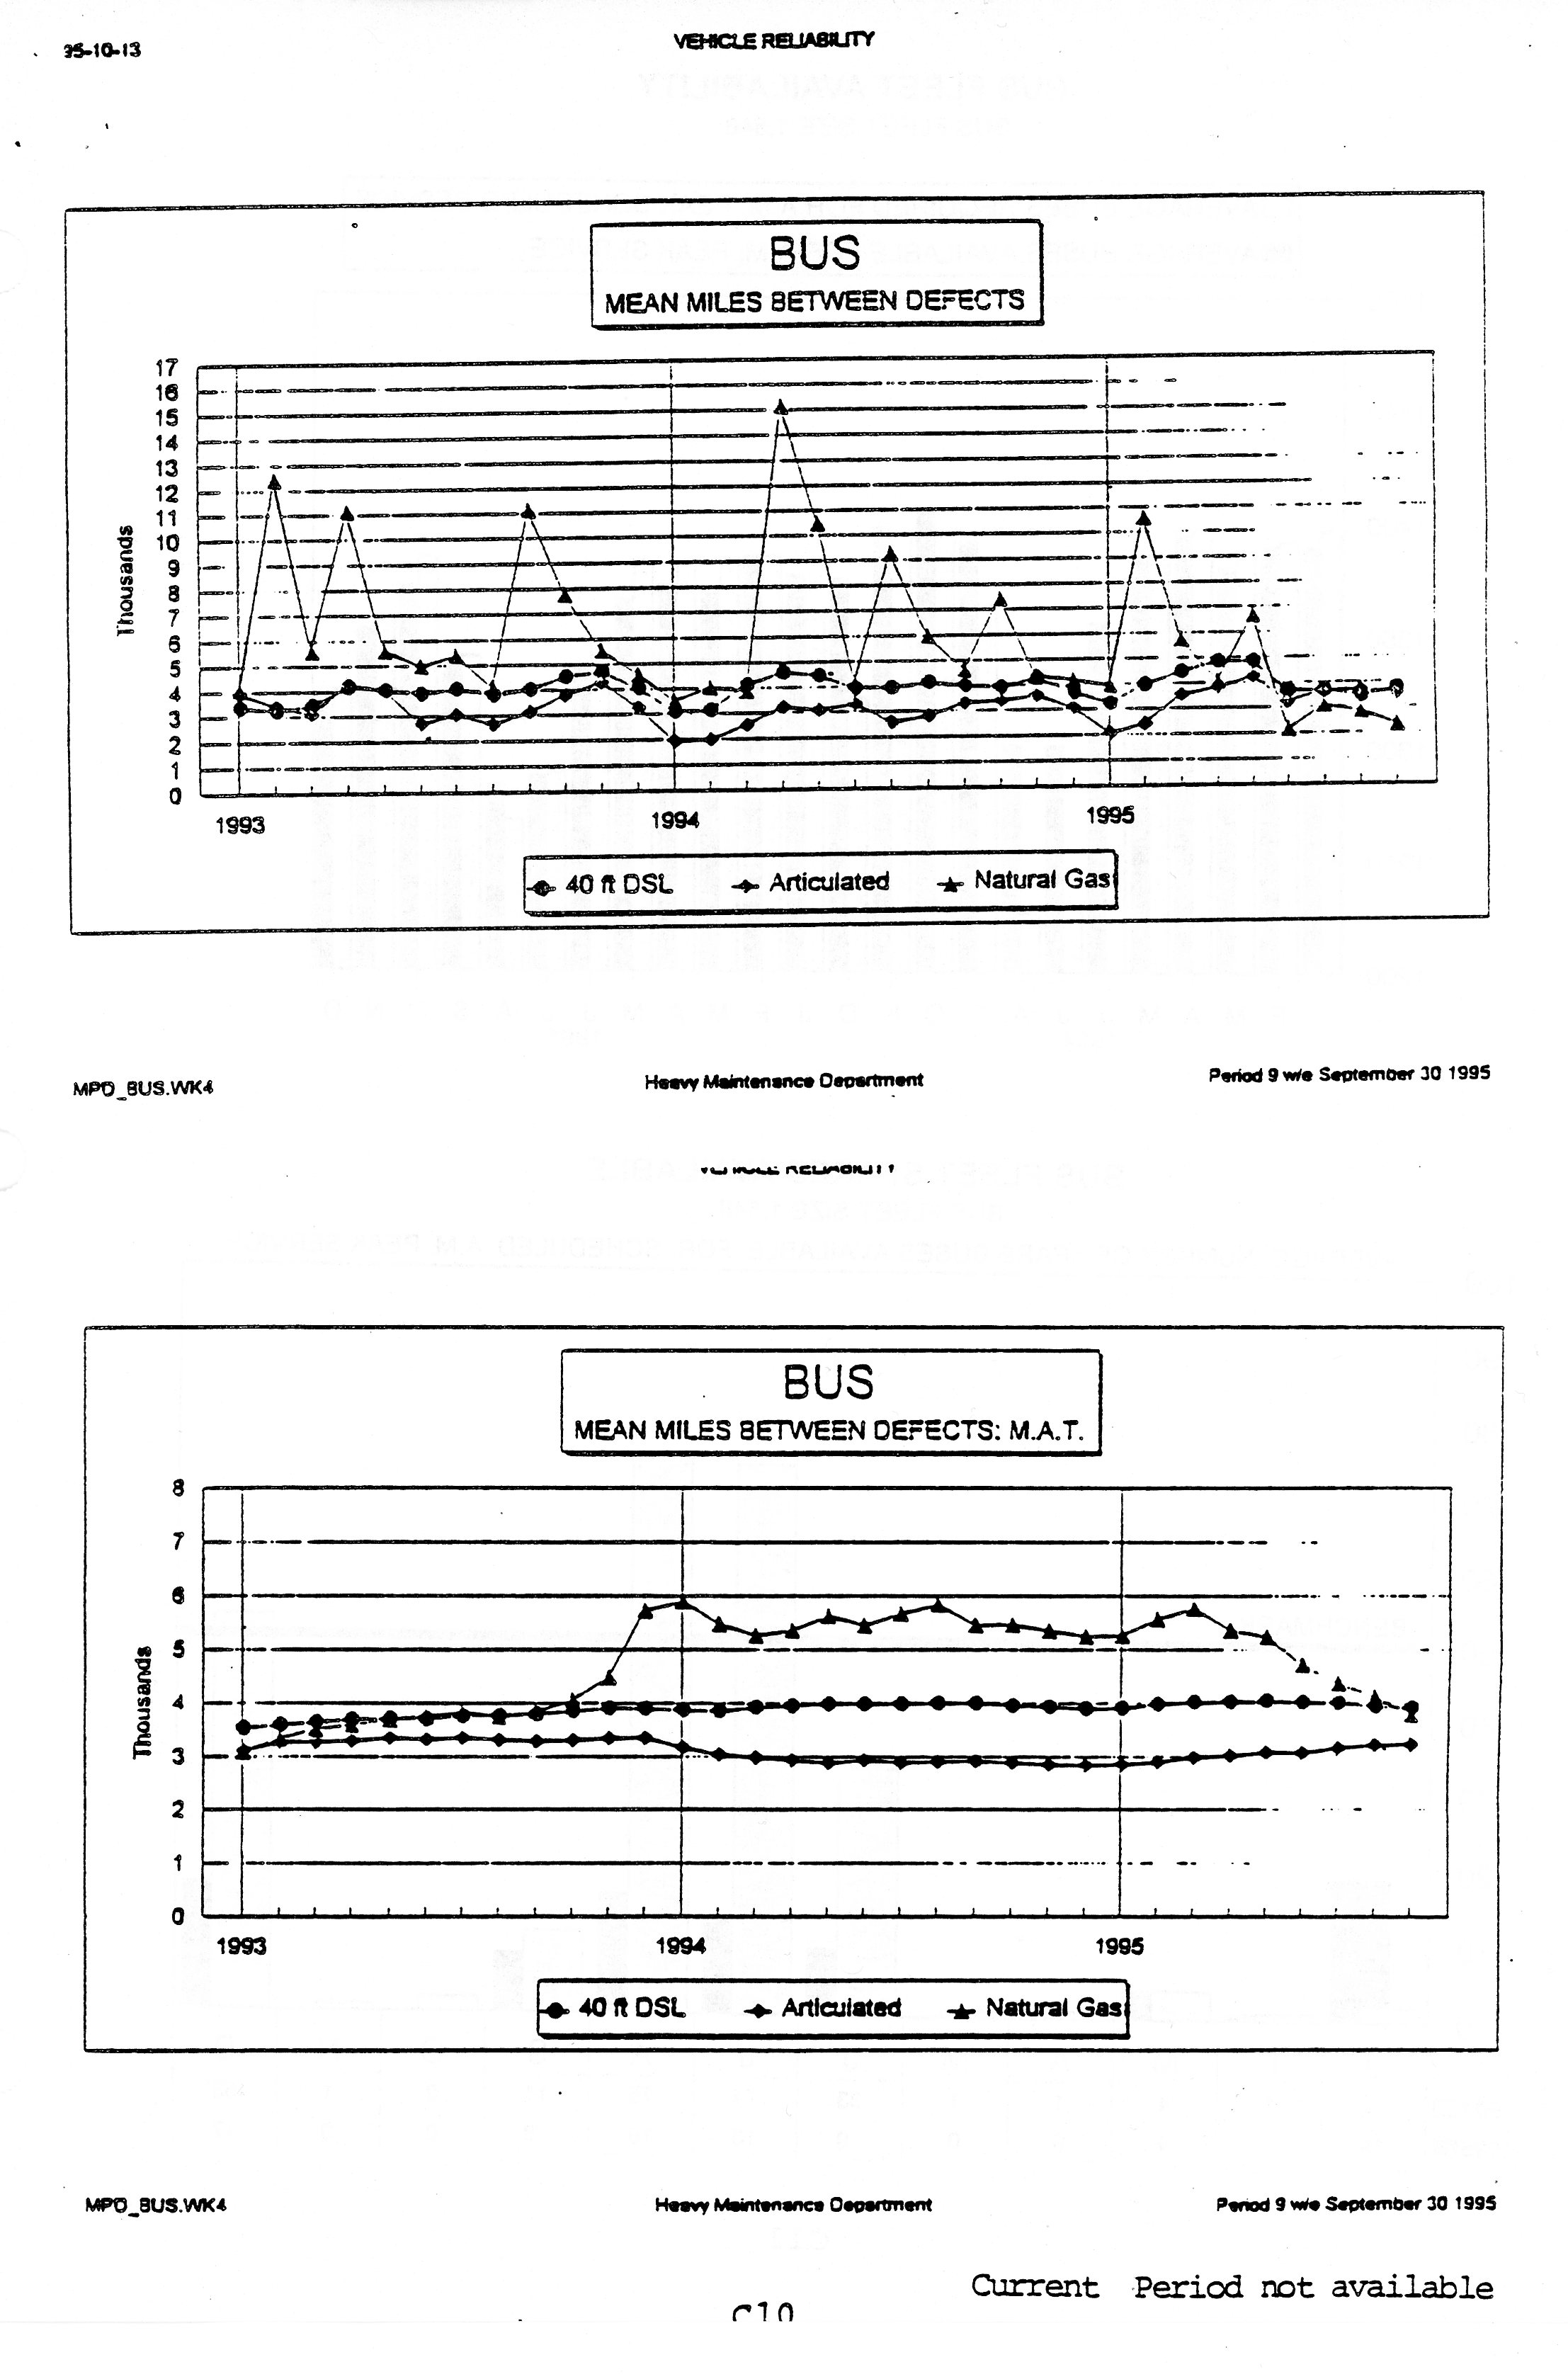
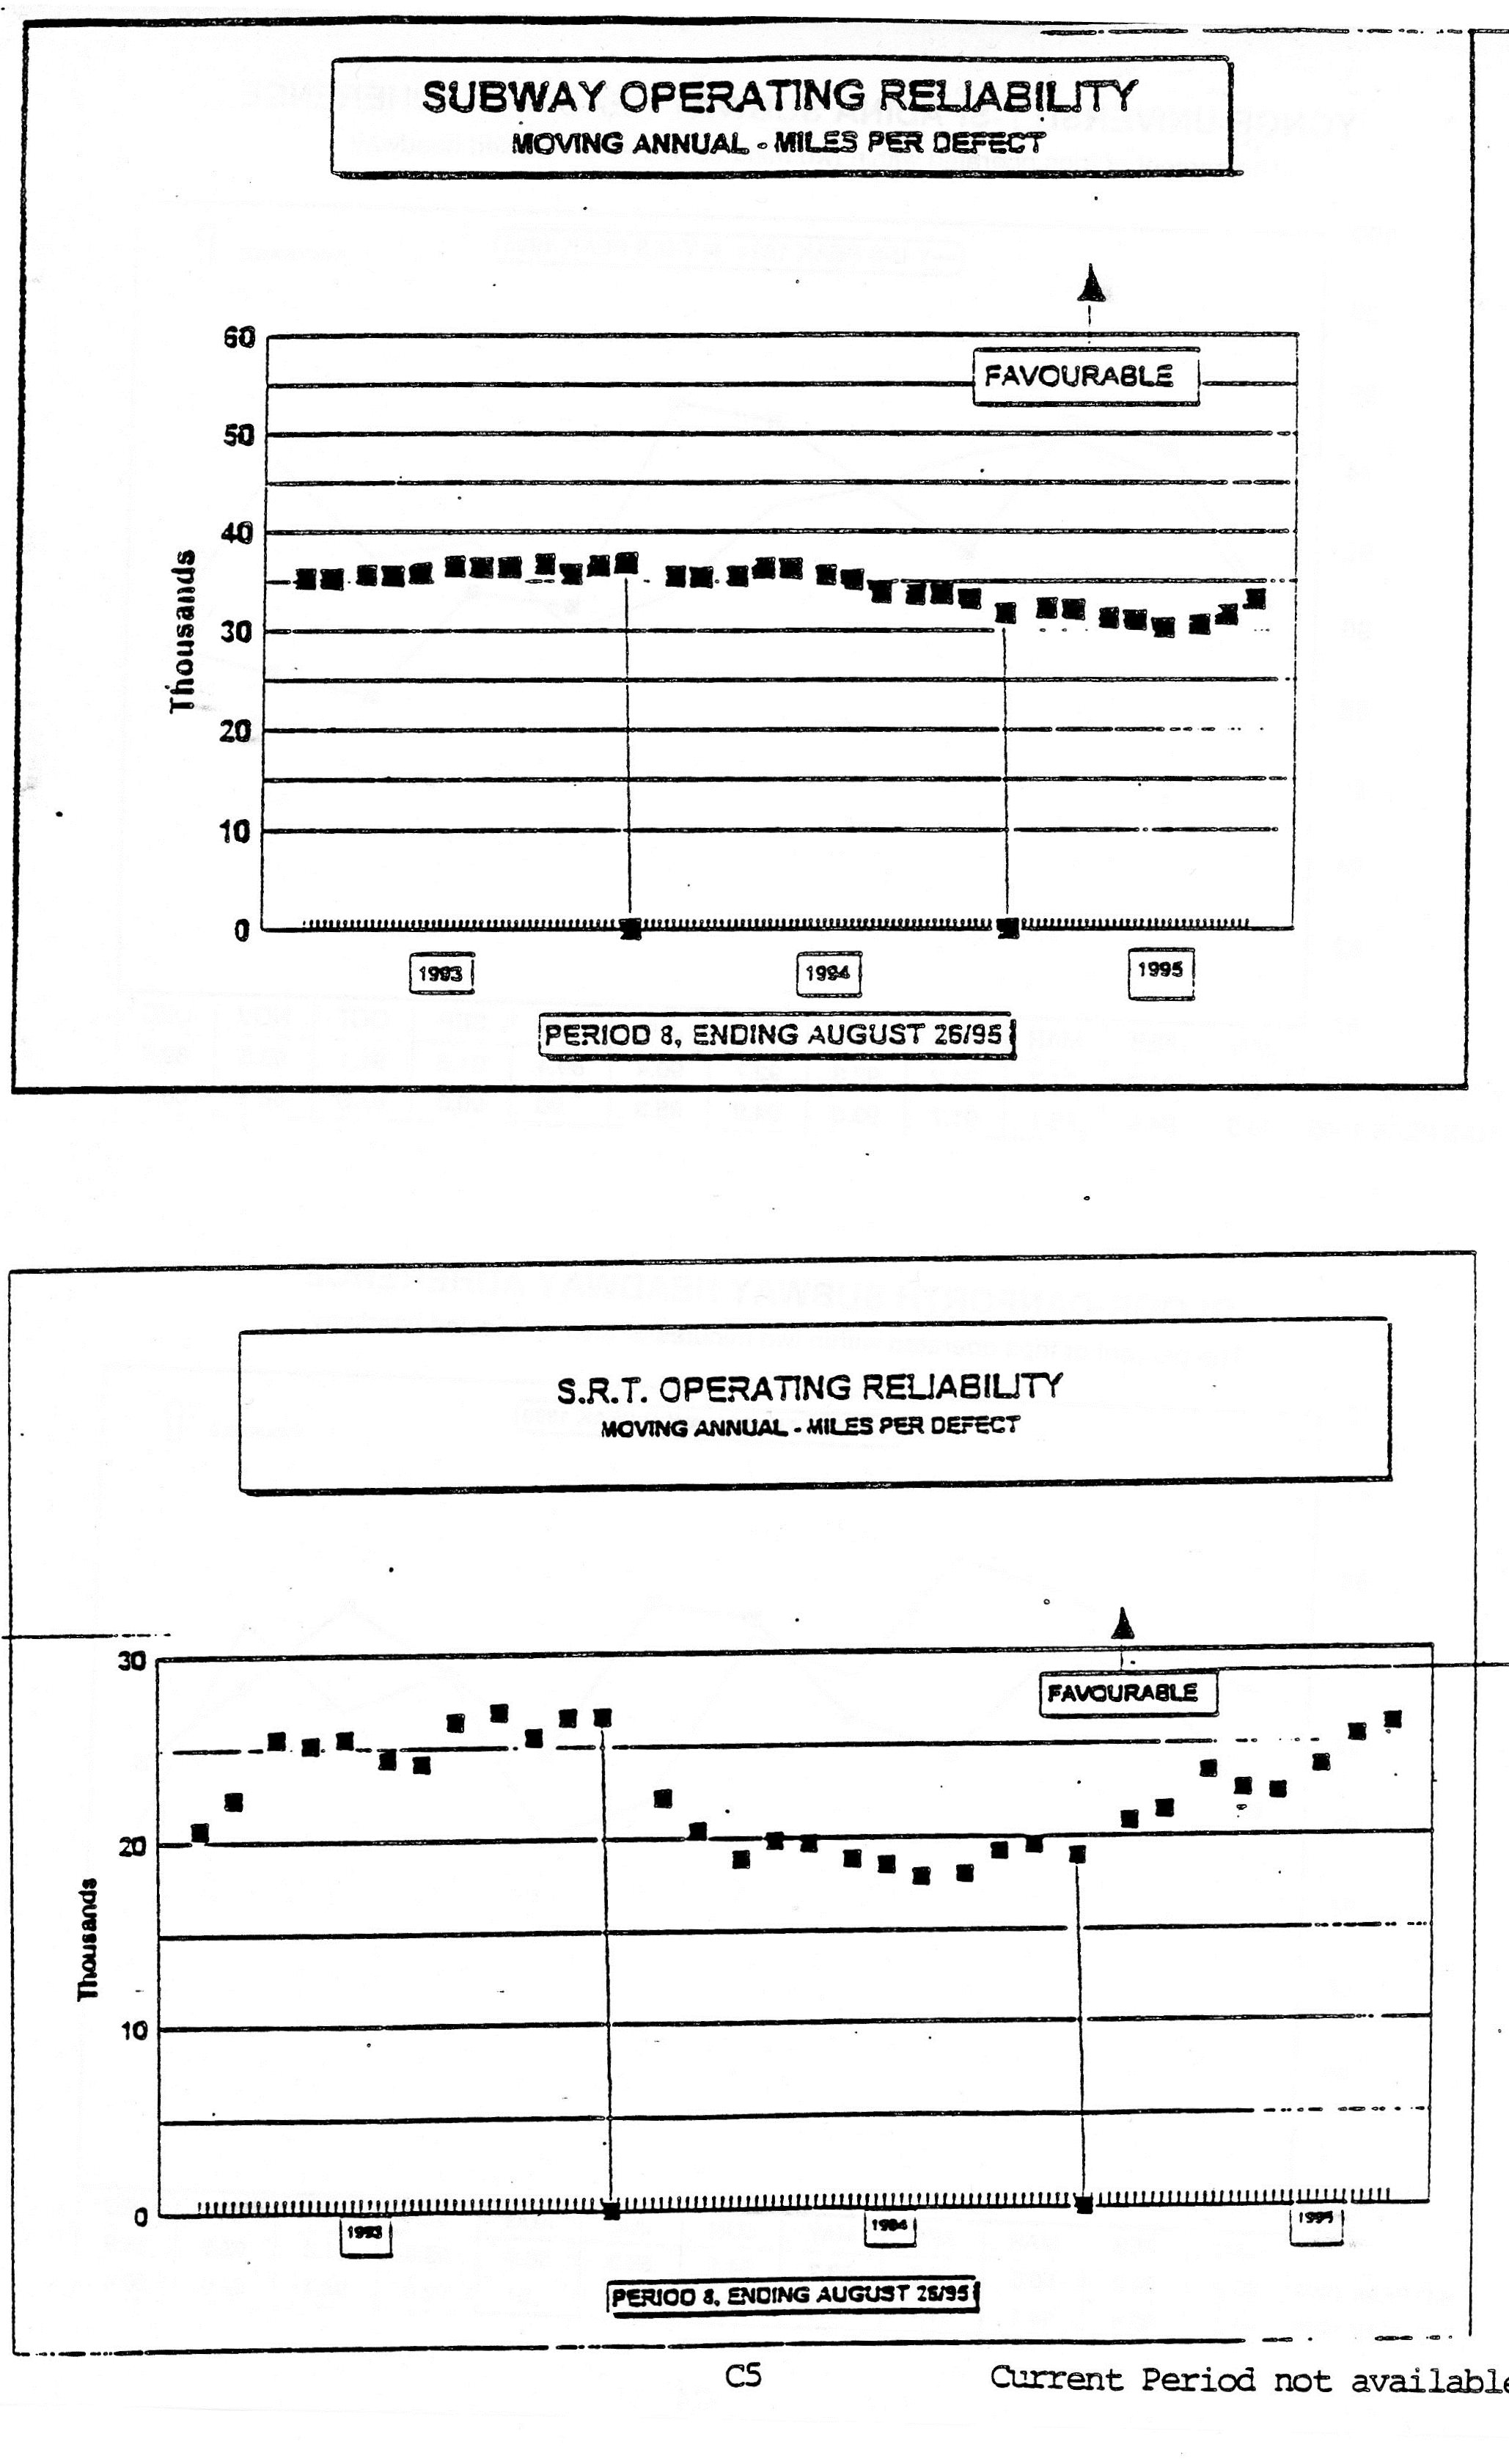
For what it’s worth, here is the type of chart that appeared in decades past. Note that the values are in miles, not kilometres, as that was the usage of the day. Also, the definition of a “defect” was not necessarily the same for the old stats, and so direct comparison to current numbers should be done with care.
Sources:
- Quarterly Performance Reports (1970s and 1980s)
- Chief General Manager’s Report (1995)
Back in the late 1970s, the PCC streetcar fleet was aging along with the trolley coaches. Subway car performance improvement at the time was reported to be due to the end of “high rate” operation on the BD line. The old “H” series subway cars could operate with faster acceleration and top speed, but their motors tended to fail more under these conditions due to a design defect. Slowing the line down required more trains, but reduced in service failures. (The Yonge line has never been operated in “high rate” although one could occasionally find a train running this way “unofficially”.)
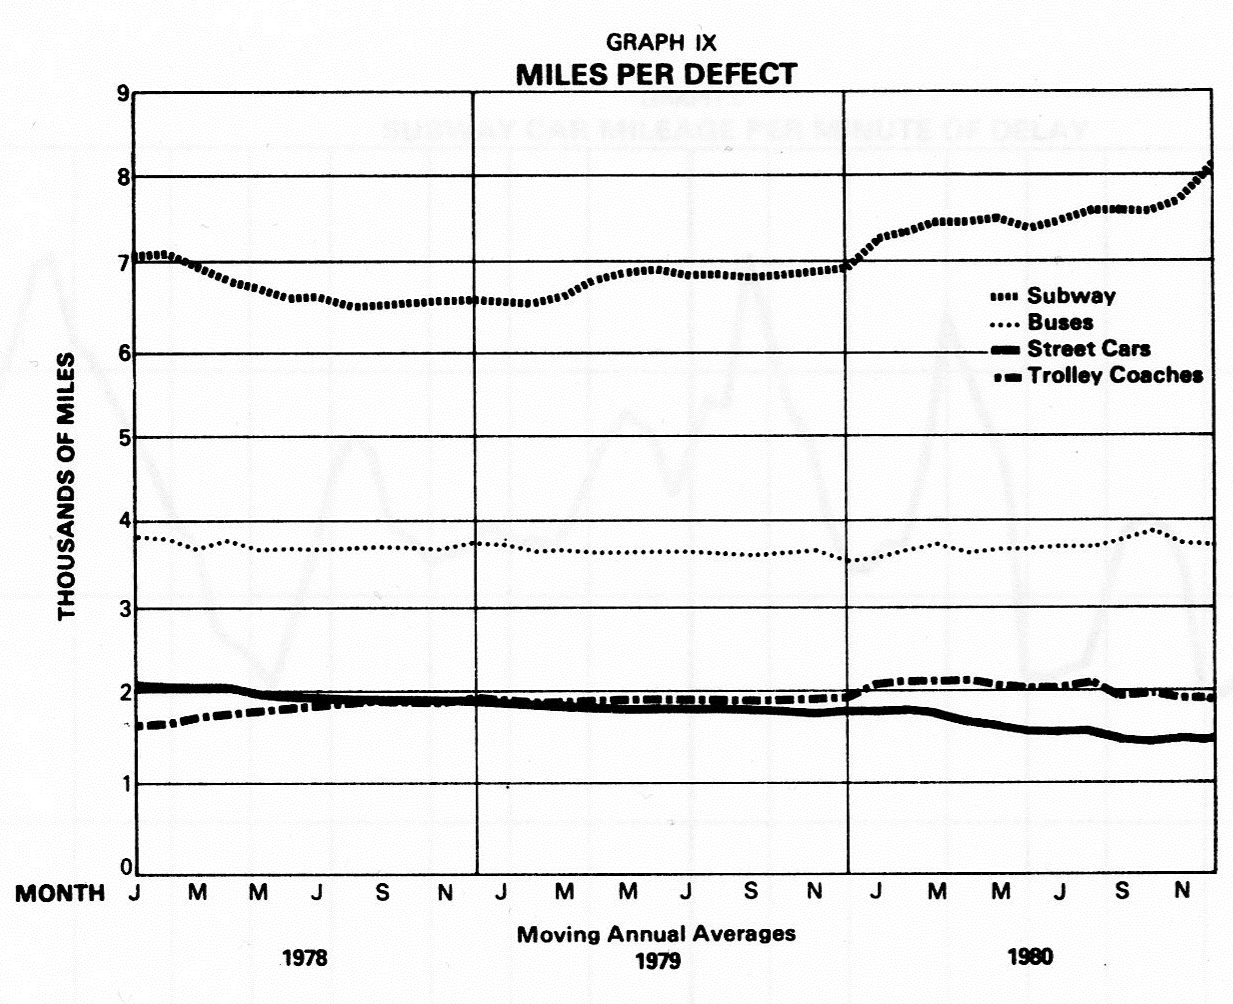
By the mid 1980s, the subway fleet reliability began to fall because the old “G” series trains had been in service for three decades and were nearing retirement.
By the mid 1990s, the TTC had regular diesel buses, the Ikarus artics, and natural gas buses foisted on Toronto as a replacement for the trolley coaches. The Ikarus buses were lemons with poor structural integrity, and they were retired long before their projected livespan was over. The CNG buses started out with good numbers, but they did not age well.
In the mid 1990s, the CLRV stats had improved beyond the level a decade earlier after the repair of many design flaws in those vehicles.

Subway car reliability in the mid 1990s was up considerably from the mid 1980s with the retirement of the last G trains in 1990. 1995 also saw the delivery of the first of the T1 cars that would replace the original Bloor-Danforth fleet of H1 trains from the mid-1960s.

Wasn’t a new Ridership Growth Strategy supposed to be coming forward in the January 2017 reports?
Steve: It is on hold until after the city sets its 2017 budget and the TTC knows how much money, if any, they will have to work with. Same for the pending express bus report.
LikeLike