
A few months ago, I wrote about my search for all of the new money and transit service our beneficent leader, John Tory, had showered on Toronto’s transit riders. The answer, of course, is that the amount delivered is far from what was promised, and that’s before the pending cutbacks of the 2017 budget.
Recently, I was looking at the TTC’s 2016 Customer Charter in preparation for an article about the Five Year Plan (coming soon), and I noticed that a few promises and claims don’t line up with what is actually happening. During a period when TTC ridership growth is minimal and planned service improvements have been deferred, there is a surprising Third Quarter achievement:
We will add service during peak periods to 25 busy bus routes, to reduce crowding and improve travel time.
This prompted some head scratching considering that recent service changes have all been about trimming service, not making major additions, and certainly not to 25 busy routes. After a few emails to and fro with the TTC, there was finally an admission that, oops, those new buses really don’t exist. Or, well, they did, briefly, but they don’t any more.
In January & February 2016, the TTC increased peak bus service on 28 routes using 23 buses thereby achieving the 2016 charter commitment early.
However, since then, an equivalent number of peak service reductions have been made to mitigate the impact of the TTC’s deteriorating and decreasing legacy streetcar fleet and to sustain service in the downtown. In November 2016, the TTC reduced service on 8 routes freeing up 9 buses to reallocate to the 511 Bathurst. And, in January 2017, the TTC reduced service on 13 routes freeing up 20 buses to reallocate to 501 Queen and other streetcar routes.
When we “put the tick” in the box saying we had achieved the improvements we didn’t know how bad things would get with respect to vehicle availability. We’ll reflect the fact that we had to unwind peak service on some of the same service improvements when we publish our year end charter review. [Email from Deputy CEO Chris Upfold, Jan. 18, 2017]
There’s a bit of creative rewriting of history there, plausible though the explanation might be. First off, it was clear that when the 2016 charter was framed, the TTC knew that it had crowding problems, and planned to address them. Provision for this was in the fall 2016 service plan, but that was killed off when ridership failed to grow as expected through 2016. The improvements cited by Upfold, however, went into operation much earlier.
January & February 2016 – Peak period service increases (+23 AM peak buses)
- 191 Highway 27 Rocket – peaks and midday
- 63 Ossington
- 75 Sherbourne – both peaks
- 6 Bay – AM peak
- 21 Brimley – AM peak on 21A (Kennedy Stn-Scarborough Centre Stn)
- 20 Cliffside – AM peak
- 25 Don Mills – PM peak
- 143 Downtown/Beach Express – AM peak
- 144 Downtown/Don Valley Express – PM peak
- 125 Drewry – AM peak
- 111 East Mall – both peaks
- 195 Jane Rocket – AM Peak
- 83 Jones – PM peak
- 12 Kingston Rd – PM peak
- 44 Kipling South – both peaks
- 102 Markham Rd – AM peak
- 46 Martin Grove – both peaks
- 16 McCowan – both peaks
- 57 Midland – PM peak
- 65 Parliament – AM peak and midday
- 66 Prince Edward – both peaks
- 134 Progress – PM peak
- 123 Shorncliffe – both peaks
- 55 Warren Park – both peaks
- 94 Wellesley – AM peak
- 112 West Mall – AM peak
- 89 Weston – PM peak
- 11 Bayview – AM and PM peak
Service reductions came on a different list of routes, with some overlaps to the one above. The net effect was a reallocation of service rather than an overall improvement, although it could be argued that routes losing service had capacity to spare under the Service Standards.
November 2016 – Peak period service reductions to mitigate streetcar fleet constraints (-9 AM peak buses)
- 121 Fort York-Esplanade – AM peak
- 43 Kennedy – PM peak
- 129 McCowan North – AM peak
- 57 Midland – AM peak
- 133 Neilson – AM peak
- 124 Sunnybrook – PM Peak
- 168 Symington – AM peak
- 68 Warden – AM peak
January 2017 – Peak period service reductions to mitigate streetcar fleet constraints (-20 AM peak buses)
- 6 Bay – AM peak
- 14 Glencairn – AM peak
- 16 McCowan – AM peak
- 32 Eglinton West – AM peak
- 38 Highland Creek – AM peak
- 46 Martin Grove – AM peak
- 51 Leslie – AM and PM peak
- 85 Sheppard East – AM peak
- 102 Markham Rd – AM peak
- 112 West Mall – AM peak
- 123 Shorncliffe – AM peak
- 129 McCowan North – AM peak
- 190 Scarborough Centre Rocket – AM peak
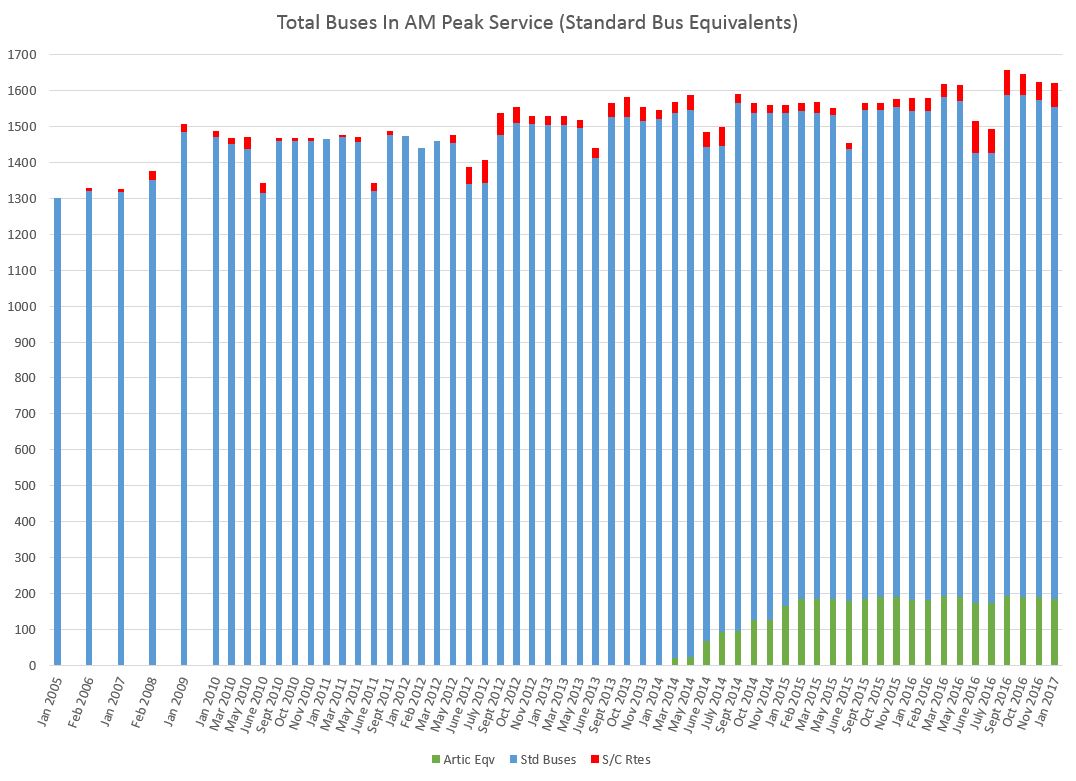
The situation with delays in streetcar deliveries is a serious one that has been gradually building as the old fleet wears out. However, it is important to take a longer view of the evolution of bus service in Toronto to see how fleet usage has evolved over the years. The charts below, with data taken from the TTC Scheduled Service Summaries, show the total number of buses used during the two peak periods.
- The blue portion is for buses running on bus routes, and in recent years the green portion is the articulated bus count adjusted by 1.5 for the larger capacity of these vehicles. The top of the blue section represents the buses serving bus routes on an equivalent-to-standard-bus basis.
- The red sections at the top of each bar are for buses used on streetcar routes.
The AM peak service improved slightly in late 2015 thanks to new buses purchased that year, but the numbers have been falling back.The total AM peak has not been flat since mid-2016, but has been slowly falling. If this were only a case of trading off buses for streetcars, the total would be constant. This shows the effect of service trimming in late 2016.
The situation in the PM peak is different because this period uses fewer vehicles (school and work peaks do not coincide in the PM), and so service is not constrained by the fleet as in the AM.

As an historic note, the big jump in 2009 was thanks to the Ridership Growth Strategy and the increase in the peak fleet. Even in the Ford years, the TTC managed some service improvements mainly due to years in which a “flat lined” subsidy actually gave the TTC more money because they had run a “surplus” in previous years. (The “next year” budgeted subsidy was higher than the “previous year” actual subsidy draw.)
The number of buses now running on streetcar routes (AM peak) in January 2017 is:
- 501 Queen: 23 (Queensway/Humber rehabilitation)
- 502/503 Downtowner/Kingston Rd: 16 (Streetcar shortage)
- 504 King: 12 (Streetcar shortage)
- 511 Bathurst: 17 (Streetcar shortage)
Assuming that the 40 new Flexitys promised by Bombardier arrive during 2017, then in theory many of the buses could be freed up for service on their own network. However, the TTC might decide that retiring old streetcars is a more important goal and spread the return of full streetcar operation into 2018. Nothing is certain until we actually see Bombardier’s cars.
For budget planning, however, the City will have to face new costs in 2018:
- Full year effect of the Spadina Subway extension (estimated at $23 million net of new revenue)
- Restoration of bus service plus any new express routes and a Ridership Growth Strategy
- First year cost of the “Fair Pass” subsidy for low-income riders (estimated at $4 million)
Full streetcar service on 504 King (plus complete conversion of 514 Cherry to Flexity cars) will improve capacity on King Street, but much of this is unlikely until 2018 at best. Current plans for Flexity implementation are on 509 Harbourfront, 514 Cherry, 505 Dundas and 511 Bathurst.
The irony in 2017 is that the streetcar shortage is actually saving the city money because the total number of vehicles that would otherwise be in service would be greater. Service cuts on bus routes for fleet availability would not have been needed, and the TTC would be scrambling to find operating dollars to run a full complement of streetcar service plus all of the buses it has available.
