In a comment on my article TTC eBus Study: Final Results, an alert reader noted that the claimed GHG reduction from the new fleet was vastly out of proportion. Here is the TTC’s chart from that report and accompanying text (highlighing added).
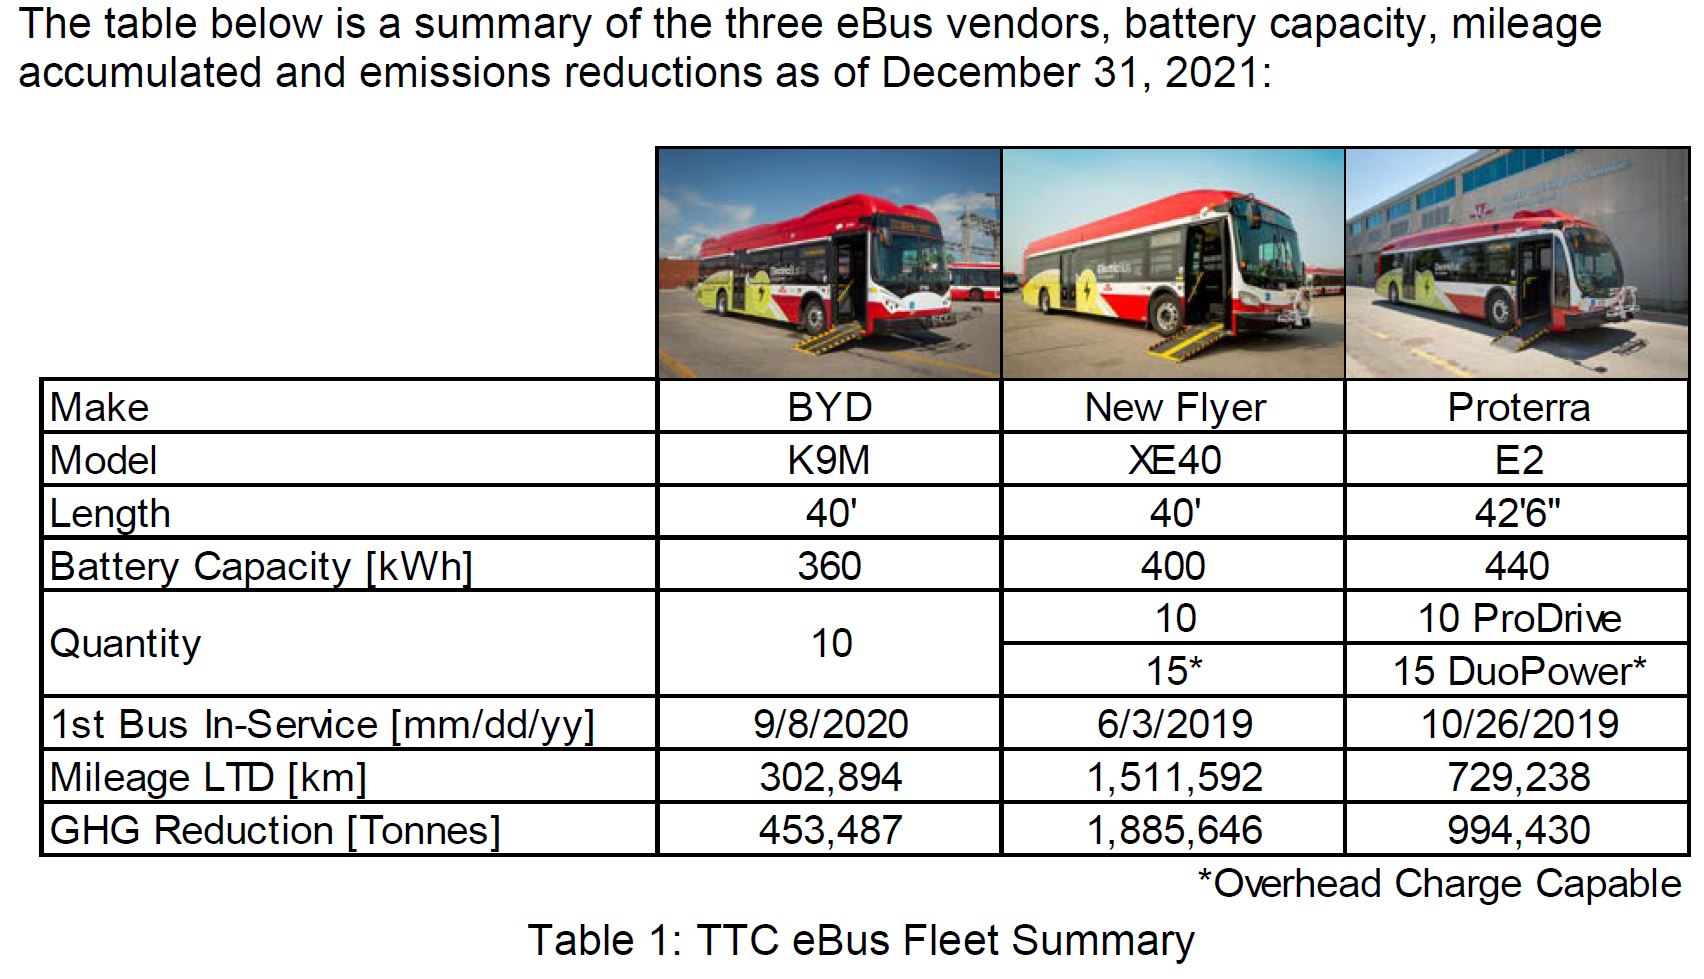
The TTC’s first 60 eBuses were procured from BYD, NFI and Proterra. Prior to the delivery of these eBuses, three garages (Arrow Rd, Mt Dennis and Eglinton Garages) were retrofitted with depot charging systems to accommodate charging up to 25 eBuses per location. All 60 eBuses procured have now been in-service between one to 2.5 years at the TTC with more than 2.5 million kilometres driven, and have reduced GHG emissions by 3.3 million metric tonnes.
TTC Report at p. 14
The basic problem here is the claim that for every kilometre travelled by an eBus rather than by a diesel bus, the saving would be over 1 Tonne of GHG. In the paragraph above, the saving should be 3.3 thousand metric tonnes, not 3.3 million. Who knows how many times this erroneous number will be cited.
The basic numbers are summarized in one paragraph on page 97 of the report:
GHG Reduction
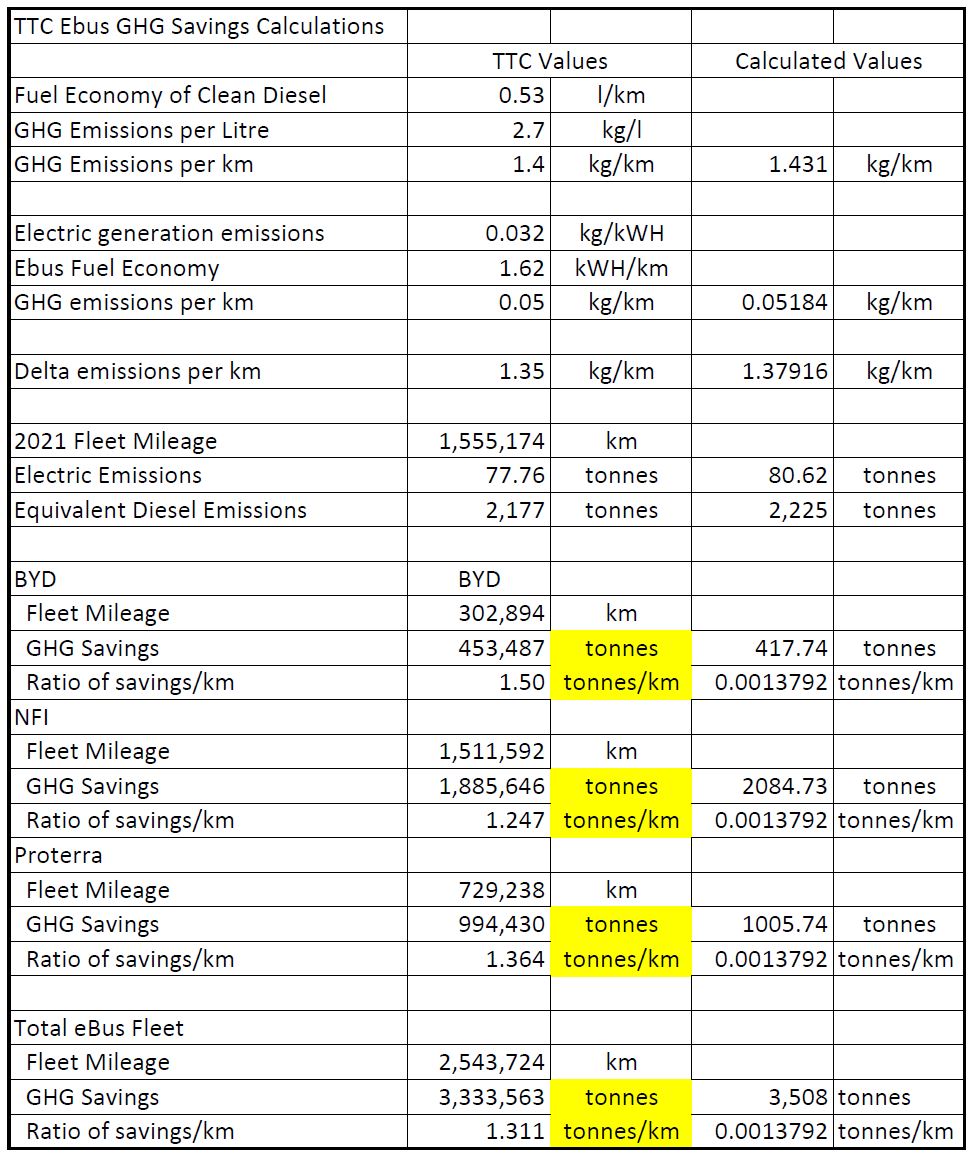
The greenhouse gases (GHG) reduction is primarily due to the avoidance of diesel fuel consumption. At an average fuel economy of 0.53 l/km, the TTC’s Nova clean diesel buses release 1.4 kg of CO2 per kilometre driven. The generation of electricity also creates emissions through many factors including direct emissions from fuel-fired power plants. For Ontario, the average CO2 emission for base load power is 32 g/kWh. The eBus fleet in 2021 averaged 1.62 kW/km (including all non-operating energy consumption sources), which equates to emissions of 0.05 kg CO2/km. Based on the fleet mileage of 1,555,174 km in 2021, emissions associated with the electricity supply are 80.8 Tons CO2. An equivalent clean diesel bus fleet would have emitted 2,177 Tons of CO2.
Note: The highlighted value should be 1.62 kWh/km. This is a typo in the TTC’s original text.
Running the Numbers
To save readers from working through these numbers, here they are consolidated as a spreadsheet.
The table below compares the TTC’s cited numbers with calculated values. Where a value is calculated, I have not rounded it as in the TTC’s descriptive text. For example, the GHG emissions per km for eBuses is shown as 0.05184 rather than 0.05 kg/km. Cells highlighted in yellow have the wrong units, but this is what the TTC specified in its chart.
The problem here is that the line “GHG Savings” claimed is erroneously stated in Tonnes (1,000 kg) rather than in kilos making the numbers 1,000 times bigger than they actually are.
This has the absurd effect of making the “saving” per kilometre over 1 tonne when the diesel fuel we start with weighs less than 1 kg.
I checked with the TTC, and, yes, the chart is wrong. It should specify savings in kilos, not in tonnes.
The calculated emission savings are obtained by multiplying the “delta” value (difference in emissions by fuel source) by the reported fleet mileages. The claimed values are taken from the TTC’s chart above.
There is a further problem that the ratio of claimed GHG savings to distance operated varies from one vendor to another. There is no explanation for this although the report does cite different fuel consumption rates for each manufacturer’s bus.
Although I have asked, the TTC has not explained why these values are different.
Clean Diesels vs Hybrids as a Reference
There is a further issue with the numbers published by the TTC. They are based on a comparison with “clean diesels” even though some of the vehicles to be replaced include the first generation of hybrids with have lower fuel consumption.
The TTC reports that the GHG saving between a first generation hybrid and an eBus is about 1.315kg CO2/km, as against 1.379 for clean diesels (from the table above). This suggests that the first generation hybrids are not saving much fuel compared to the diesels (less than 5%).
Getting It Right
The main report contains a more reasonable number:
When the entire fleet is zero-emissions, the following benefits are expected to be realized:
1. Greenhouse gas emissions will be reduced by approximately 250,000 tonnes of CO2 annually; […]
TTC Report at p. 3
In pre-covid times (2019), the TTC operated 145.1 million km with its bus fleet. At a saving of about 1.38 kg CO2/km, this translates to 200,000 tones of CO2, a somewhat lower figure than the TTC claims.
As Toronto launches into a new electric era, the TTC needs to clean up its statistics and calculations so that those trumpeting our efforts use the correct data.
Environmentalists, transit boosters, city planners, anyone who is touting electrification should be careful to cite correct figures for the expected benefit of eBuses.
I have no problem with “going green” and welcome the shift to electric vehicles. That said, it is important that the benefits be stated accurately and clearly so that “green” is not oversold. Toronto’s transit history is littered with hucksters.
Updated April 10, 2022 at 10:30pm: Minor typos fixed. Bus order size for eBuses by TTC corrected. Reference to use of pantographs for charging on TTC buses corrected.
Updated April 18, 2022 at 2:50 pm: Note that the GHG savings cited in the TTC’s chart below are off by a factor of 1,000 because they mixed up kilos and tonnes partway through the calculation. See also TTC eBus Errata: Tonnes and Kilos Are Different.
Since June 2019, the TTC ran head-to-head trials of three manufacturers’ battery-electric buses with a fleet of 60 vehicles:
New Flyer models SR2304 (10) and SR2382 (15)
Proterra models Catalyst 40 E2 RR Pro Drive (10) and DuoPower (15)
BYD model K9M (10)
Nova Bus was not part of the trial because, when it was launched, they did not have a vehicle with sufficient range to meet the specifications. However, their hybrid diesel-electric bus, of which the TTC has many, was used as a comparator for the trial.
The low number of BYD buses was due to their inability to supply vehicles even though their lobbyists had engineered, through Deputy Mayor Minnan-Wong, a “deputation” at a TTC Board Meeting that turned into a full sales pitch clearly hoping to short-circuit the procurement process. This was not a high point in TTC history, and the move to a green fleet was launched under very dubious circumstances.
There is also bitter irony for those who remember TTC history. Three decades ago, the TTC opted for the allegedly-green technology of Natural Gas buses as a replacement for trolley bus system expansion. The CNG buses are long gone from Toronto, and the TTC now plans to move completely to electric transit. Lobbyists are good at selling things – whether they work or not is a secondary consideration.
The 102 page report TTC’s Green Bus Program: Final Results of TTC’s Head-to-Head eBus Evaluation goes into great detail of Toronto’s experience with their trial fleet and sets out many “lessons learned” and “must haves” for any large-scale procurement. This article is organized somewhat like the report with an overview followed by some of the technical background. The “lessons learned” have been consolidated at the end. Interested readers should consult the full report.
The clearly superior vehicles in the trial were the New Flyer buses. There were severe problems with reliability and maintainability in both the Proterra and BYD fleets, and some of the “must haves” would exclude them from consideration even if both vehicles and manufacturers had performed better.
Whether this technical outcome will be coloured by another round of lobbying remains to be seen. There will be a lot of money sloshing around as governments rush to “buy green”, but running transit requires a fleet that delivers reliable service, not just publicity photos. Toronto cannot afford to tie the future of its bus fleet to a manufacturer whose political connections outweigh their ability to deliver good products.
The TTC has funding in place from various governments to cover the purchase of about 600 vehicles. These will meet its replacement and growth needs from 2022 to 2025. In February 2022, the TTC ordered 336 buses for delivery by the end of 2023:
Nova Bus LFS Hybrid 40′ (134)
New Flyer Xcelsior Hybrid 40′ (134)
New Flyer Xcelsior Hybrid 60′ (68)
These will be the last buses with diesel propulsion for Toronto, and they would be due for replacement in the mid 2030s completing the conversion to an all-electric bus fleet.
An RFP (Request for Proposals) was issued on April 4, 2022 for a large purchase (at least 240 vehicles) of eBuses with contract award planned for the third quarter of 2022. This lands in the middle of the municipal election campaign, and the authority to award will be delegated to TTC management by the Board. Bids will close on June 17, and the successful vendor(s) would be notified in July with execution of agreements in August. (The last scheduled TTC Board meeting is on July 14, 2022.)
The specification for these buses was developed jointly by the TTC with other agencies:
The TTC is engaged with other peer transit agencies in the province, including Brampton Transit, Mississauga Transit, York Region Transit, and others through the Ontario Public Transit Association on the first interagency co-operative procurement of eBuses. The aim of this collaboration is to develop a single zero-emissions bus procurement specification with the immediate benefit of reducing cost through economies of scale. The long-term benefit is through the optimization and standardization of customer experience and, operations and maintenance throughout the GTHA and beyond.
TTC Report at p. 4
The potential quantity of buses is considerably higher with options for both the TTC and other agencies.
Source: TTC Vendor Briefing Session Deck April 8, 2022 at p. 5
In parallel to its migration to an electric fleet, the TTC must convert its bus garages including the provision of charging infrastructure for hundreds of vehicles at each location. At a previous meeting, the Board authorized an agreement with Ontario Power Generation and Toronto Hydro for the charging infrastructure. The utilities will build, own and maintain this as an extension of their distribution system.
Although the specification includes a requirement for on-route charging using stationary charging points, the TTC has not yet determined if or how such facilities would be used. There is no consideration of “in motion” charging using conventional trolleybus infrastructure to avoid the need for buses to lay over to recharge during their revenue service hours.
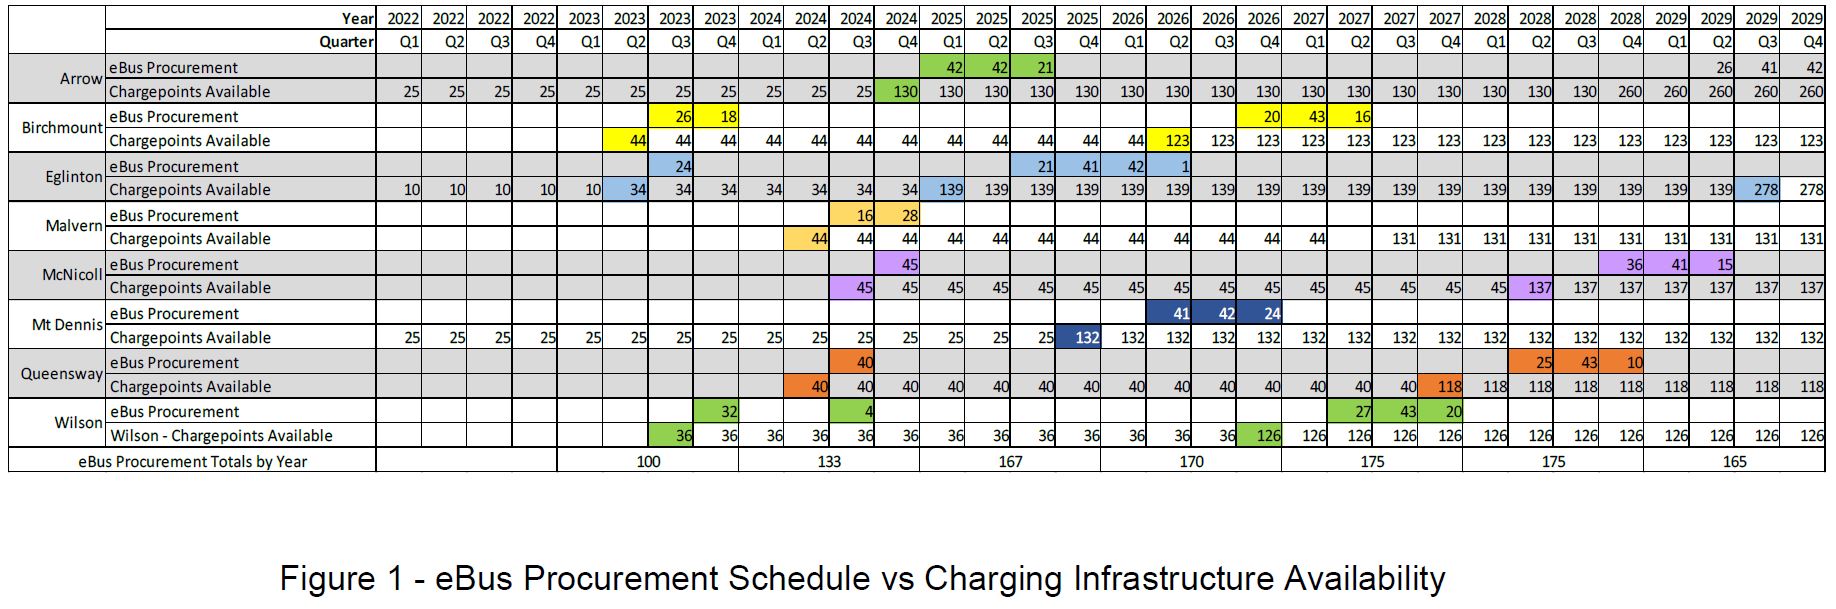
The overall plan for both buses and charging infrastructure is shown in the table below grouped by garage. This accounts for 1,085 buses, about half of the existing fleet. The first 240 buses planned in the contract award this year would take the TTC into early 2025. The program is not funded yet beyond that point. As and when more money appears, the TTC would extend its order.
Note that there are two phases to the installation of charging facilities at garages as the roll out of electrification works its way through the system. This allows some routes from each garage to operate with eBuses earlier in the program than might be practical if the conversion went garage-by-garage over the next decade.
The two-step scheme would also allow for a tactical change in charging strategy to move more of this to enroute facilities such charging stations at terminals. Although the TTC report is mostly silent on any charging technique beyond garage-based plug-in systems, there is a reference in “lessons learned” to a conversion to pantograph charging as a cure for problems with charging cables.
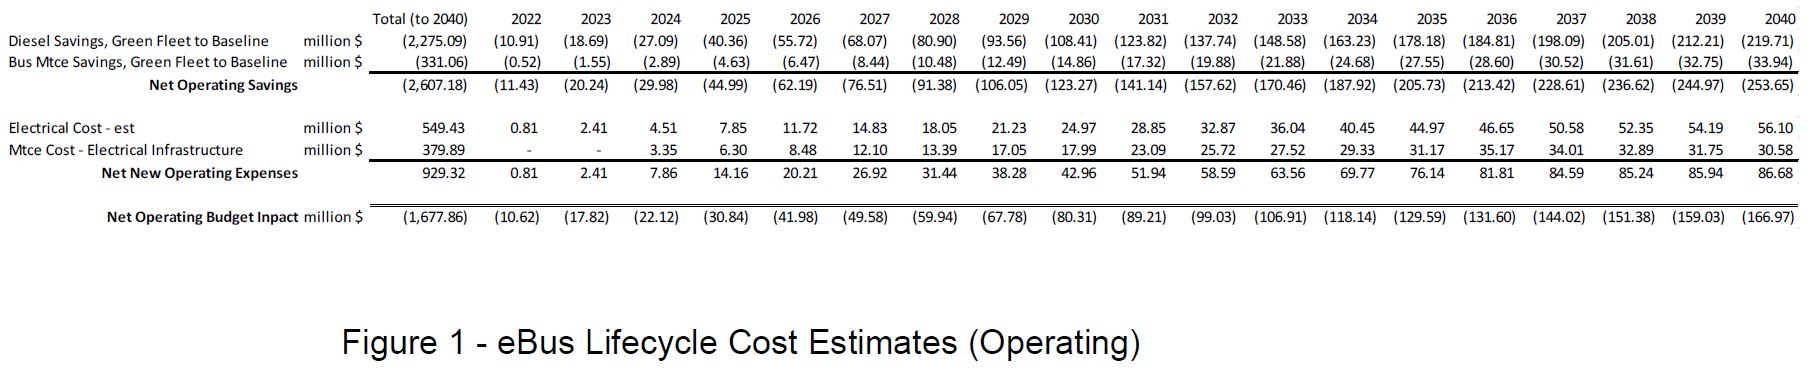
The TTC projects that life cycle costs for an electric fleet will be lower than for the diesels and hybrids it will replace because both energy and maintenance costs will go down. By 2040 this would save about $167 million annually. These estimates are sensitive to the future price of diesel fuel compared to electricity, but the TTC has not shown a range of values to indicate what the effect might be.
An 18-Year Design Life
Although the TTC report does not mention this, the actual RFP includes an interesting specification for fleet longevity. This signals a return to 18-year lifespans for the bus fleet after a retreat to 12 years in current fleet planning. If this can be achieved, it will offset the higher capital cost of the vehicles compared to hybrids or diesel buses.
1.1.1 The Bus shall have an 18-year design life and be equipped with a long life structure in accordance with Specification Section 1.8, made from full stainless steel in accordance with Specification Section 3.0, have a body with a maximum overall length of 12.8 m (42ft.) including a stowed Bike Rack , 2.59 m (8 ft.-6 in.) in width and a maximum overall height of 3.4 m (134 in.).
RFP Technical Requirements Section 1, Page 6
Later in the RFP:
1.8 SERVICE LIFE
Buses shall be designed for a minimum service life of 18 years or 1,610,000 km (1,000,000 mi.), under severe operating conditions similar to revenue transit operation in the City of Toronto.
RFP Technical Requirements Section 1, Page 19
And in more detail:
The vehicle design life shall be validated by successful completion of a simulated 12-year average New York City duty cycle service life. The test program shall be designed around input measurements taken from a vehicle configured similarly to the test vehicle while it’s being operated over a known severe route. The New York City B.35 route or an approved equivalent (i.e., the Queens Q.44 route is now reportedly used by New York City), shall be used for a simulated 800,000 km (500,000 mi.) to demonstrate Bus longevity. This is generally considered to be the equivalent of 16 to 18 years operating life at all other transit properties.
RFP Technical Requirements Section 1, Page 20
“Must Have” Specifications
An important outcome of the trial has been the development of a “must have” list, and certain aspects of any new fleet are not negotiable. Toronto has a history with every type of vehicle (subway, streetcar, bus) where pervasive problems have hobbled fleet performance and availability.
TTC’s next large-scale eBus procurement includes ‘must have’ requirements that are informed by the head-to-head evaluation and focus on ensuring longevity of the bus structure and high system reliability through a proven platform (e.g. stainless steel structure, doors, HVAC, suspension, etc.).
TTC Report at p. 2
These requirements are:
1. Altoona and shaker table testing has been successfully completed; 2. A full stainless steel structure with a minimum of six years of in service experience; 3. A minimum usable battery capacity of 400 kWh; 4. A maximum overall bus length of 12.8 m (42 ft.) including a stowed bike rack; 5. A maximum overall height of 340 cm (134 in.) including any roof-mounted equipment; 6. Ability to charge via roof mounted pantograph charging interface, capable of accepting a minimum charge rate of 300kW (400 ADC) at 750 VDC or greater via SAE J3105/1; and 7. Two rear-mounted charging ports capable of accepting a minimum charging rate of 150 kW (200 ADC) at 750 VDC or greater via SAE J1772.
TTC Report at p. 24
Requirement 3 conflicts with statements elsewhere in the report where a maximum length of 40 feet is cited so that buses will fit within existing garage designs and operations. The difference appears to be in whether the bike rack counts toward the total, but it is not clear whether the Proterra bus would meet this requirement.
Physical Compatibility: The industry standard bus length is 40-feet (12 metres). This standard was used to design storage facilities in the TTC’s existing bus garages.
The Nova HEV, BYD, and NFI buses meet this standard. Proterra buses are 42.5 feet long, but also offers the highest seating and standee capacity. Based on our bus garage layout, procurement of additional Proterra buses would result in a loss of storage capacity of approximately 10% at four of eight garages. The remaining four bus garages could accommodate this additional length. However, this would impose a significant operational constraint that would prevent movement of buses between garages.
TTC Report at p. 15
A maximum bus length specification of 40 feet is required in order to preserve bus storage density at existing maintenance facilities; …
TTC Report at p. 16, also p. 28, under “Lessons Learned”
It is not clear whether the TTC is prepared to accept buses over 40 feet long, and what position they will take about Proterra vehicles on that account. Other issues with that vendor, notably bus reliability, might knock them out of the running regardless of bus length.
An additional requirement applies to the contract itself rather than to the buses, and it addresses the City’s equity goals:
In support of the commitment to diversity, equity, and inclusion, the Contractor must agree, as a fundamental component to the Contract, to meet the Procurement Equity Requirements, by applying a percentage of the Contract Price in respect of the Diverse Business Enterprise Requirement and a specified number and percentage, as stated in the Proposal, in respect of the Equity Hired Requirement.
TTC Report at p. 7
This is a contrast to recent provincial actions to back away from equity and community benefit components in contracts.
Updated January 13, 2022 at 6:45 am: Sundry typos and scrambled phrases have been corrected. The projection of additional bus requirements for a 70 per cent service increase has been corrected to include spares.
At its recent meeting, Toronto Council endorsed a plan to move the City to Net Zero emissions by 2040. A review of the full plan is well beyond the scope of this blog, but some proposals affecting transit service and operations are very aggressive.
If Toronto is going to be serious about this we need a detailed examination of assumptions, scenarios, cost projection, and plans out to 2040. Where will population and job growth be? How will transit serve them?
Before I get into the report itself, a quotation from former TTC CEO Andy Byford is worth mention.
Andy Byford sums up the role of a transit system:
“…service that is frequent, that is clean, that goes where people want to go, when people want to go there, that is customer responsive, that is reliable, in other words that gets the basics right …”
Too often we concentrate on big construction projects, or a new technology, or a showcase trial on one or two routes rather than looking at the overall system. In particular, we rarely consider what transit is from a rider’s point of view. It is pointless to talk about attracting people to use transit more if we do not first address the question of why they are not already riding transit today. This is an absolutely essential part of any Net Zero strategy.
The reports contain a lot of material, although there is some duplication between them. They contain proposals for short and medium term actions. At this point, Council has not embraced anything beyond the short term plan.
From a transit point of view, that “plan” is more or less “business as usual” and does little to challenge the current status of transit service in the short term. There is hope that electrification of the diesel/hybrid bus fleet might be accelerated, but little sense of what, on a system-wide basis, would shift auto users to transit beyond works already in progress.
A vital point here is that transit has two major ways to affect Council’s Net Zero goals:
Conversion of transit vehicles to all-electric operation will reduce or eliminate emissions associated with these vehicles, depending on the degree to which the electricity sources are themselves “clean”. This is a relatively small part of the City’s total emissions.
Shifting trips from autos to transit (or to walking or cycling) both reduces emissions and relieves the effects of road congestion, including, possibly, making more dedicated road space available for transit and cycling. Emissions from cars are much more substantial than those from transit.
In the short term, the overwhelming focus is on conversion of the existing bus fleet to electric operation, not of expanding service to attract more riders. Improvements to specific routes might come through various transit priority schemes, but these will not be seen system-wide. Based on demand projections, large scale capital works, notably new subway lines, will primarily benefit existing riders rather than shifting auto users to transit.
The short term targets related to transit are quite simple:
Electrify 20 percent of the bus fleet by 2025-26.
This effectively requires that 400 diesel or hybrid buses be converted. The TTC already plans to buy 300 eBuses, and the Board has asked TTC management to look at accelerating this conversion. This target is very low hanging fruit provided that someone will pay for the buses.
Further targets are 50 per cent conversion by 2030, and 100 per cent by 2040.
Looking at the TTC’s likely replacement schedule (discussed in my Capital Budget Follow-Up), they will easily be achieved as much of the existing fleet is due for replacement by the early 2030s. Hybrid buses to be acquired this year will reach end of life in 2034-35.
This is an endorsement of “more of the same” in our transit planning, but no real commitment to making transit fundamentally better so that it can handle many more trips at lower emission rates than today.
Looking further out there are proposals for substantially more transit service and free fares, but these are not fully reflected in projected costs or infrastructure needs.
Some of the proposals for the NZ2050 plan are, shall we say, poorly thought-out:
Convert one lane of traffic to exclusive bus lanes on all arterials.
Many arterials are only four lanes wide and taking a permanent bus lane has considerable effects on how the road would operate. This is a particular problem for routes with infrequent service during some periods of operation.
Increase service frequency on all transit routes: bus by 70%, streetcar by 50%, subway off-peak service increased to every 3 mins.
This represents a very large increase in transit service with effects on fleet size, facilities and, of course, budgets. This would require an increase in the bus and streetcar fleets beyond what is already planned as well as construction of new garages and a carhouse.
Tolls of $0.66/km on all arterial roads.
This would apply only to fossil-fueled cars, and the forecast amount of revenue is less than half of the additional funding transit would require.
No transit fares.
The immediate cost of this would be about $1.2 billion in foregone fare revenue, offset by about ten percent in the elimination of fare collection and enforcement costs.
Shift 75% of car and transit trips under 5km to bikes or e-bikes by 2040.
This is truly bizarre. In effect, transit stops performing a local service for most rides and they are shifted to cycling. The average length of a transit trip is under 10km, and many are shorter. Moreover, trips are often comprised of multiple hops each of which might be quite small. There is a small question of how much uptake there would be in poor weather conditions.
Shift 75% of trips under 2km to walking by 2040.
Even some transit trips are short, and transit, especially with improved service, is the natural place for these trips. It is not clear whether the plan would be to somehow deter transit users from making very short trips just as, indeed, a car driver would.
[Revenue and cost issues are discussed in more detail later in this article.]
With all of the planned investment, transit’s mode share of travel is projected to fall, while walking and cycling would rise considerably in part because of the policy of diverting short trips. It simply does not make sense to push people off of transit just at the point where we are trying to encourage transit use. This part of the plan is laughably incoherent, and is an example of how good intentions can be undermined by poorly crafted policy.
For example, it is less than 5km from Liberty Village to Yonge Street, and if we were to take the proposal seriously, we would expect most people to cycle to work downtown, not take GO or the streetcar services. I look forward to the public meeting where this scheme is unveiled to the residents. If the demand for GO and for the King car is any indication, they do not want to use “active transportation”. Similarly, the planned development at East Harbour is less than 5km from downtown.
Meanwhile, transit electrification itself only eliminates 3 per cent of existing emissions, assuming a clean source of electricity. The subway and streetcar systems already are electrified, and both have capacity for growing demand if only more service were operated.
City Council endorse the targets and actions outlined in Attachment B to the report (December 2, 2021) from the Interim Director, Environment and Energy, titled “TransformTO Net Zero Strategy”.
Councillor Layton moved two amendments:
* Request the Board of the Toronto Transit Commission to identify opportunities to accelerate the Green Bus Program and to request the CEO, Toronto Transit Commission to report to the Board in the second quarter of 2022 on these opportunities.
* City Council request the City Manager, in consultation with the General Manager of the Toronto Transit Commission, to outline in the 2022 Budget proposal options to increase spending on surface vehicles and hiring additional operators aimed at increasing ridership to get us on the path to achieving the TransformTO goals.
The first amendment echoes a request from the TTC Board to its management at the December 20, 2021 meeting. Acceleration of eBus purchases will require additional funding from somewhere, as well as a vendor capable of meeting a larger order. It will also have effects on TTC infrastructure needs for garaging.
The second amendment is more pressing because it speaks to the 2022 Budget process that will launch on January 13. If the TTC is going to ramp up service this year, this must be factored into the budget. A likely problem will be that any growth beyond that now planned will be entirely on the City’s dime rather than supported by other governments. However, we need to understand what could be done, if only to know the cost should a “fairy godmother” show up with some spare change.
Neither the amendment nor the short-term target for 2022-2025 gives any indication of just what is meant by “better” transit service, nor do they distinguish between restoring pre-covid service levels and going beyond that to encourage more ridership.
The points listed above for NZ2050 are excerpted from Attachment C, the technical background report. A casual reader might think that Council has embraced a very expansive view of transit’s role, but they have not.
The tactics from Attachment C are notably absent from Attachment B which refers to them, but actually lists a much more restricted set of transit goals. I have confirmed with City staff that Council has only endorsed Attachment B.
Q: For clarification: There are, broadly speaking, two levels of a shift in the emphasis on transit in the short term plan to 2030 and in the longer term to 2040 and beyond. Reading the Council motion, it appears that Council has endorsed the short term plan (Appendix B), but has not endorsed the more aggressive targets of the longer term set out in Appendix C. Is this a correct interpretation?
A: Yes. City Council endorsed the targets and the actions outlined in Attachment B ‘TransformTO Net Zero Strategy’. Attachment C is a technical backgrounder report that was used to inform the targets and actions that were recommended and adopted.
Email from Steve Munro to Toronto Media Relations, December 29, 2021. Response from Toronto Environment & Energy Division, January 10, 2022.
That is a polite way of saying “we had some really aggressive ideas, but we know enough not to bring them to Council”.
“Transit” vs “Transition”
In the process of reviewing the reports, I searched on the word “transit”, but got hits more frequently on “transition” as there are many other sectors where reduction or elimination of emissions are possible and on a large scale.
According to the most recent greenhouse gas inventory, transportation is the second largest source of GHG emissions, accounting for 36 percent of total emissions with approximately 97 per cent of all transportation emissions originating from passenger cars, trucks, vans, and buses. Gasoline accounts for about 30 per cent of Toronto’s total GHG emissions.
TransformTO: Critical Steps for Net Zero by 2040. p. 30
Here is a pie chart showing the relative contribution of each proposed action in the Attachment C list which is a more aggressive set of changes than Council adopted. Note the small contribution of transit (red) compared with other areas such as personal and commercial vehicles and changes to building energy use.
Based on Section 7: Low-Carbon Actions pp 52-56 in the Net Zero Technical Report
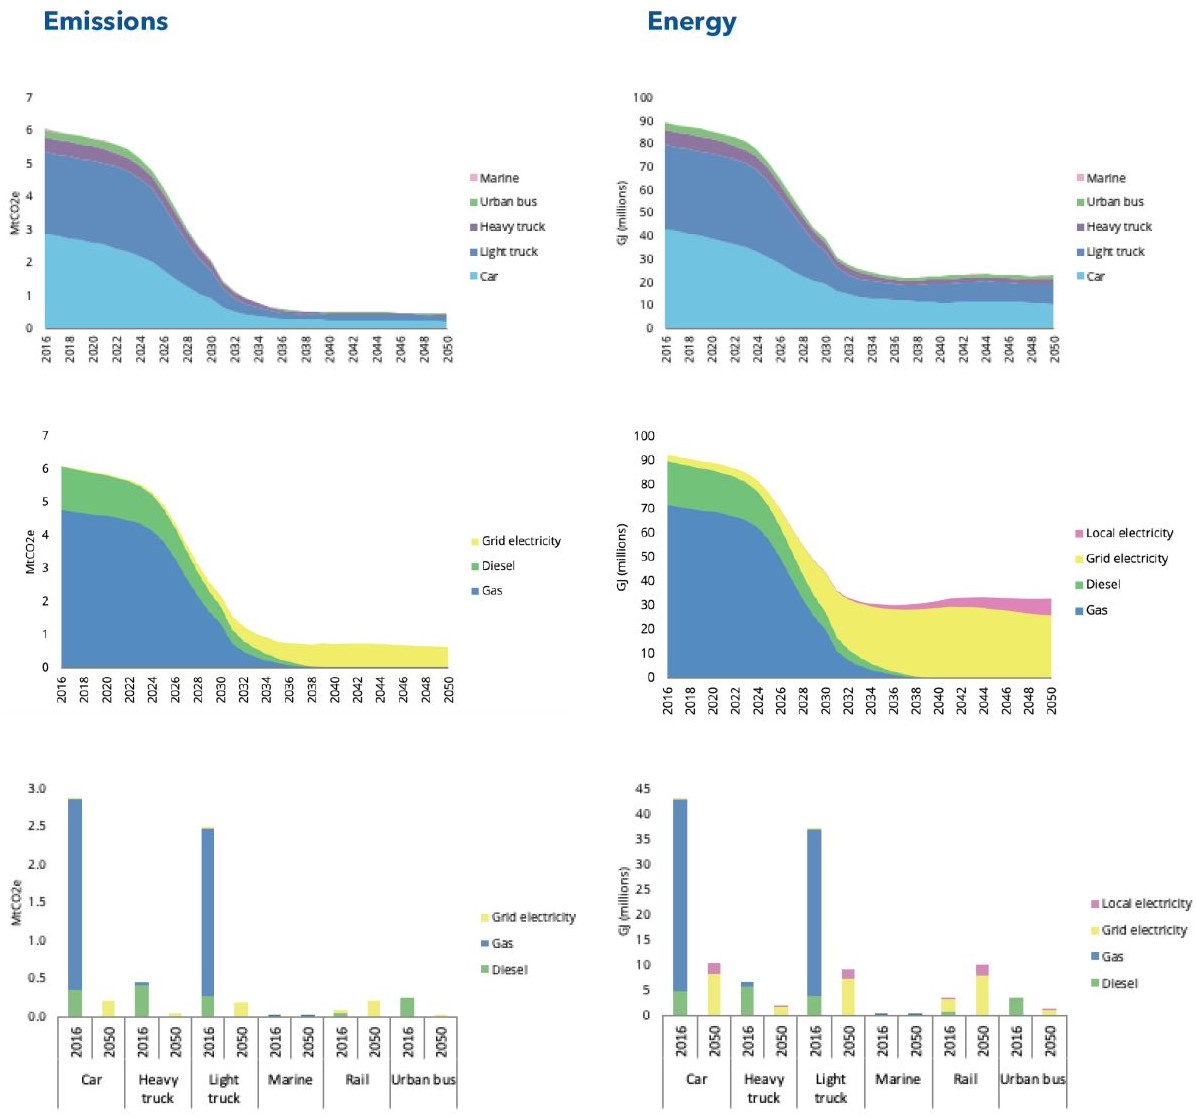
Another way to look at this is shown in a chart of energy sources and emissions generated by each transportation sector as the full NZ plan is implemented.
Top left: the emissions of urban buses are shown in green. This falls off to zero as the bus fleet electrifies.
Middle left: the decline in diesel (green) is a combination of transit, trucking and a small contribution from diesel-powered autos.
Bottom left: Cars and light trucks are the overwhelming contributors of emissions within the transportation sector.
On the right, the charts are harder to accept at face value because they include the effect of a very large shift of short trips to active transportation. An interesting comparison would be what might happen if autos electrified, but did not lose mode share.
That last point has a knock-on effect because if short trips are not shifted, but are only electrified, they will contribute a substantial demand to generating and charging capacity, not to mention continued auto traffic and competition for road space.
The topics here are a bit scattershot as was the Board debate, but they include:
The Toronto Net Zero 2040 plan and electric buses
The conflict between budget planning timeframes and available funding
The growing backlog in State of Good Repair
Fleet replacement timing issues
Where the money comes from
The need to co-ordinate related projects within the budget
Funding for capital programs
Future subway demand and capacity enhancements
There is always a problem with the complexity of the budget that drops on Board members at most a week before the meeting where it will be approved.
There is no “Budget Committee” at the TTC, and so there is no group within the Board who are primed for the debate and can vouch for management’s work in the same manner as the TTC’s Audit & Risk Management Committee. The Board used to have a Budget Committee, but it languished under an uninterested chair (ironically, a member of Council’s hawkish right) and the current Board is unwilling to recreate it.
This says a lot about how seriously (or not) they take their oversight role. Let a few pencils go missing and the Audit folks will be all over the problem, but billions in capital spending and the underlying policy decisions go with little review. This should be a job for whatever TTC Board is crafted for 2023 after the next municipal election.
The TTC’s 2022 Capital Budget report has been published as part of the December 20, 2021 TTC Board meeting agenda. This includes three components:
A 15-year capital investment plan giving an outlook on all projects, funded or otherwise, to 2036.
A 10-year capital budget for funded projects.
A real estate investment plan that ties property needs into capital planning. This is a new component in TTC capital planning.
For political reasons, the capital plans before 2019 were low-balled to stay within available funding, but this hid necessary projects that appeared as a surprise to the TTC Board and Council. One way this was done was to class them as “below the line” (not in the funded list), but more commonly to push their supposed delivery dates beyond the 10-year capital budget window. This made the City’s exposure to future spending appear lower than it was in fact.
A particularly bad case was the collection of projects and contracts for ATC implementation on Line 1. In order to “sell” this badly needed project politically, it was subdivided and some resulting contracts used mutually incompatible technology. The original chunk was simply a plan to replace the existing block signals used from Eglinton to Union and dating from the subway’s opening in 1954. One by one, other pieces were added, but the disorganization was such that ATC was actually an “add-on” to the Spadina extension because it had not been included in the base project.
The situation was further complicated by awards to multiple vendors with incompatible technologies on the premise that each piece could be tendered separately without regard for what was already underway. A major project reorganization during Andy Byford’s tenure as CEO untangled this situation, and provided a “lesson learned” for the Line 2 ATC project.
In 2019, the TTC changed tack and published a full list of its needs and extended the outlook five more years. This came as a huge shock to politicians and city management when the capital needs shot up from $9 billion to well over $30 billion.
Updated December 11, 2021 at 6:30 pm: A chart showing the total hours in service for each eBus for 2021 has been added to the article.
Updated December 16, 2021 at 7:00 am: Charts showing fleet usage on a percentage basis for each vendor have been added to the end of the article.
Updated January 9, 2022 at 10:15 am: Charts including December 2021 data have been replaced to include day to the end of the year.
This article is an update on my previous review of stats for the eBus fleets from July to December 2021. Readers coming to this thread for the first time should read both articles.
The intent here is to go back six more months in the data to see whether there has been a change in the usage patterns of the three eBus fleets over the full year.
A complete set of charts for the year is linked at the bottom of the article in PDF format.
The year’s data show that the New Flyer eBuses were in service the most, although a few of the BYD buses managed daily periods in service that were longer. Many of the Proterra and BYD buses spent extended periods out of service, a much less common issue with the New Flyers.
The hours of service logged by a comparison group of Hybrids and Artics were consistently higher than the eBuses, although individual vehicle ranges overlap.
How Much Was Each Bus In Service
The table below shows for each of the 60 Buses the number of hours per month that they were tracked in service on a route, as opposed to sitting in the garage, or not visible to the tracking system. As before, all data have been extracted from logs on the TransSee website (Premium version), and those data in turn comes from the TTC’s vehicle tracking feed.
For comparison, 25 Hybrids and 25 Artics are shown for September 2021. Any vehicle which showed no activity in the month is flagged with a pink stripe.
In graphic format, here are the values for the Flyer fleet.
Each group of columns has one month’s data.
Within each month, each column represents one bus.
The variation in hours/month is clear between vehicles and in different months through the year. Note that December is an incomplete month and so the values are much lower. Also, there is no adjustment for the length of months (31, 30 or 28 days).
Here are the values for the Proterra fleet. Note that the columns are shorter and the data sparse compared to Flyer above. This is due to the number of vehicles that were out of service (missing columns) and the lower utilization of those that did operate.
The data for BYD show some higher individual values than the Flyer fleet, but also a lot of gaps and low values indication vehicles that were out of, or only minimally in service, especially late in the year.
Some of the higher values are due to BYD buses that managed to remain in service for more consecutive hours rather than having either a split day, or only one 4-5 hour tour. To what degree this reflects inherently better performance, and how much of the difference is due to dispatching practices at each garage (each fleet is at a different garage) is hard to know. When they run, some of these buses rack up considerable hours, but only one bus logged hours in all twelve months (3755) and one bus was out of service for eight month in the year (3750).
Another way to look at these data is the total in service hours for each vehicle. On this basis, Proterra fared the worst. BYD was better for selected vehicles, not for the fleet as a whole.
Updated December 9, 2021 at 6:20 am:A reader noted that of the range of articulated buses used as a comparison sample, one vehicle (9003), has been retired. The stats have been updated by adding 9025 to the range so that both the hybrid and artic samples contain the same number of active vehicles. Charts in the article have been updated as well as the linked PDF versions.
January 9, 2022: The follow-up article containing data for January to December has been updated with charts containing all of December 2021. The charts in this article contain only data for December 1-7.
The TTC is about to award one or more contracts for buses in the coming months including 300 conventional hybrids and 300 battery eBuses.
Although they have been conducting a head-to-head comparison of vehicles from three vendors for some time, they have not published results for each of them separately. Moreover, it is not clear the extent to which this comparison will inform the purchase for two reasons:
Vendors may claim that their newer buses are better than the ones the TTC is testing.
Some vendors’ products were not in the trial because they did not have a vehicle meeting TTC requirements at the time of the request for proposals.
The TTC eBus fleet consists of 25 buses from each of New Flyer and Proterra, and 10 from BYD. The original plan was for this order to be split equally among the three vendors, but BYD could not deliver their buses on a timely basis, and part of their “share” was divided between the other two vendors.
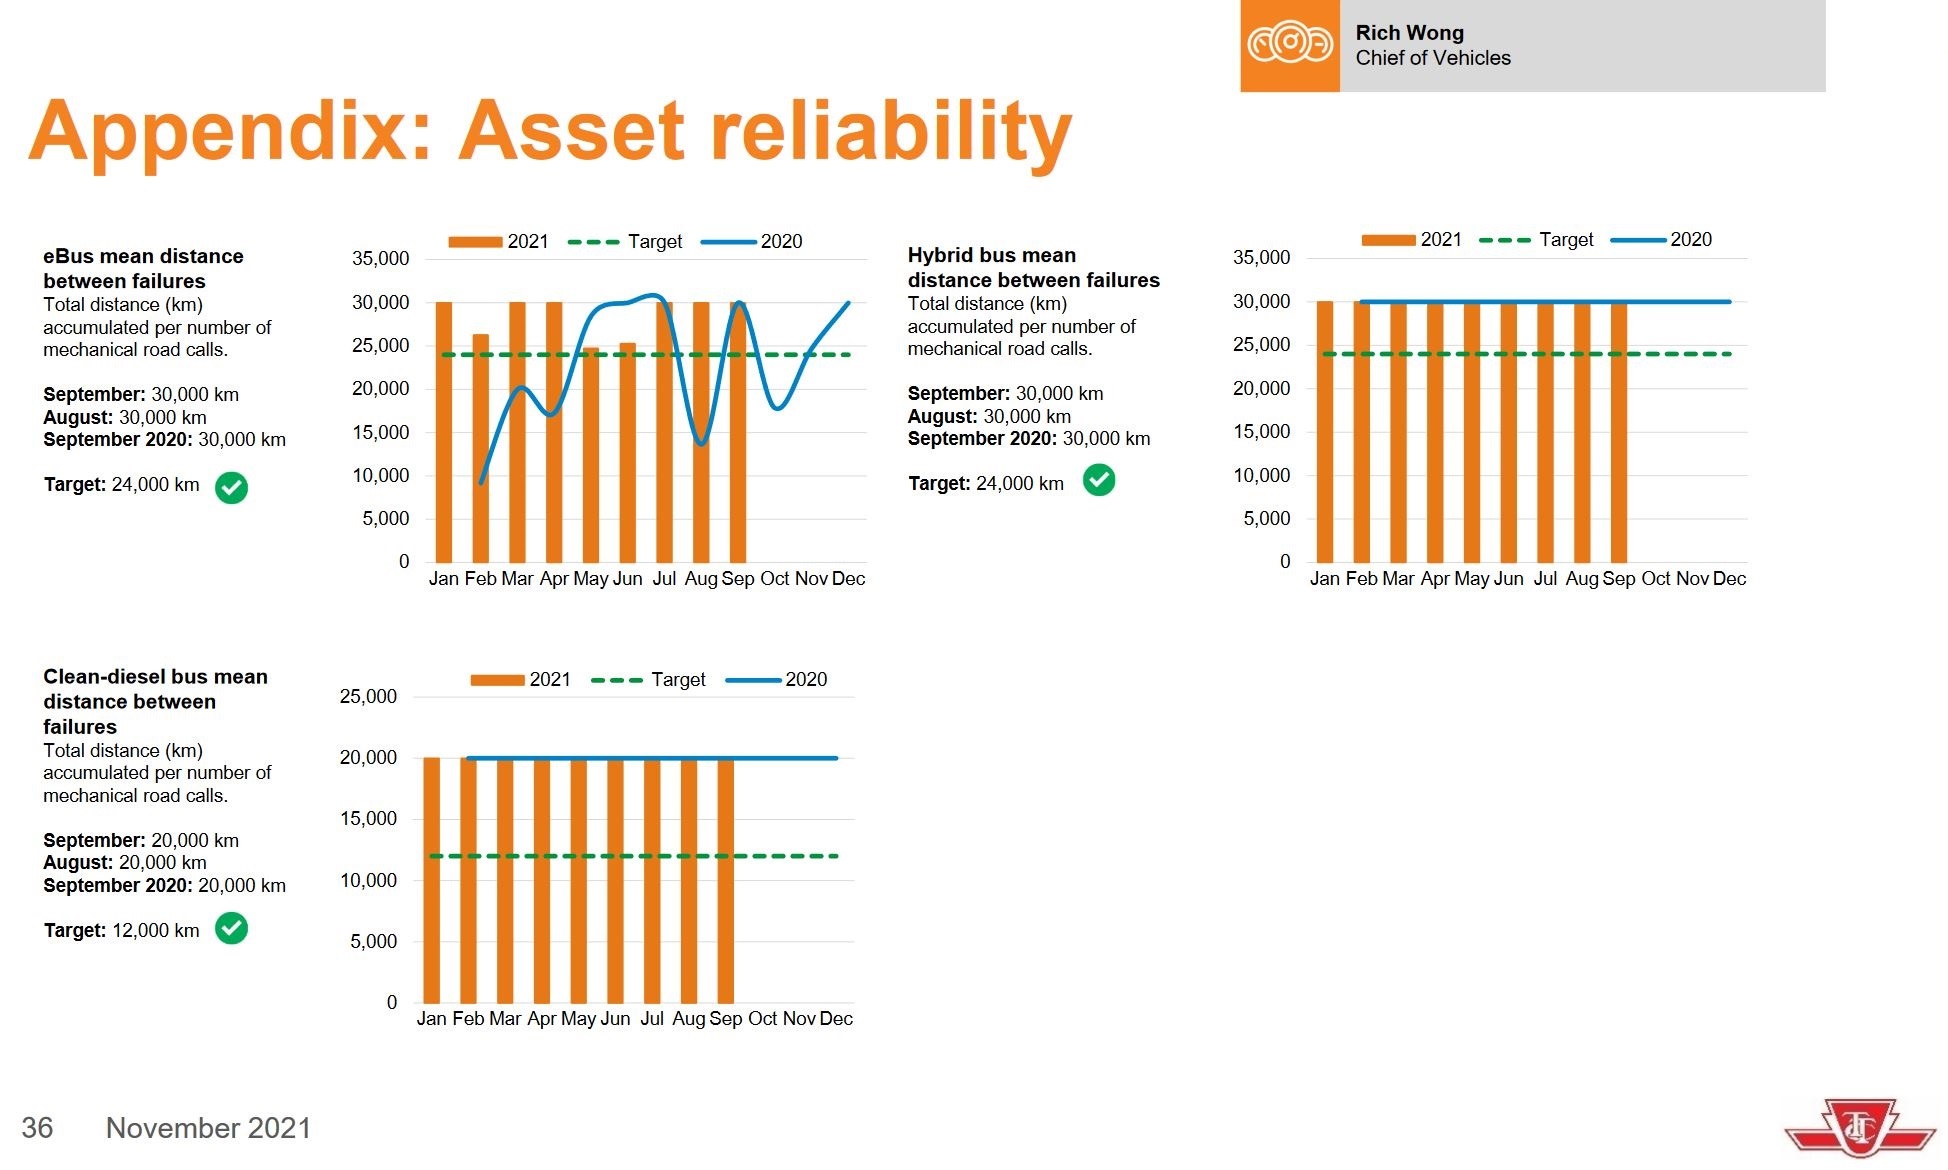
The TTC CEO’s Report includes stats on bus reliability measured as the mean distance between failures.
There are two major problems with these charts:
The values reported are capped, and we have no idea how far above the target lines the month-to-month values actually reach. If one class of buses is substantially more reliable, but this is not shown due to capping, then it is impossible to make a valid comparison.
Buses that never leave the garage do not contribute either to accumulated distance nor to breakdown counts. “Problem” buses could be sidelined because the TTC has lots of spares, and the stats for the working buses would make the group as a whole look better than it really is.
Methodology
In an attempt to get a handle on the actual use of the eBus fleet, I turned to vehicle tracking data. If a bus is regularly in service, it will appear in the tracking data, and it will not be simply sitting in a garage.
For this purpose, I used the trip tracking function on Darwin O’Connor’s TransSee website to find out where the eBuses spent their time for the past six months.
For comparison, I also pulled data for the month of September for 25 hybrid and 25 articulated buses. These buses date from 2018 and 2013 respectively.
From the trip reports, I extracted the vehicle number, date and time of the observation, and recorded the hours in which each bus was “seen”. Although this is vulnerable to missing tracking data (such as during the recent TTC cyber outage), any such effect is across the board and does not affect comparisons between vehicle types.
On a summary basis, each vehicle could be seen in 24 hour every day over the period. The number of observations is a broad indication of how much the bus is used. Also, the total number of buses used within a specific hour, broken down by type, shows the patterns of each fleet’s usage and the proportion of the fleet that was active during each hour.
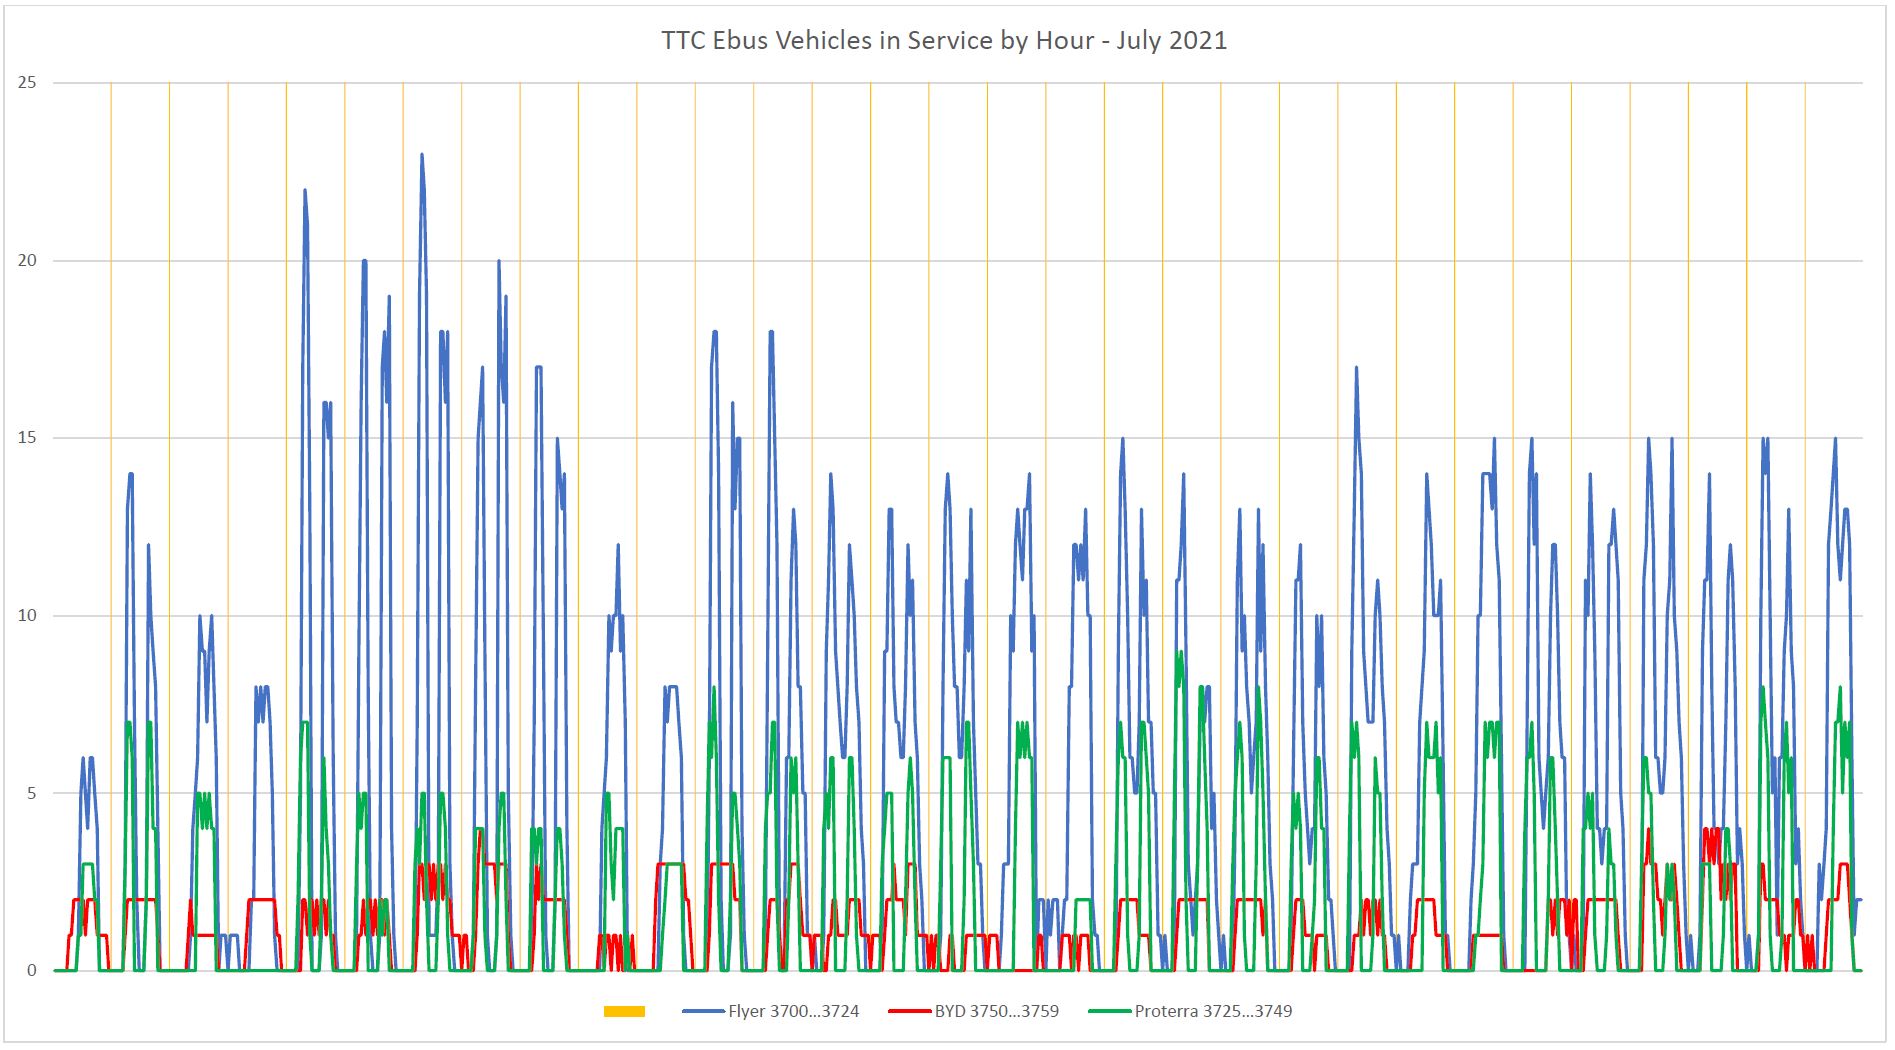
July 2021
Here are the data for July 2021. Each vertical block separated by yellow lines is one day. The data for each group of buses is colour coded.
A few points are quite obvious here:
The Flyer bus fleet was much more utilized than either the Proterra or BYD fleets, and at times over 80% of all Flyer buses were in service (20 out of 25). Proterra never fielded more than 9 of 25, and BYD never got beyond 4 of 10.
There is a distinct pattern of double spikes in the usage on weekdays which typically have a higher total number of vehicles. This shows that many (and on some days all) of the eBuses did not stay out through the midday, but returned to their garage. On weekends, usage of Proterra and especially BYD buses was very low.
At a time when TTC ridership is sitting at just under 50 per cent of pre-pandemic levels, this may not seem the time to ask a question like this article’s title. However, the service effects of an operator shortage are felt across the system and may not disappear soon.
The TTC puts recent service cuts down to vaccine hesitancy among a small group of staff. Leaving aside the internal union politics and the constant skirmishes between ATU and TTC management, there is more going on here.
At its meeting on November 29, the TTC Board received a third quarter financial update, and there was considerable praise for how management has “contained” costs shifting the year-end outlook to one where the TTC will not actually use all of subsidy monies available. In fact, $36 million will go into the City’s transit reserve where original budget projections forecast a draw, not a deposit. That’s money not being spent on transit, and moreover, it sets the bar lower for a starting point in 2022.
A big contribution to that saving is that the TTC is not scheduling as much service as it budgeted, and even then is not staffing at a level where all scheduled service actually gets onto the street. Cancelled runs and missing buses are common, and this problem continues even on the reduced schedules of November 21.
This situation is a complete reversal from past years when anyone who said “give us more service” received a stock two-part reply: we have no buses, and even if we bought more, there is no garage space.
The problem today is not buses – it is operators to drive them.
In this article, I turn the question around and ask how much service the TTC could provide if only they hired enough staff.
In Brief
The TTC has always owned substantially more buses than it requires to operate service. This is perfectly normal for any transit system, but the gap between what the TTC owns and what it operates widened over the past decade.
The proportion of the fleet that is “spare” (a word embracing many factors) has grown for two related reasons. Buses are more complex than they were a few decades back, and that affects maintenance work. Historically, the TTC aimed for a 18-year bus life cycle, but they are working toward a 12-year cycle to advance retirement of lower-reliability old buses and avoid the cost of major overhauls to keep them running. They have not yet reached that goal, and currently planned bus purchases do not fully achieve this.
One might argue that it says something about the robust nature of older buses compared to what we see today. To some extent, a shorter lifespan target can be a self-fulfilling prophecy when maintenance plans assume that a 12 year old bus will be discarded, and buses in what was once a middle age of 8-10 years are now seen as elderly.
There was a time when a ratio of buses in service to those held aside as spares was between 7:1 and 6:1, or a spare factor close to 15 per cent. By about a decade ago, this ratio fell to 5:1 or a 20 percent spare allowance. Since then, as a deliberate policy, the TTC has allowed it to fall to 4:1. There is no sign yet of a return to a better ratio. Two factors – a younger bus fleet and the benefits of electrification (partial or complete) – are yet to be reflected in the provision for spares. This affects not just capital costs – more buses are needed to provide a given level of service – but also the need for garage space.
In the pandemic era, the number of spares has risen considerably and the ratio is in striking distance of 2:1 thanks to recent service cuts.
If the ongoing cost of operating the TTC falls because of cutbacks, then the challenge to restore funding faces the double hurdles of cost inflation and a return to historic service levels both for operations and maintenance.
Turning back the clock can be difficult if a generous spare ratio becomes a “new normal” and buses can simply be sidelined rather than repaired. Even worse, if capital to buy new buses is plentiful, but operating funds to maintain the fleet are not, garages can fill up with vehicles that are tempting spare parts stores. This happened decades ago in Boston from which TTC CEO Rick Leary hails (but not on his watch).
Unpopular though this could be in some political circles, the TTC should ask the question: what service could we operate with the existing fleet if only we had enough money to hire drivers for all of the buses? Don’t tell Toronto what we “can’t afford”, tell us what would be possible and how much this would cost. This is a perennial problem with the TTC: a failure to advocate for the best we could have.
Among the projects discussed are several that relate collectively to the Bloor-Danforth Modernization Project (Line 2) that was originally proposed when Andy Byford was CEO. It was always a report that was “coming soon” to the Board, but after Byford’s departure, references to it vanished without a trace. I will return to the collection of BD Modernization projects later in this article.
A major problem for decades with TTC capital planning was that many vital projects simply were not included in the project list, or were given dates so far in the future that they did not affect the 10-year spending projections. This produced the familiar “iceberg” in City capital planning where the bulk of needed work was invisible.
The problem with invisibility is that when debates about transit funding start, projects that are not flagged as important are not even on the table for discussion. New, high-profile projects like subway extensions appear to be “affordable”.
There is a danger that at some point governments will decide that the cupboard is bare, and spending on any new transit projects will have to wait for better financial times. This will be compounded by financing schemes, notably “public-private partnerships” where future operating costs are buried in overall project numbers. These costs will compete with subsidies for transit operations in general. Construction projects might be underway all over the city, but this activity could mask a future crisis.
Please, Sir, I Want Some More!
The current election campaign includes a call from Mayor Tory for added Federal transit funding including support for the Eglinton East and Waterfront East LRT lines, not to mention new vehicles of which the most important are a fleet for Line 2.
The Waterfront East project has bumbled along for years, and is now actually close to the point where Council will be presented with a preferred option and asked to fund more detailed design quite soon. This is an area that was going to be “Transit First”, although visitors might be forgiven for mistaking the 72 Pape bus as the kind of transit condo builders had in mind as they redeveloped lands from Yonge east to Parliament. Some developers have complained about the lack of transit, and the further east one goes, the greater a problem this becomes.
The Eglinton East extension to UTSC was part of a Scarborough transit plan that saw Council endorse a Line 2 extension with the clear understanding that money was available for the LRT line too. Generously speaking, that was wishful thinking at the time, and Eglinton East languishes as an unfunded project.
For many years, the TTC has know it would need a new fleet for Line 2 BD. The T1 trains on that line were delivered between 1995 and 2001, and their 30-year design lifespan will soon end. As of the 2021 version of the 15 year capital plan, the replacement trains were an “unfunded” project, and the project timetable stretched into the mid 2030s.
City budget pressures were accommodated a few years ago by deleting the T1 replacement project from capital plans. Instead the TTC proposed rebuilding these cars for an additional decade of service. This would stave off spending both on a new fleet and on a new carhouse, at the cost of assuming the trains would actually last that long. The TTC has found out the hard way just what the effect of keeping vehicles past their proper lifetime might be, and that is not a fate Toronto can afford on one of the two major subway lines. The T1 replacement project is back in the list, but there is no money to pay for it.
Finally, a signature John Tory project is SmartTrack which has dwindled to a handful of GO stations, some of which Metrolinx should be paying for, not the City (East Harbour is a prime example). If we did not have to keep the fiction of SmartTrack alive, money could have gone to other more pressing transit needs.
When politicians cry to the feds that they need more money, they should first contemplate the spending room they gave up by ignoring parts of the network and by putting most if not all of their financial nest-egg into politically driven works. It does not really matter if Ontario has taken over responsibility for projects like the Scarborough Subway because one way or another the federal contribution will not be available to fund other Toronto priorities. The same is true of the Eglinton West LRT subway.
Any national party could reasonably say “we already helped to pay for the projects you, Toronto, said were your priorities”, but now you want more? A related issue for any federal government is that funding schemes must be fitted to a national scale, and other cities might reasonably complain if Toronto gets special treatment.