
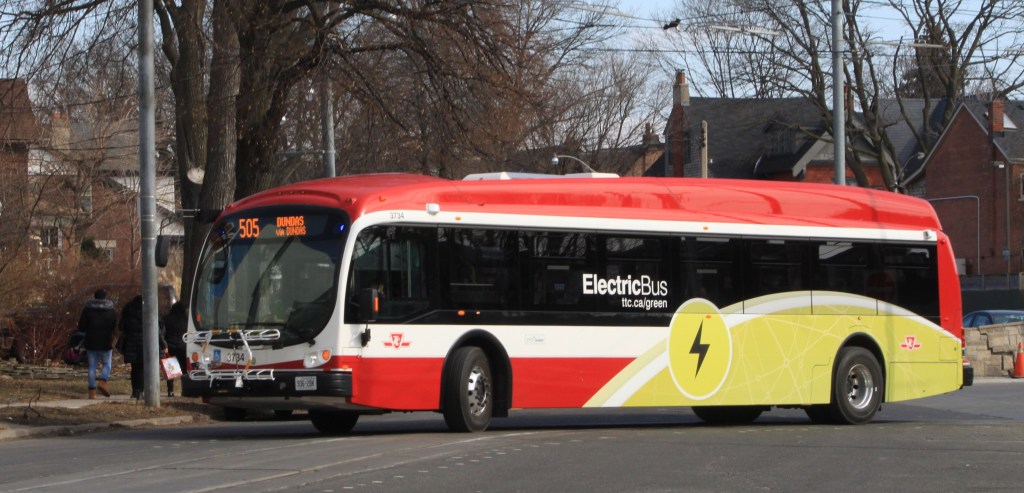
At its coming meeting on April 14, 2021, the Toronto Transit Commission will consider two reports that, if adopted, will begin a transition to an all-electric fleet over the coming decades.
- TTC’s Green Bus Program: Preliminary Results of TTC’s Head-to-Head eBus Evaluation
- TTC’s Green Bus Program: TTC-OPG-THESL Framework for Agreement on Electrification Infrastructure
Although the first report’s title suggests that this is simply an update on the trial of 60 eBuses now in progress, in fact the report includes recommendations for eBus purchases:
The Board delegate authority to the TTC CEO to undertake a public procurement through issuance of a Negotiated Request for Proposal (NRFP) and enter into up to two contracts for the supply of approximately 300 long-range, battery-electric buses (eBuses), based on the following:
a. Limit the total contract award amount, including all applicable taxes, and project delivery costs to within the approved funding of approximately $300 million;
b. Apply lessons learned through the TTC’s eBus Head-to-Head Evaluation to pre-qualify potential suppliers based on demonstrated compliance with system compatibility requirements and Transport Canada’s Motor Vehicle Safety Standards;
c. All 300 eBuses to be delivered between Q1 2023 and Q1 2025; and
d. Negotiation of an acceptable agreement that is satisfactory to the TTC General Counsel.
Procurement
The TTC plans a split contract to two vendors. Based on experience to date, this would seem to guarantee work to New Flyer Industries [NFI] but a second vendor is a more difficult question.
The TTC raises important caveats:
When reviewing this report, it is important to understand that the findings are specific to the eBus models procured, and to how those buses have performed in the TTC’s operating environment. As a result, the findings of this report may not be applicable to other transit authorities. Further, as the results are preliminary, we expect that action plans across all vendors will result in improvements to vehicle and vendor performance that will be reflected in our next report on the eBus head-to-head evaluation in Q1 2022.
As well, new eBuses offered by BYD, NFI and Proterra are expected to address system compatibility issues, which for the TTC will be critical for the successful adoption of this technology.
Eventually, TTC management has to qualify or disqualify each would-be vendor, but clearly we are nowhere near that point.
Under normal circumstances, the TTC would have an open bid on which any vendor could make an offer. An invited bid creates a process where we must trust that no untoward influence occurs. Considering the unseemly way in which BYD elbowed its way to the table through lobbying and a direct sales pitch to the Board in the guise of a “deputation”, a closed process could be subject to challenge depending on who is invited to bid, and who is excluded.
It is totally unclear why management seeks authority to negotiate a contract at this time when the head-to-head comparison has a year still to run and the vendors might, or might not, correct performance problems in the meantime. Conversely, none of the vendors in the trial has a vehicle that comes close to meeting the performance of the hybrid fleet.
Assuming that Nova Bus, a major Canadian supplier whose vehicles were not in the trial, is asked to bid, it will be interesting to see what types of vehicle they will offer. The TTC plans to pre-qualify bidders based on experience in the trial, and it is hard to understand how, within this constraint, Nova Bus would be invited unless the TTC uses experience from other properties as a reference.
One expected outcome of converting to eBuses is that by 2040:
Vehicle reliability and availability will have increased by an estimated 25%
It is not clear what the base for this improvement is. Is the TTC including its aging diesel fleet in the baseline, or speaking relative to the hybrids already in operation?
Aside from transparency, the results to date raise another key issue. Suppose that eBuses simply do not attain the performance and reliability we have come to expect from transit buses. Do we embrace the technology in the hopes that it will catch up and for the larger “green” agenda, and will we provide adequate budget to the TTC to handle the extra cost of ownership?
Throughout the evaluation report, there are many points under the heading “Lessons Learned”. For readers’ convenience, I have consolidated these in one document. They show just how many topics require a hard-nosed negotiating position by the TTC together with credible vehicle performance data.
There are few surprises, but clearly the TTC intends to go into this bus procurement cycle with is eyes open. Many of these lessons depend on work still underway as part of the trial making the delegation of purchase negotiation authority to staff at this stage even more troubling.
Quite bluntly, the proposed procurement process does not make sense and leaves Toronto open to being saddled with less than ideal vehicles. The authority to negotiate a purchase should be deferred until the results through 2021 are known, and the eligibility (or not) of Nova Bus as a potential supplier is clarified.
Fleet Planning
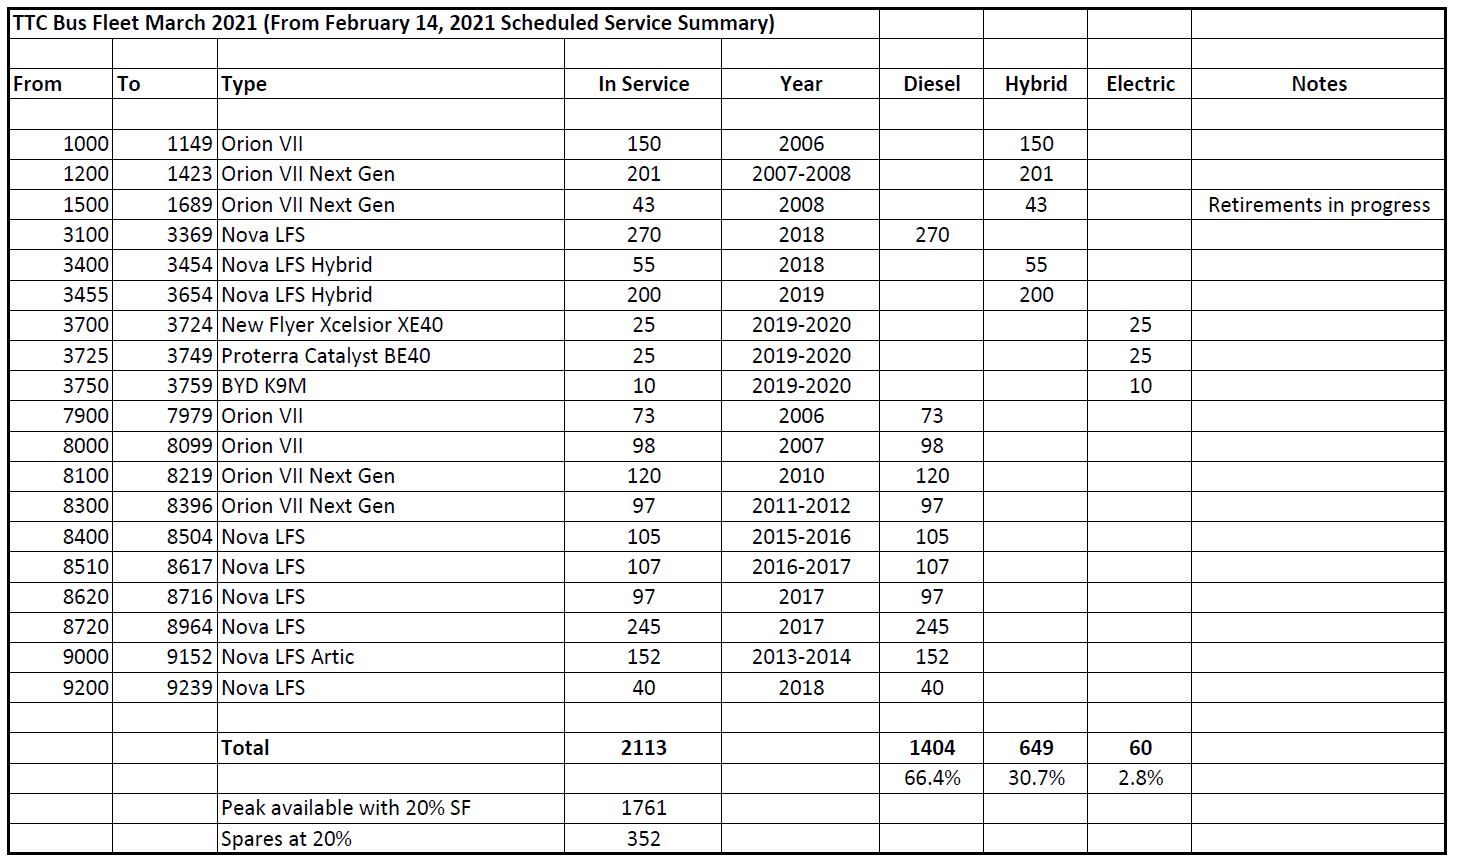
Updated April 10 at 8:20 pm: The original table of buses incorrectly showed vehicles 1000 to 1689 as diesels when they are, of course, hybrids. This is corrected below.
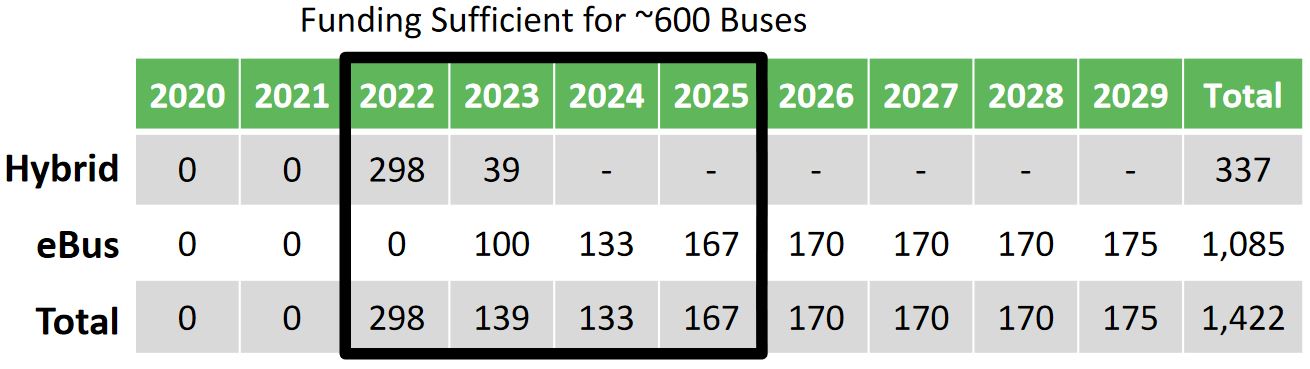
The TTC is not prepared to completely switch its purchases to eBuses because the technology is not yet mature. Purchase of 300 hybrid Electric Vehicles (HEVs) was authorized by the Board in October 2020. Together, the orders would allow eBus and HEV technology to displace about forty percent of diesel fleet where many buses are near end of life.
What is not clear is the proportion of net new vs replacement vehicles in the 600 bus procurement, nor of the amount of additional service that the refresh of the fleet on this scale will represent. As I write this article, I await the TTC’s provision of an updated fleet plan showing the overall fleet size, service allocations and maintenance spare factors for coming years.
The current bus fleet numbers 2,113 vehicles of which 1,404 are diesels.
The purchase calendar for new buses in the October 2020 fleet plan shows that the TTC anticipated more than 600 buses in the coming five years, but the number is capped by available funding.
Over recent years, the TTC increased its spare factor in response to dropping vehicle reliability and increased technical complexity. A tactic to offset this was to shift from an 18-year to a 12-year replacement cycle so that buses are retired before they reach an age where maintenance needs rise and reliability drops. This has an obvious effect on capital budgets, and that is compounded by the current premium paid for electric buses compared to diesels.
An important part of buying new buses and a new technology is the hoped-for improvement in vehicle reliability and availability. This would mean that the size of the fleet needed to provide a given level of service would go down. For example, if the spare factor is 20%, then a 120-bus fleet is required in order to field 100 of them in peak service. If the fleet overall becomes more reliable and the spare factor can be lowered, this translates to savings in both capital and operating costs.
Conversely, if new eBus technology cannot achieve a spare ratio equivalent to the existing diesel and HEV fleet, then more buses are needed just to provide the same service. This will be affected not just by reliability factors but by the capacity for charging vehicles that could remain in service through the day. If buses must be scheduled for garage trips simply because they will run out of power, that represents non-productive mileage and driver hours that add to fleet size and operating costs. (An alternative is on-route charging, but the TTC has not yet discussed that option in detail.)
With the shift to HEVs and eBuses, the premise that a bus should only be retained for 12 years may no longer be valid, but it will be at least a decade before we know if the new propulsion technology translates to long-term reliability and a longer replacement cycle. Past experience with trolley buses suggests that eBuses should last longer, but other factors including the robustness of bus bodies and the pace of technology change in the propulsion systems might work against this.
A more subtle problem can arise if a fleet is larger than needed to achieve the target spare factor for an extended period. Surplus “problem” vehicles might be sidelined rather than kept in working order. An organization can reach a point where a larger spare pool becomes part of the maintenance culture and a return to the target level is not as simple in practice as in theory.
For a fleet of 2,113 vehicles a 20% spare factor should allow a scheduled peak service of about 1,761 buses. The peak requirement in May 2021 schedules is about 1,500. Similarly, a streetcar fleet of 204 should allow peak service of 170 vehicles. Whether the TTC will achieve this by the end of 2021 when major overhauls are completed and construction projects affecting streetcar routes will all wind down remains to be seen. Buses now operating on streetcar routes are included in the peak service count, and they would be available for redeployment to bus routes.
This is an issue for the TTC as it moves out of the pandemic era: despite its large fleet, how many vehicles are actually available for service? Do vehicle purchases perpetuate a higher spare ratio? Is the service offered limited by actual vehicle availability, by the number of drivers the TTC hires, or both?
Comparing eBuses with Hybrid Bus Performance
Over the course of testing their 60-vehicle fleet of eBuses, the TTC used its existing Nova Bus hybrid fleet as a comparative benchmark. Despite problems with early generations of hybrids, reliability of recent purchases has been quite good. If an eBus cannot at least match this reliability, this has grave implications for service planning and ongoing costs. It is all very well to be “green”, but a bus in a garage for extra maintenance work chews up funding that could be better used to serve riders.
A very high level comparison of the four fleets for four key criteria appears below. There are many other factors in the evaluation, but these are considered essential. Of the three eBus vendors, only New Flyer avoids the “Needs Improvement” flag in this key group.
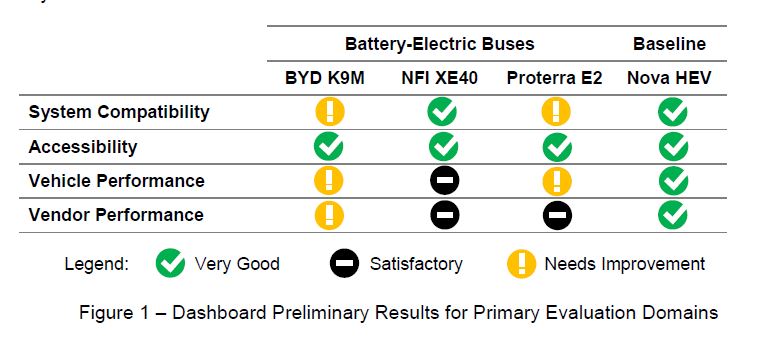
Note that Nova Bus was not part of this trial because they did not have a “long range” vehicle capable of extended service when the TTC issued its RFQ.
When the TTC procured its eBus fleet, Nova Bus did not offer a long-range battery electric bus. However, it is now building on its experience with HEVs and opportunity charged battery-electric buses to offer a long-range bus starting in 2022.
For clarity, “opportunity charging” refers to the use of charging stations installed along routes where buses can recharge “on the fly” using a pantograph to link to an overhead power feed.
Operating Stats and Evaluation Summary
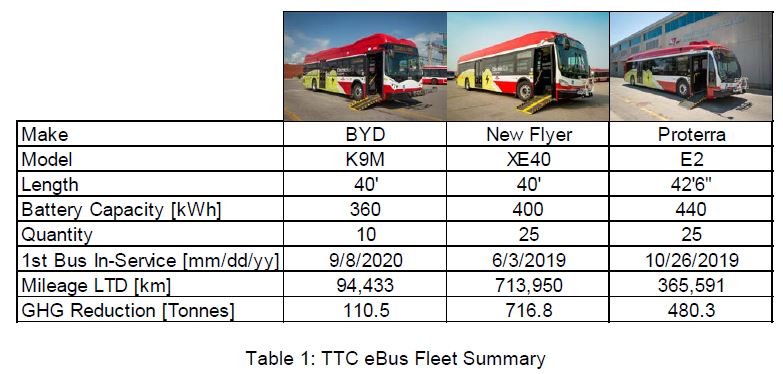
Here are the operating stats for the three eBus fleets.
Of the three fleets, BYD’s has the least accumulated mileage because of late vehicle delivery. Some of that fleet has still not passed TTC acceptance testing (this also applies to Proterra, but with a lower proportion of the fleet).
Evaluation of the eBuses has been done within nine “domains” and several subdomains.
- System Compatibility
- Accessibility
- Customer Experience
- Operator and Maintainer Experience
- Maintainability
- Vendor Performance
- Charging System Performance
- Vehicle Performance
- Total Life Cycle Cost
The overall results are in the table below. Note that all lines do not have the same importance, and so just counting “green ticks” is not a measure of how good a vehicle is. However, a large number of yellow “Needs Improvement” ratings is cause for concern.
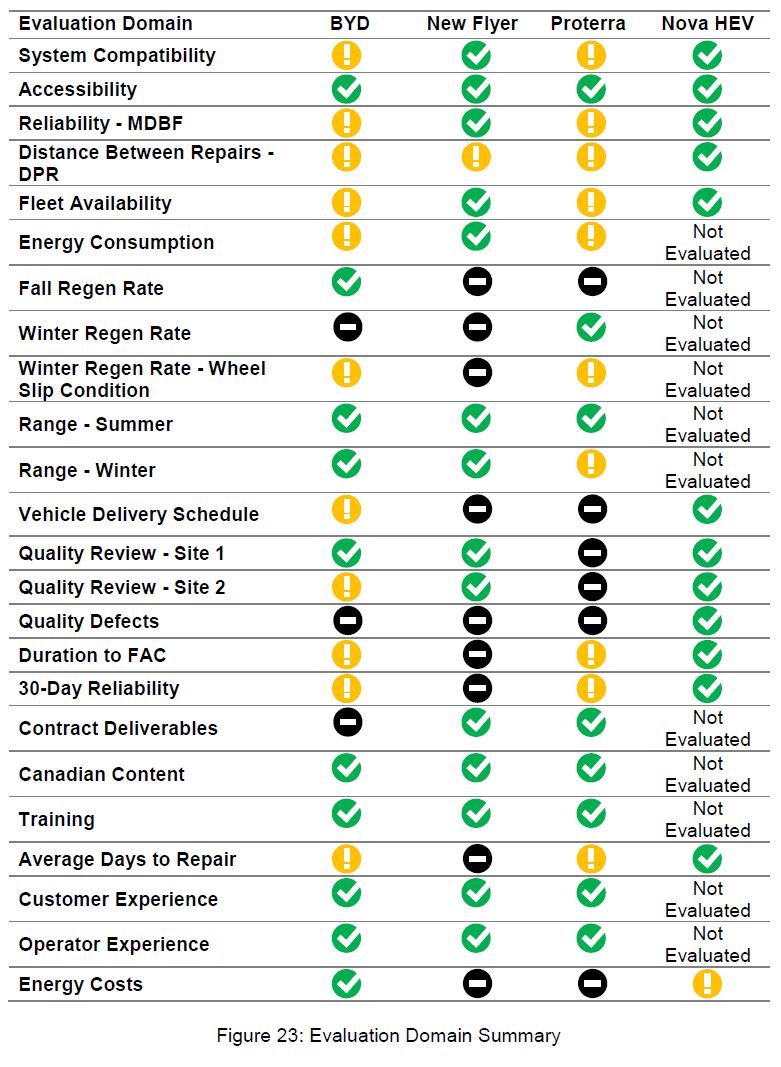
The TTC succinctly notes:
In summary, of the three eBus vendors, only NFI and its eBus has delivered at or above the performance required.
Work on eBus evaluations is underway at many agencies, and the TTC chairs a bi-monthly call among them. This includes both agencies in the GTHA as well as many of the largest systems in the USA.
The TTC’s evaluation matrix for buses above is considerably more detailed than we have seen in the past, and clearly reflects a more subtle, detailed review of factors affecting vehicle suitability for operation in Toronto.
The report includes a lot of duplicate text between the technical section of the main report, and Appendix A beginning on page 28. The analysis below is based on the Appendix.
Power Supply and Charging
With the shift to electric bus operation, the TTC will go through a major upheaval in propulsion technology and electric power requirements. Although it was once a system almost entirely run with streetcars, the TTC today is a much larger system geographically, and power requirements for vehicle charging at garages are very different from those of a streetcar or subway network that consumes electricity where and when vehicles operate.
A very substantial infrastructure for charging is required at TTC’s bus garages as the fleet migrates from diesel to electric power. Some of this is on site (charging stations, power distribution and a substation), and some lies in Hydro’s distribution network depending on the availability of power close to each garage. The total for costs at garages is estimated at $500 million.
There are several components, and the responsibility for each is shown in the chart below.
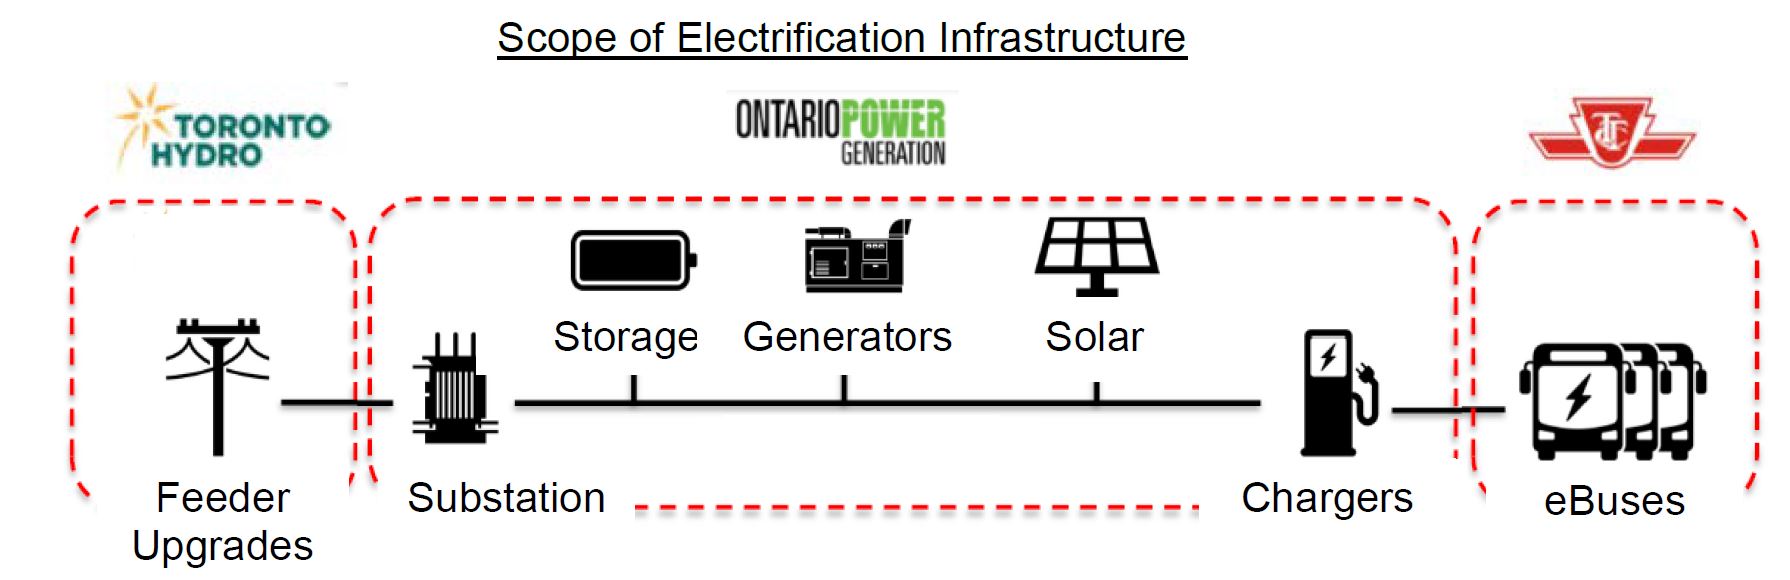
In this scheme, Toronto Hydro will be responsible for upgrading its feeder network to bring power to TTC sites. Ontario Power Generation will build, own and maintain the on site facilities with financing jointly from the TTC and OPG. The TTC will only be directly responsible for the buses.
Various “bundling” arrangements were considered, and the selected one places the onus for most work on the Hydro companies leaving the TTC mainly as a consumer.
Detailed Vehicle Evaluation
System Compatibility
Any new buses must be “compatible” on three key counts:
- They must be a standard size to fit within the design of existing garages.
- They must use standard, proven charging technology that supports vehicles from any manufacturer.
- They must have a corrosion-resistant frame structure for operation in cold climate where de-icing agents (e.g. salt) are present.
Proterra fails on the size criterion because its nominally 40-foot bus is actually 42.5 feet long. This affects garage capacity and creates challenges for drivers who are used to the behaviour of and clearances for standard-sized vehicles.
BYD fails on the charging technology because it uses a proprietary charging system. They have developed a bus using the SAE (Society of Automotive Engineers) industry standard, but there is “insufficient service history” according to the TTC report.
Existing suppliers to the TTC, Flyer and Nova Bus, build vehicles with stainless steel frames. This became a standard some years ago after the TTC, among others, had very poor experience with other materials and designs. Proterra’s bus is a fibreglass composite, but BYD uses carbon steel that requires annual rust-proofing, a process that presents operational and safety problems at garages.
Accessibility
All buses must meet CSA and AODA accessibility standards, and all vehicles in the trial do so. In consultation with the TTC’s Advisory Committee on Accessible Transportation (ACAT), additional design tweaks were identified and these will be incorporated into specs for any future purchase.
Although this is one of the four key criteria, it is one that all vendors meet and, therefore, makes no distinction between them.
Vehicle Performance
For the trial, performance measures began from the point where each vehicle entered service. This includes several factors:
- Reliability: This is measured as the Mean Distance Before Failure (MDBF) where “failure” is defined as a fault that forces the vehicle to be removed from service.
- Distance Between Repairs: A more subtle way of looking at performance is the distance between repairs. All faults do not cause a service interruption, but they do cause a bus to be unavailable for service while it awaits maintenance.
- Fleet Availability: This measures each fleet’s availability when needed, and is analogous to the spare factor discussed earlier. For the trial, the TTC set a target of 80% availability which corresponds to a 25% spare factor.
- Work Order Defect Analysis: Which type of repairs were needed for each type of bus. Some repairs can be done quickly, while others require more time keeping a vehicle out of service longer.
- Energy Consumption: How much power does each type of bus consume, how do battery systems perform, and how much power is recovered from regeneration?
Reliability (MDBF)
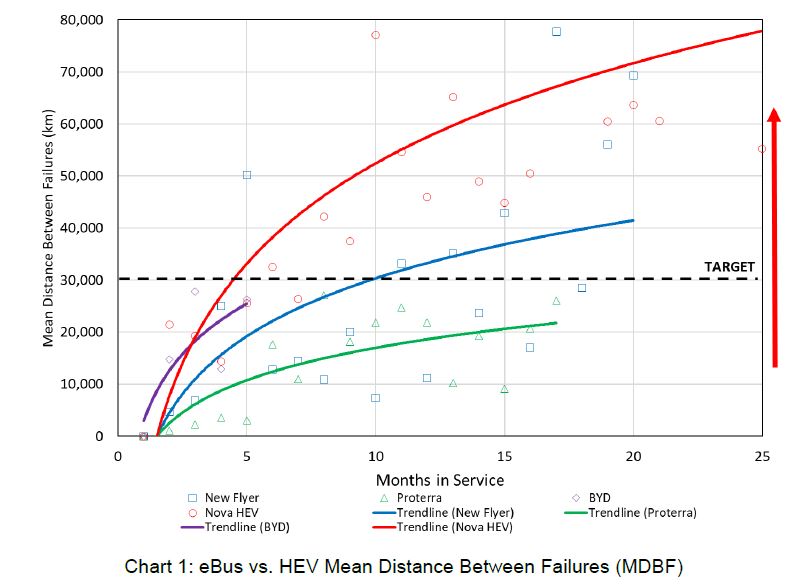
A commonly-cited measure of vehicle reliability is the Mean Distance Between Failures which is simply the total vehicle mileage divided by the number of failures requiring a bus to be withdrawn from service. Loosely speaking, this equates to the frequency of in-service breakdowns and the need to send out change-offs (replacement buses).
The results are summarized in the chart below. It is common for these values to ramp up after vehicle delivery as initial bugs are worked out, and this pattern can be seen for each type of vehicle. Although the target is 30,000 km, both the hybrid Nova Bus and the New Flyer eBus have passed that line with the hybrids hitting very high values two years into their life. Whether these values remain at a plateau or drop off as vehicles age remains to be seen, and these may not be representative of life-cycle experience.
Because BYD vehicles have only been in service a short time, there is less data and it is not clear where their reliability will top out. Currently both BYD and Proterra are below the target level.
Distance Between Repairs
On road failures do not tell the whole story because a bus can develop problems that allow it to remain in service, but then consume substantial resources to fix holding the bus out of service. The DBR values are much smaller for all vehicles than the MDBFs:
- Nova Bus Hybrid: 948 km
- New Flyer: 482 km
- Proterra: 359 km
- BYD: 202 km
These numbers are troubling because they represent only a few days’ service assuming an average speed in the 15-20 km/hr range in the middle of the range. This is a problem for all of the eBuses, especially BYD’s. [See also the “Maintainability” section later in the article.]
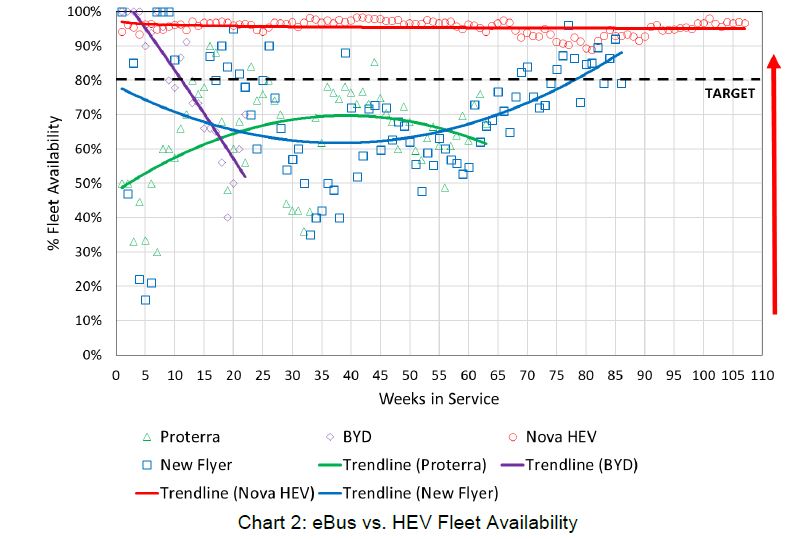
Fleet Availability
There is little point in having a fleet of any kind if the buses cannot leave the garage. This is related both to failure rates, and the time needed to make repairs. Results for the fleets are shown below. The New Flyer eBuses had problems during their first year, but have been trending upward for some time. Proterra never reached the 80% target, and BYD stats are in free-fall.
Challenges impacting vehicle availability with respect to buses from BYD and Proterra include complex propulsion system faults, parts unavailability and long lead-times, insufficient vendor resources on location and lengthy bus retrofit campaign work.
Work Order Defect Analysis
The type and number of defects varies by bus type. The chart below gives a breakdown, but the base “N” against which the percentages are calculated is not shown. It is noteworthy that the majority of problems in all cases has nothing to do with the propulsion and charging systems. This speaks to the need for bus builders to be more than packagers of technology.
Many of the problems have been rectified since vehicle delivery, and so this is not necessarily representative of a mature fleet. [Read the report starting on p. 34 for details.]
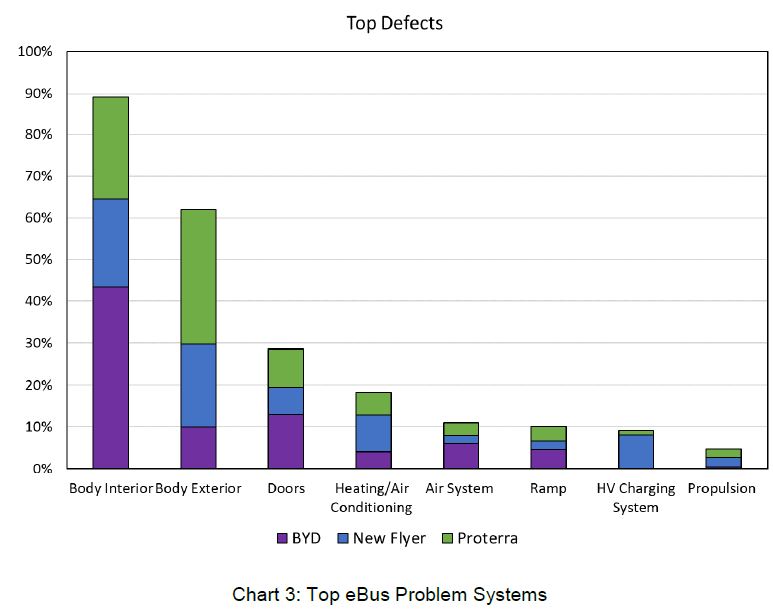
The bus bodies from BYD and Proterra are also a concern to the TTC.
- In the case of Proterra, the carbon-fibre-reinforced composites will eliminate most corrosion, but their behaviour under northern temperature extremes is yet to be determined. Some “spider” cracks have appeared, but it is not yet known if these are superficial (in the surface coat of the buses) or structural.
- The carbon steel frame of BYD buses is a technology TTC avoids because of past experience with corrision, The report notes that there are problems with application of anti-corrosion coating, and that it will take many years before the TTC knows if this treatment is actually successful.
- “The corrosion prevention system used by BYD does not dry completely and requires several days before the inhibitor stops dripping. As a result, buses must be kept out of service for three-to-five days. Further, while the rust inhibitor is environmentally friendly, it drips onto the garage floor presenting a slip hazard in the storage areas.”
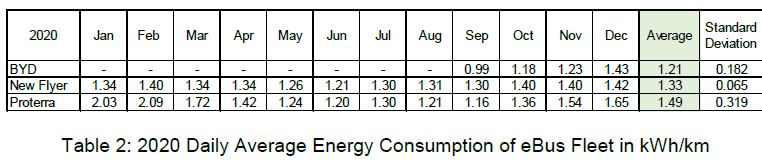
Energy Consumption
The rate of energy consumption varies substantially depending on vehicle load, driving conditions, weather, route topology, and driver behaviour. All of these affect the length of time a bus can run without recharging, and in turn this affects service design particularly if the TTC does not provide on-route charging stations to “top up” batteries without returning to the garage.
Power consumption by each fleet for 2020 is shown in the table below. Note that these numbers represent pandemic conditions for much of the year and therefore will understate power needs under full load and with greater traffic congestion. Although values for the BYD fleet look good in early months, the standard deviation of values is largest for these buses, and their lower average may not be sustained. What this table does not tell us is the routes where these buses ran and whether the number represent an “apples-to-apples” comparison.
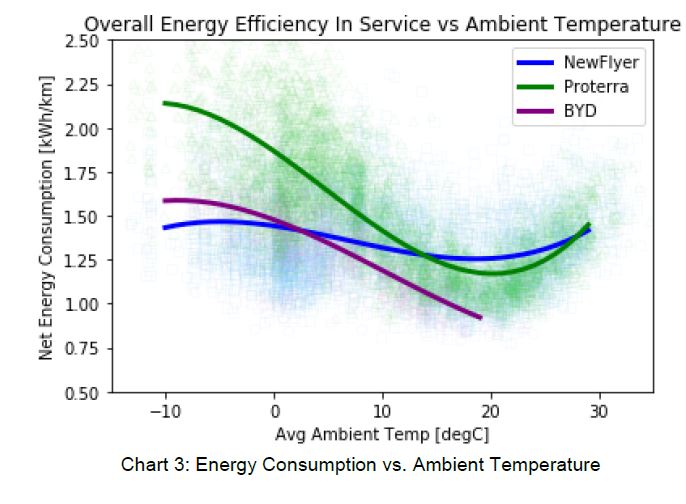
Energy consumption goes up in cold weather due to the need for vehicle heating and more difficult driving conditions. On Proterra buses, an electric heater is used for windshield defrosting which is less efficient than the design on other buses, and this source also heats the operator compartment at a cost of up to 10 kWh of energy that is not available for propulsion.
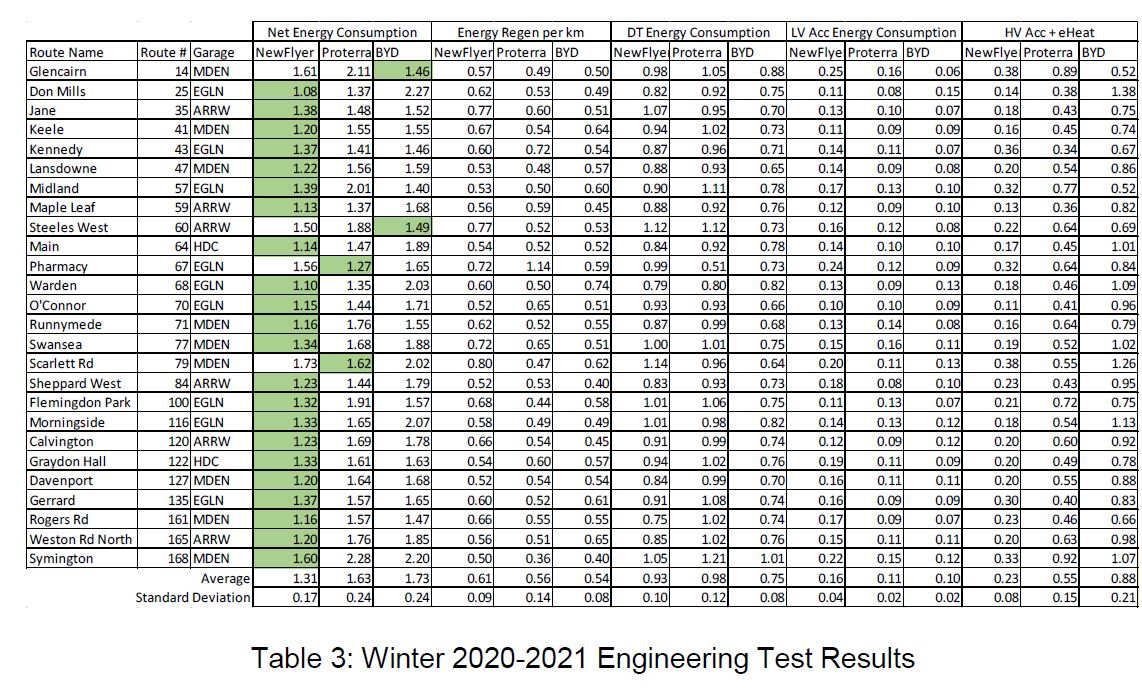
The TTC conducted controlled tests with one eBus from each fleet operating identical trial runs on many routes. Each bus was loaded with 9,000 pounds of ballast (roughly 60 passengers at 150 pounds average), and driven three laps over each route to collect performance data. This was done both in the fall and winter seasons with results shown in the tables below.
Cold temperatures and snow and ice conditions require the vehicles to expend more energy by way of heat and traction power. To mitigate this, the TTC’s eBuses are equipped with auxiliary diesel heaters to minimize battery consumption. This will continue to be the TTC’s requirement moving forward until heat pump technology develops into a viable alternative.
The overall averages for New Flyer are similar during both seasons, but are much higher for BYD and Proterra during the winter trials. The differences lie mainly in heating load powered from batteries, and in a lower proportion of drive train energy recaptured by regenerative braking in that season (as discussed in the following section).
The energy consumed by the auxiliary diesel heaters is not included in the tables below.
| Net Energy Consumed (kWh/km) | New Flyer | Proterra | BYD | |||
| Fall | Winter | Fall | Winter | Fall | Winter | |
| A: Drive Train (Net) | 0.85 | 0.93 | 0.87 | 0.98 | 0.64 | 0.75 |
| B: Low Voltage | 0.12 | 0.16 | 0.10 | 0.11 | 0.07 | 0.10 |
| C: High Voltage + Heat | 0.37 | 0.23 | 0.21 | 0.55 | 0.43 | 0.88 |
| Total = A+B+C | 1.35 | 1.31 | 1.17 | 1.63 | 1.14 | 1.73 |
| Fall/Winter Variation | 3% | 40% | 51% | |||
| D: Regen | 0.64 | 0.61 | 0.69 | 0.56 | 0.71 | 0.54 |
| % Regen (D)/(A+D) | 43% | 39% | 44% | 36% | 53% | 42% |
Note that the power consumed by auxiliary systems such as lighting and heating is more related to the time the systems are active, not to the mileage travelled. Buses on faster routes will consume less power/km to light and heat a vehicle because it travels more kilometres in one hour. This is a common problem in operating cost analysis where only some costs vary primarily by distance, while others (e.g. driver wages) vary by hour, and some (such as daily servicing) are a fixed cost/vehicle.

Regenerative Braking
Regenerative braking in one form or another has been used on electric vehicles for a very long time. A major advance in the development of the PCC streetcar in the early 1930s was that the motors were used as generators during braking, although this power was simply dumped into an onboard bank of resisters used to heat the cars. Night service was notoriously cold because cars did not stop often enough to generate heat through this technique. Subway cars starting with the M-1 series on University Avenue in the 1960s used the same tactic.
As power control systems moved to solid state electronics, the option of pushing power back into the line allowed true regeneration so that braking energy from one streetcar or train (or trolleybus) could power other vehicles in the same power section. On battery vehicles, the regenerated power goes back into the batteries. (Note that this is a highly simplified description to illustrate the technology’s evolution.)
Regeneration requires the wheels to maintain contact with road or rails so that the braking effort through the wheels actually generates power. A vehicle that is in a slide generates no power at all.
The software that controls the New Flyer buses appears to be better at managing winter conditions and keeping regeneration levels close to those in fair weather.
Under slippery winter road conditions, regenerative braking is automatically disabled whenever wheel slip is detected. As a result, there is a significant reduction in regenerative braking experienced. The Proterra and BYD fleets experienced the largest reduction at 32% and 27% respectively.
This phenomenon is deemed to be a safety risk and needs to be considered when training operators, charging buses, planning for service and dispatching.
To mitigate this risk, Proterra released an updated braking and traction control system software calibration in February 2021 that is currently under evaluation. The TTC is also evaluating the benefits of using winter tires. Results of both evaluations will be shared in future program updates.
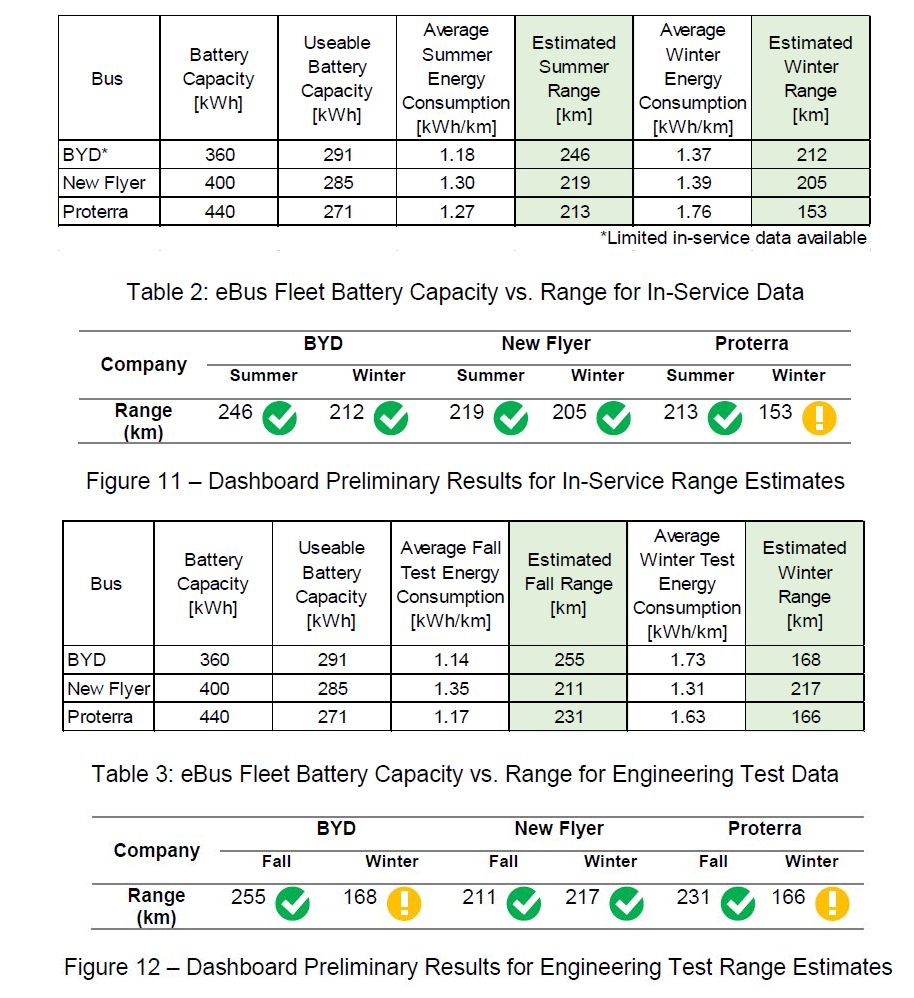
Battery Capacity and Range
Bus manufacturers typically quote their battery capacity in terms of the total energy it can store. However, as the TTC describes, this does not tell the whole story.
With over a million kilometres of in-service data accumulated to date, it is clear that the useable battery capacity differs significantly from the advertised values. To optimize battery health and vehicle performance over the lifetime of the bus, the accessible energy in a battery pack is limited to provide a more consistent and predictable energy draw over its lifetime.
If a battery is regularly discharged and charged to 100% of its total capacity, it will degrade faster over time, resulting in a faster-than-expected decline in range over the vehicle’s lifetime. While each OEM may limit the usable capacity differently, this principle nevertheless applies across all battery-electric vehicle manufacturers. Useable battery capacity should therefore be used to estimate range for planning purposes.
Real-life data from operation of the vehicles is summarized below both for in service operation and the engineering tests. Data for BYD is limited by the small fleet and, possibly, by the characteristics of routes on which these buses ran during the data collection period.
According to the report, Proterra is most conservative in limiting battery use to prevent full discharge. They are preparing to increase useable battery capacity by 6% that will result in increased range”.
Even at a 200+ km range for one charge, buses will not be able to remain in service for a 20-hour day and must be scheduled accordingly. (The alternative, on-route charging, is not yet part of the TTC’s plans.)
Vendor Performance
Several aspects of vendor performance differ between the three fleets.
- All of the eBuses were late to the original schedule, but BYD were by far the worst at 186 days. New Flyer eBuses were 41 days late, and Proterra’s were 62 days late.
- Audits of manufacturing facilities covered numerous criteria. The review included both plants in Canada and elsewhere (China for BYD, the USA for others). Only the BYD plant in Newmarket got a failing grade. The TTC is particularly sensitive to manufacturing issues given their experience with the Bombardier streetcar fleet.
- Quality defects appear when vehicles are delivered and being commissioned for service. Repair is handled by the vendor, but while this goes on, the vehicles are not available for service. The highest number of defects (44) were in the BYD fleet. This is particularly high on a per-vehicle basis with only 10 buses. Flyer and Proterra (at 34 and 41) each delivered 25 buses. This problem ties in with manufacturing quality issues.
- Those defects also affect the duration between vehicle delivery and final acceptance which, for BYD, was about eight months.
- “Nova required on average of 50 days to achieve FAC. BYD took on average 242 days, with the delays largely attributed to excessive lead-time for parts and lack of local resources to repair buses. Proterra took on average 136 days, with the delays generally a result of insufficient resources on site due to COVID-19. NFI took on average 94 days, with the delays partially attributed to charging defects.”
- 30-day reliability is a measure of how a bus performs after it is accepted. A bus must operate for 30 days without a failure covered by the warranty to obtain final acceptance. The time required for each vendor varied a great deal.
- Nova required 38 days;
- NFI required 64 days;
- Proterra required 113 days (one bus remaining to achieve target); and
- BYD required 160 days (three buses remaining to achieve target).
- Contract deliverables include parts and maintenance manuals, test reports, part application approvals and drawings. New Flyer and Proterra are at or above 90% on this metric, while BYD sits at 70%.
- Canadian content of at least 25% has been achieved by all vendors. The degree to which any of them exceeds this threshold is confidential.
- Training: Delivery of training either in person or online is rated acceptable for all vendors.
Charging System Performance
Two separate charging systems are in use with BYD having its own proprietary system and the other vendors using an industry standard. Although both systems performed acceptably, the TTC intends to specify a standard system for all future buses to allow for interoperability between garages.
As noted earlier, BYD has developed a bus that uses the standard charging system.
Customer Experience
Two customer surveys are underway to gauge rider attitudes to the eBuses both for “what works best for riders and what needs improvement”. The areas to be covered by the short form survey are:
- Ride comfort/quality of the bus
- Seat comfort
- Seating layout of lower area
- Seating layout of upper area (beyond the rear door)
- Rear exit door size
- Interior noise levels
- Lighting levels of the bus
- Exterior styling of the bus
A long form survey includes:
- Standing capacity vs. seating capacity
- Flip-up vs. fixed seating
- Aisle vs. forward facing seating
- Seat construction preferences
- Personal device stowing
- Stop request button vs. pull cord
These surveys will not report until late in the trial period.
A final survey will be conducted with a customer focus group riding on buses. This is obviously subject to whatever constraints on gatherings will be in place at the time and the level of crowding bus riders considerable tolerable by then.
Operator and Maintainer Experience
As with riders, the TTC is also surveying its staff. Many factors under this category relate to the driver’s experience, but maintainability has already been scored based on experience to date.
- Ride quality
- Visibility
- Ergonomics,
- Acceleration
- Steering and maneuverability
- Braking
- Night driving
- Maintainability
Maintainability
Maintainability includes components such as the average time to repair defects which, in turn, depends on the difficulty of the repair and parts availability. The 60 eBuses in the trial have a two-year “bumper-to-bumper” warranty with vendors supporting propulsion systems and charging infrastructure. This would not necessarily be the case with a mature technology where TTC’s own staff would have expertise in these areas, or where (in the case of charging) this is taken on by an external agency (OPG).
The average days to repair value for the hybrid bus fleet is 1.3. By contrast, the values for eBuses are 4.1 for New Flyer, 6.2 for Proterra and 8.4 for BYD. When one combines these with the rate of defects that take buses of service, some of these vehicles spend much more time in the shop waiting for troubleshooting, parts or available vendor support staff. This is not a stirring advertisement for new technology.
Total Life-Cycle Cost
Operating Costs (Energy)
Complete operating costs for the eBus fleets are not yet available because the buses are under warranty and repair costs are borne by the vendors. The report includes a comparison of energy costs. Of particular note here is the drop in diesel operating costs during the pandemic year because of lighter loads and traffic conditions.
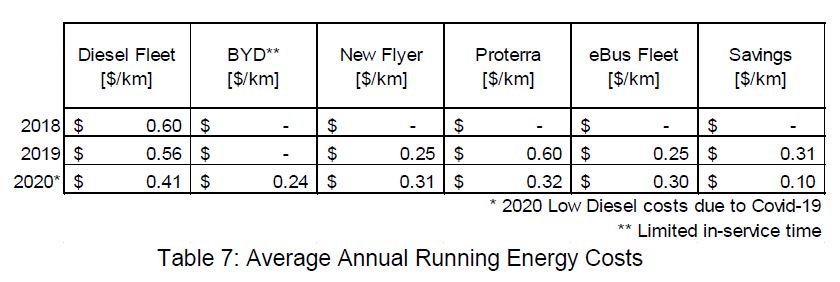
An average bus travels 75,000 km per year, and a saving of about $19,000 per bus is anticipated. By 2040 when the fleet is expected to have 2,600 buses or more, this is equivalent to an annual saving of $50 million based on current energy costs.
A further consideration is the use of on-site power storage to build up reserves for charging when power is cheap, or to sell back into the grid when power is expensive. This is not a straightforward in-and-out proposal because each energy conversion step involves losses.
Capital Costs
Current capital cost estimates show that the premium paid for a battery eBus over a hybrid would be about $200,000. This gap is falling and is expected to narrow as the technology matures. However, this is unlikely to be in time for at least the first large-scale purchase of eBuses by the TTC.
A fleet electrification study planned for 4Q2021 will delve into life cycle costs in detail.

Do they ever even acknowledge that they aren’t doing studies to compare these buses to In-motion-charging e-buses/trolleybuses? I can understand them ignoring Europe and Latin America, but how can Canada’s biggest city transit provider justify ignoring Vancouver?
Steve: There is one passing reference to “opportunity charging” (static charging stations along route) but none at all to in-motion charging. I don’t think we are likely to see a proposal for that.
LikeLike
Based on all the analysis it seems that BYD really wasn’t able to compete.
More importantly it not seem sensible for the TTC to stop buying hybrid buses at any time soon.
Splitting the next few years purchases under the available funding at approximately 300 hybrids over one year and approximately 300 BE buses over two years doesn’t seem like the best approach.
Perhaps TTC could offer a more flexible procurement option where a supplier could supply a mix of BE and hybrid buses, over a longer period of time, with TTC adjusting the minimum numbers for BE buses as the technology evolved.
I suspect there might be some interest among the suppliers in having a longer, more sustained relationship with the TTC plus an opportunity make their BE products better…rather than just the one-time purchase. This interest might be even greater if there are more GTHA agencies involved through the Transit Procurement Initiative.
Plus I wonder if this could be a way to attract funding incentives from different governments…not just Ontario and Canada, but also Manitoba (for NFI), Quebec (for Nova) and Sweden (for Nova).
The upside could also include bus assembly facilities in Ontario as part of the agreement.
Of course there are downsides as well. Assembly facilities need ongoing product lines (as we know from the Thunder Bay plant). Plus, BYD might argue that Nova and NF have an unfair advantage in that they have already provided hybrids to the TTC, and BYD should also have that chance (even though their BE buses didn’t work out that we’ll).
Steve: The big problem is that the feds are shovelling money out the door for eBuses as a combined post-pandemic stimulus and industrial development support for the technology. This happened before with hybrid buses that were not ready for prime time, but that’s where the money went. Then there will be lobbying by the manufacturers hungry for the cachet of such a large order from the great and powerful TTC.
LikeLike
Likely they’ll NOT upgrade the Queensway Garage for eBuses. They’ll need to replace the bus garage, along with a Line 2 storage expansion for its extension to Scarborough Town Centre, together at Obico (west of Kipling).
Steve: That would not surprise me at all. Birchmount is another old garage that is a candidate for complete replacement.
LikeLike
Based on this data, why not give 100% of the order to New Flyer? They can still take on some Nova buses and continue testing on all of them. Gives them a chance to get data for post-2025 procurement.
LikeLike
Any word on testing of articulated eBuses? Or relying on the word of other transit companies that use articulated eBuses? Or is that the next step?
Steve: I think TTC wants to nail down the eBus technology before moving on to artics. Remember also that only certain garages are configured for the larger vehicles. I suspect we will see something when the plan comes out in the fall.
LikeLike
I am very concerned about the logistics of recharging the buses. Look at the winter range of the manufacturers:
Km Manufacturer
168 BYD
217 New Flyer
166 Proterra
Note that this is with brand new batteries. Batteries will suffer a steady decline in capacity with use, with 10% after the first year being typical.
So-called “fast” charging can reduce charge times to as little as 30 minutes, but this is very hard on the battery. Fast charging rapidly ages the battery, significantly reducing battery life and capacity. Even when the battery is new, such fast charging can only charge to 90% of capacity. So I strongly doubt that the TTC will do this. I see that charging time was not given, but four hours is a typical charge time.
If we assume 30 minutes to dead-head the bus to and from its charge point, this means that we run the bus in service for 8-10 hours and then spend 5 hours charging it. Needless to say, this presents a serious scheduling and logistical challenge. I strongly suspect that this will require the purchase of a large amount of extra buses so that some can be charging while others are running.
This is why many systems have the core or trunk part of their electric bus network wired for on-the-move charging. This technology started out as conventional trolleybus technology with a small on-board battery for short off-the-wire moves. Then it evolved into a larger battery which allowed extension of trolleybus lines with off-the-wire revenue service at the ends of the line. So what I am trying to say is that this is proven, existing technology.
Question: Is there any data about charge times during the TTC bus trials?
Steve: Charging times vary depending on how depleted the battery is when a bus comes in for a charge. As a general rule, the TTC is planning on doing two “shifts” of charging overnight. As for fast charging enroute, remember that this would generally be for a top up, not a complete recharge and so the bus would not be out of service for an extended period. At the April 14 Board meeting, staff did mention that they are looking at on-route charging as an option.
LikeLike
The problem with this is that the buses do not have enough range to make it through the day. After a year in use, even the New Flyer buses will have less than 200 km range during winter, and the others around 150 km. Assuming an average speed of 15-20 km/hr, this results in 8-10 hours of use before the bus has to be recharged. We can also subtract from this range the round-trip distance to deadhead the bus to the charging location. So we may actually have only 7 hours of revenue service for the bus before it has to be charged again.
Unless something major has changed, the on-route charging TTC staff is considering is stationary charging. The bus is plugged into a fixed power point somewhere along its route and cannot be moved while being charged. Although this saves on the deadheading time and range penalty, the bus will still be out of service for four hours while charging. Or if not four hours because the bus is being charged after a partial discharge, we still have this formula: charge time = 50% of revenue service time.
Steve: See my comments below.
And as the battery ages, that percentage will steadily increase.
This leads to two alternatives. One alternative is that a large number of extra buses are purchased so that they can be operating while the other buses are charging. This appears to be the current direction in which the TTC is going. The other alternative is that the core or trunk part of the bus network is wired with trolleybus style overhead wiring so that the batteries can be charged while the bus is moving in revenue service on this part of the route. Then the bus can operate off-the-wire on batteries alone for the rest of its route.
I presume that this will boil down to an infrastructure cost comparison. We must ask the question, is it cheaper to buy a large number of extra buses or is it cheaper to install overhead wiring on the core part of the bus network? Please note that I do not have an answer to this question and am therefore technology-agnostic.
But why do I have a feeling that this cost comparison is not being done?
Steve: Some of the assumptions you have made about charging times, notably for on route charging, do not match actual industry experience. I recommend Edmonton’s report on winter trials which is linked from their page on electric buses.
BTW it does not take much browsing around the web to find many other cities with trials in progress at least as long as the TTC’s, an organization that seems bent on telling everyone they lead the pack. There are some interesting documents linked from APTA’s site.
I plan to update the article with some of the info from the staff comments at the TTC Board meeting. Stay tuned.
LikeLike
Have they decided which company will be manufacturing the 300 hybrid buses they planned to bring in at today’s meetings, Steve?
Steve: No.
LikeLiked by 1 person
Interesting to note that the “BYD” buses in London, UK are actually just Alexander-Dennis buses with BYD batteries instead of diesel engines… (Alexander-Dennis make the GO double deckers)
Certainly ironic that the company that lobbied hardest, has the “worst” product!
Steve: To be fair, the propulsion system has not been a major problem for any of the vendors. Building buses, on the other hand, seems to be a challenge, as well as maintaining a supply of parts and sufficient onsite staffing to perform warranty repairs by BYD.
LikeLiked by 1 person
The TTC ought to consider another major supplier for vehicles of all sorts: Škoda. The firm is highly reputable for quality, 150 years in business, has built over 5000 locomotives in its history, and is the #1 supplier of trolley buses in the world. I have seen Škoda trolley buses perform in Rīga, Latvia. Both regular and articulated, with battery or diesel backup power, they run off-wire at will, such as by the Rīgas Stacija central depot and in other touristy areas where lots of wires would be unsightly. Rīga is at the same northern latitude as Hudson’s Bay, and the weather is often more extreme than in Toronto. With Eastern European wages and other costs lower than in Canada, the prices ought to be quite competitive.
Here is a look at Škoda in Rīga.
Škoda also makes battery powered fast-charging buses (5-8 minutes) with a range of 30 km. per charge.
Steve: Škoda was blackballed from bringing a demonstrator streetcar over to Toronto during the whole “evaluation” period that led to Bombardier getting the contract. The fix was very much in for BBD as a Canadian-based manufacturer.
LikeLiked by 1 person
Huh? On that page it says that a complete charge takes four hours. That is the time I used.
On page 67 of the linked report on Edmonton’s winter trials (5:5 in the document) it states: “Buses may be required to return to the garage after every shift.” So it looks like they are getting about 8 hours of service out of the bus, followed by a four hour recharge. This is precisely the logistical issue that I am flagging.
Steve: I was referring to on route charging. Buses spend a lot of time in garages, and this is the time much of the charging would be done. You cannot count that as a penalty if the bus would not be in use anyhow. That said, yes, there is a charging penalty that the TTC does not appear to have taken into account, but it is not as grave as you imply – a 50% penalty.
LikeLiked by 1 person
“That said, yes, there is a charging penalty that the TTC does not appear to have taken into account, but it is not as grave as you imply – a 50% penalty.”
That is the result of the TTC and Edmonton winter trials. The TTC trial buses have a range of 166-217 km. At 15-20 km/hr average speeds that gives roughly 8 hours of use. The battery chemistry dictates a charge time of four hours unless we use a “fast charge” protocol that severely ages and stresses the battery and only allows a 90% charge. The same ratio of use to charge time applies to any partial charge as well.
If you have any information that suggests that results in service would be different from the TTC and Edmonton trial results, I would be interested to see it. But these trials are clearly saying that charge time = 50% of revenue service time.
Note that this 50% ratio is only for on-route charging. That percentage will increase if we have to deadhead the bus to and from a charge point.
Steve: The whole point of on route charging is to top up a bus, not to replace in garage charging, in order to extend its range. Yes, if you plan on leaving it out long enough to consume many hours of service, then there will be a penalty against that extra “in service time”, but not against the total revenue hours. I think we have beaten this topic to death.
LikeLiked by 1 person
It seems very likely that NovaBus will gobble up the whole 600 bus contract, or at least the 300 hybrids and a significant portion of the electric buses. Their new electric bus the LFSe+ has over 580kWH of stored energy (of course that is not representative of operational capacity), but it is a large capacity. In addition, the key factor is that their new LFSe+ uses the exact same propulsion (the BAE SYSTEMS HDS 200) and parts (all control parts, including batteries) as their current LFS HEV, minus the combustion engine which has been replaced with additional on-board battery storage.
This seems like the logical choice to go with as the TTC already has a significant relationship with Nova and already has the parts logistics set up for the HEV, and it wouldn’t require much of transition to adapt the fully electric model. Nova at the moment is the only bus manufacturer to use BAE fully electric technology in their buses, as it was recently developed for Nova by BAE (New Flyer only uses BAE technology in their diesel-electric model).
Steve: I suspect that the TTC will spread the work among vendors, especially for the eBuses, given issues with delivery and acceptance during the trial period.
LikeLike