With the federal announcement of funding for the TTC’s eBus project, the bid award has been posted on the MERX website as of May 2, 2023.
The bid closed on April 18, 2022, but was not awarded until late January 2023, likely subject to receipt of funding.
The dollar value of the awards are $343.5 million to New Flyer and $220.2 million to Nova Bus. Vehicle quantities are not included in the MERX information, and I await a press release from the TTC with more details.
The total of $563.7 million is split roughly 60/40 between the two builders. This implies that neither of them scored in the highest possible echelon on product evaluation. This would have led to a much higher proportion going to one of two, or even to a single bidder, based on the scoring system in the RFP.
By implication, BYD, the only other bidder, fell even lower in the scoring. This is not surprising considering the quality and reliability problems the TTC has encountered with their vehicles.
I will update this article with additional information as I receive it.
In recent articles, I commented on the size of the bus fleet claimed in the CEO’s Report, the number of buses actually shown as active in the Scheduled Service Summary, and the ratio of spares to scheduled service.
Updated April 24, 2023 at 6:30pm: The chart of average daily mileage by each bus has been amended to show the garage assignments of each vehicle.
An underlying issue for a transit system with a large proportion of spare vehicles is that the active vehicle count can be lower than the total count. Poor-performing vehicles, be they near retirement or simply lemons that cannot travel far without a breakdown, can be sidelined with no effect on service.
However, this can create two key problems:
A culture of indifferent maintenance while keeping only the best buses on the road can minimize repair costs and keeps service quality up, at the expense of garage space and the capital value of the unused vehicles.
The headroom to improve service is lower than it would appear from the raw vehicle count if vehicles shown on the active roster are there in name only. If they were actually needed, they might not be reliable enough to provide service.
To determine the actual usage of the bus fleet, I obtained a summary of tracking data from Darwin O’Connor, proprietor of the TransSee website, for the period from March 1 to April 21, 2023. This allowed me to plot actual usage of the fleet in various ways. Many thanks to Darwin for this assistance.
First is a simple plot of active vehicles by day. The chart below shows the number of buses with non-zero mileage by day over the period. There are several interesting features of this chart:
The regular pattern of weekdays, Saturdays and Sundays is clear. Note the three-day weekend for Easter in early April.
Although scheduled service cuts were implemented on March 27, there was no change in the count of active buses which, if anything, rose slightly. There is a drop in the following week.
The number of active buses exceeds the peak scheduled service by about a hundred vehicles. These are not necessarily extra “run as directed” buses, but rather vehicles that only operate for part of the day and are replaced by others (for example, AM and PM peak trips).
The spike on March 13 appears to have been caused by a single day on which buses that were otherwise inactive were sent out in service. Looking at the detailed tracking data, they did not stay in service for long. However, this spike distorts the apparent number of active buses if one looks only over a wider range of dates.
Another way to look at the data is to plot the number of days buses were active over the 51-day period. The chart below shows the number of buses with non-zero mileage and the count of days active. For example, the high point shows that 141 buses were active on 47 of the 51 days. By contrast, 72 buses were active on only one day, and a further 43 for 2 to 10 days.
This means that 115 buses did not venture into service much during the period. In addition to these are buses still counted as active, but which did not operate at all. The TTC might nominally have a fleet of about 2,040 buses (although they claim 2,114 in an outdated chart in the CEO’s report), but the number actually available for service is likely below 1,900.
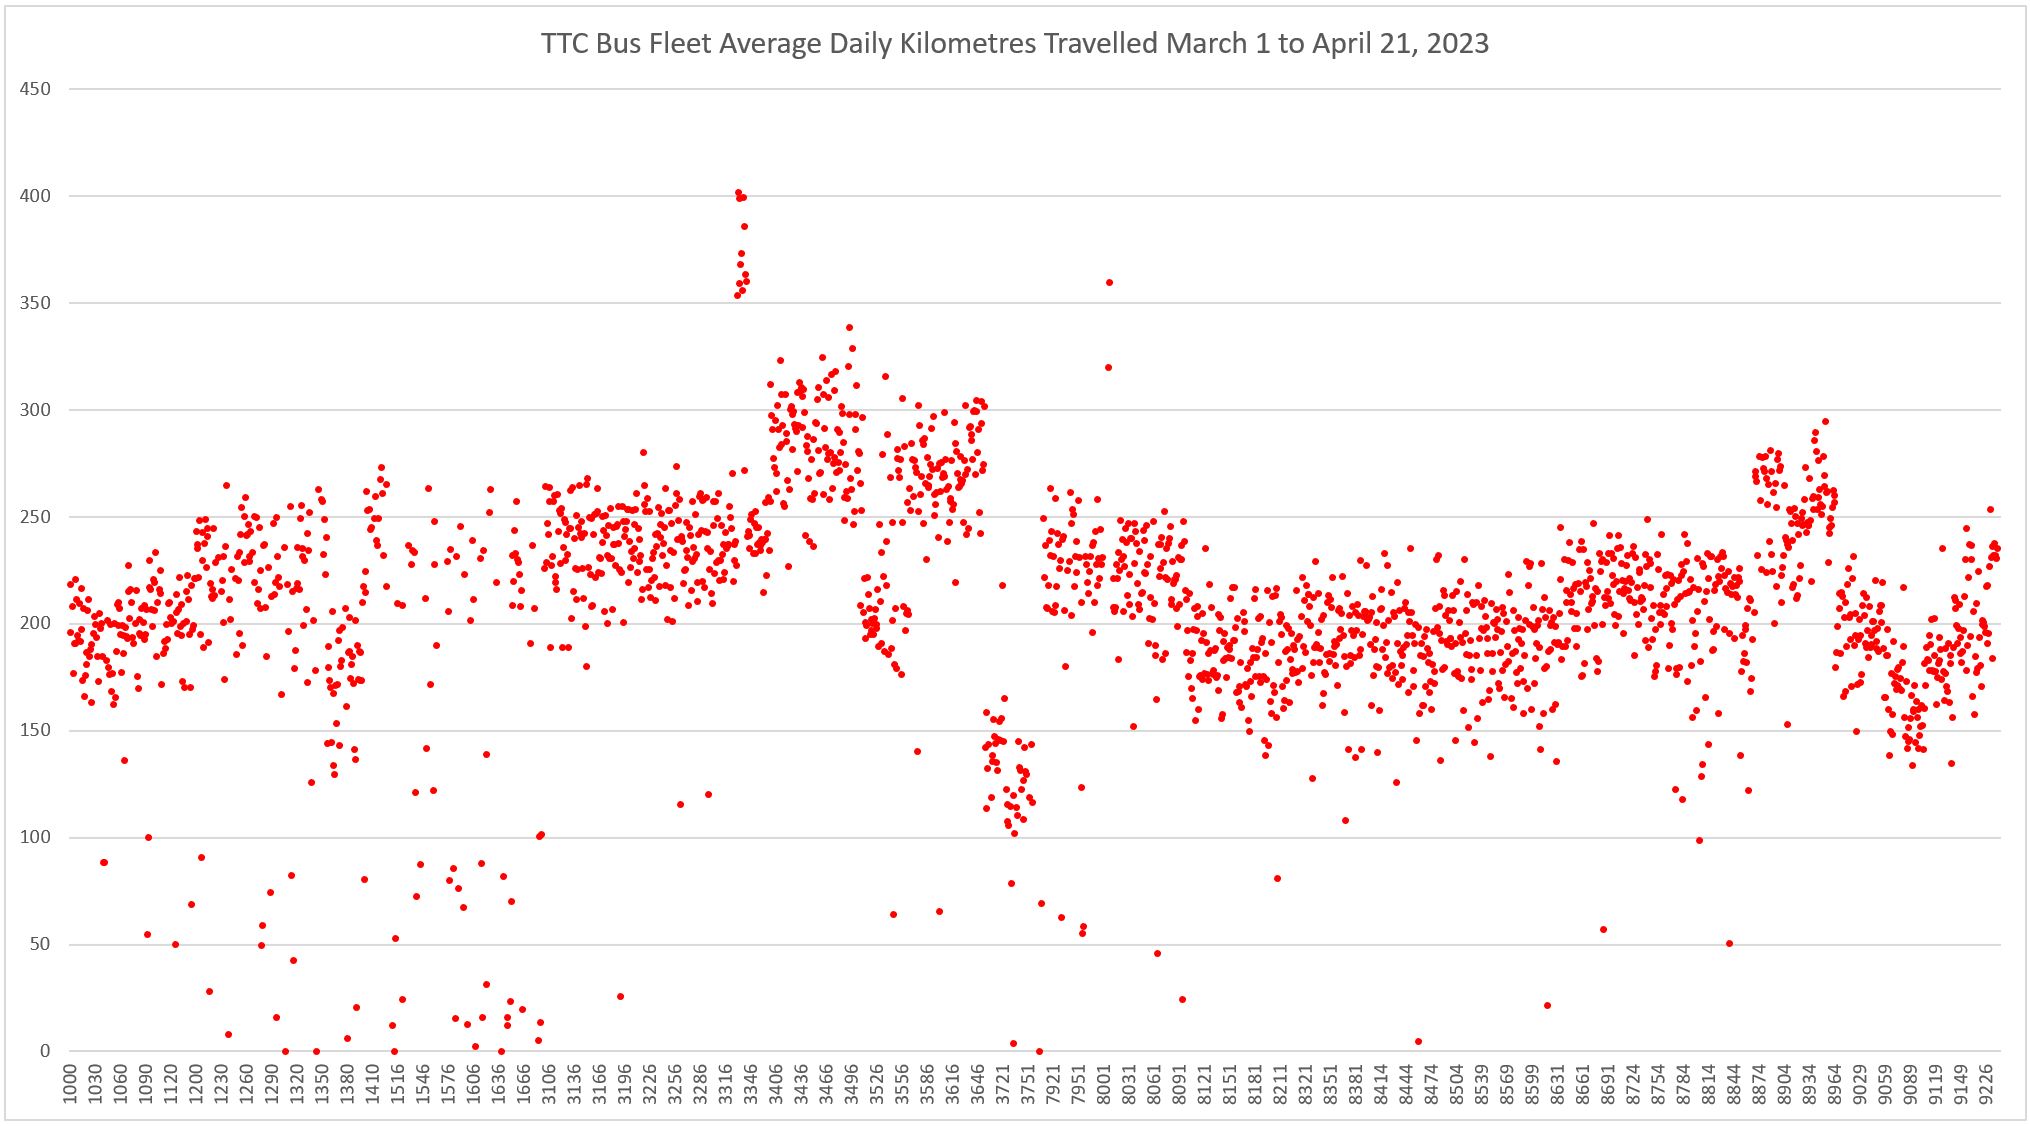
Yet another way to look at the data is to plot the daily average distance traveled by each vehicle considering only the days on which it was active. In other words, if the bus went out in service, how long did it stay there?
In the chart below, buses with no tracked mileage are not plotted. Note that the horizontal axis skips over breaks in fleet numbering. For example, there are no buses in the 2000, 4000, 5000 and 6000 ranges.
Items of interest here include:
A few buses sprang to life briefly, but have daily averages very close to zero.
Low average mileages are evident for older buses in the fleet:
7900 to 7979: 2006 Orion VII Diesel
8000 to 8099: 2007 Orion VII Diesel
1000 to 1149: 2006 Orion VII Hybrid
1200 to 1423: 2007-2008 Orion VII Next Gen Hybrid
1500 to 1689: 2008 Orion VII Next Gen Hybrid
The battery buses 3700 to 3759 stick out with consistently lower average mileage than other parts of the fleet. Some eBuses were completely inactive during the 51-day period:
New Flyer: 3705, 3706, 3715, 3720, 3724 (5 of 25 buses)
Proterra: 3729, 3732, 3736, 3739, 3744 (5 of 25 buses)
Buses assigned to 900 Airport Express have higher daily mileages (3330-3341, 8007, 8008) because they run on a very fast route.
Blocks of buses have higher daily mileage than others because they operate from garages with faster routes.
The TTC has just started to take delivery of over 300 new hybrid buses, and hopes to buy a comparable number of eBuses starting in 2024, subject to federal funding. If these displace the little used older fleet and increase the number available for sustained, all day service, this will be a significant contribution to what the TTC could achieve.
There will be a jump in service requirements in November 2023 when the SRT Line 3 is replaced by a bus shuttle from STC to Kennedy Station. That new fleet is arriving just in time. A budgetary oddity is that this service will be paid for from the Capital Budget as part of the cost of the Scarborough Subway Extension, and so it does not represent a net new cost to the TTC. Meanwhile, Queen’s Park is foot-dragging on paying for conversion of the SRT right-of-way as a bus roadway that would speed travel and reduce bus requirements.
Having more, working active buses to provide better service requires more operators and mechanics. A bus that sits in the yard costs next to nothing to “operate”. If hundreds of new buses sit idle (or allow middle-aged buses to be sidelined) this would be both a waste of capital and a betrayal of the promise of better service with a rejuvenated fleet.
The TTC has not produced a public fleet plan in years, and especially not one showing the effect of various scenarios for service growth or retrenchment. Current plans see only a 1% growth and this translates to small expansion of the bus fleet, especially considering that some bus services will convert to LRT when and if Lines 5 and 6 ever open.
Council’s goal to “green” the fleet may reduce diesel emissions, but the much larger target and goal is to move riders from private autos to transit. This cannot happen without better service and a working, fully available fleet.
Updated April 24, 2023
The chart below contains the same data as the scatter chart above showing average daily mileage for each vehicle, but with the dots colour coded to show the division to which the bus was assigned as of January 2023. The variation due to service characteristics in different parts of the city show up particularly for buses operating on faster suburban routes.
First off, I must report an error in my previous article which includes a table showing that the TTC has 551 spare buses. The actual number turns out to be 478.
The reason for the error is that a chart in the CEO’s report incorrectly shows the total bus count at 2,114. That was the value when this chart was originally used back in early 2021, but it has not been updated to reflect retirements of old vehicles. The actual number of active vehicles, according to the TTC’s Scheduled Service Summary for March 26, 2023, is 2,041. (This number does not appear as a total, but is obtained by adding up the number of active buses for each group in the fleet. See the last page of the summary for details.)
This still leaves the TTC with more buses on their hands than they strictly require for scheduled service plus maintenance, or to put it another way, with headroom to run more service without buying more buses.
The TTC has three new bus orders in the works for delivery in 2023-24:
135 40′ hybrids from New Flyer
68 60′ hybrids from New Flyer
134 40′ hybrids from Nova Bus
It is not clear how many existing buses these will replace and what the resulting fleet mix will be by the end of 2024.
Separately from these will be a new fleet of over 300 battery electric buses. This contract (or possibly contracts) has not been awarded yet while the TTC awaits confirmation of federal funding for “green” buses.
The TTC Board met on April 13 with an agenda that did not give any indication that there would be lengthy debate on any item. I previewed the major issues in a previous article and will not repeat those comments here.
The big items in the public portion of the agenda are the monthly CEO’s Report and an update on TTC’s finances and major capital projects to the end of 2022.
There are also two reports on collective agreements and non-union salaries. Although the details lie in confidential attachments, the public reports give an overview of the various labour contracts and salary drivers across the organization. I leave perusal of these to interested readers.
Finally there are a few references to the TTC’s eBus program scattered through reports. I will consolidate this info in its own section at the end of the article.
Correction April 18, 2023: It turns out that the size of the bus fleet shown in the graphic below is wrong. There are only 2041 buses, not 2114, in service as of March 2023. The article has been amended to reflect this.
At its meeting of July 14, 2022, the TTC Board received a Green Bus Update. By the time a contract is awarded later this year, it will be almost five years since the TTC began this process.
Among the issues not yet resolved are the status of various potential vendors, the degree to which the head-to-head comparison of buses will actually influence product selection, and the financial arrangements in the short and long term for a major shift in bus propulsion technology.
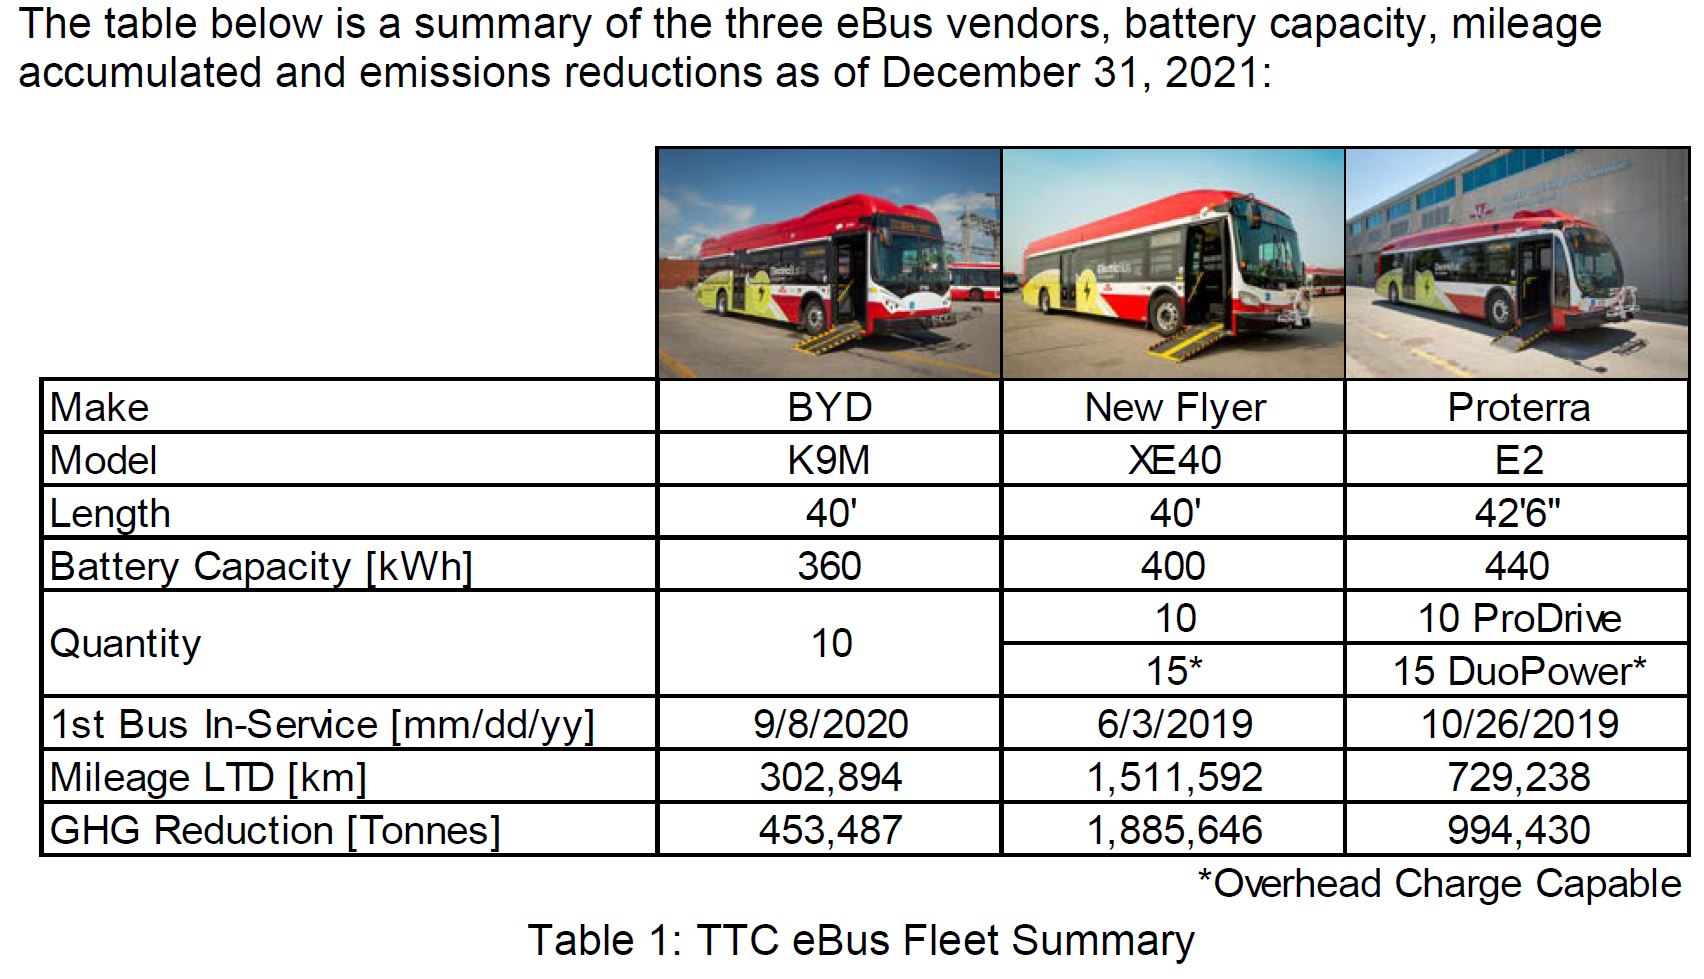
In a comment on my article TTC eBus Study: Final Results, an alert reader noted that the claimed GHG reduction from the new fleet was vastly out of proportion. Here is the TTC’s chart from that report and accompanying text (highlighing added).
The TTC’s first 60 eBuses were procured from BYD, NFI and Proterra. Prior to the delivery of these eBuses, three garages (Arrow Rd, Mt Dennis and Eglinton Garages) were retrofitted with depot charging systems to accommodate charging up to 25 eBuses per location. All 60 eBuses procured have now been in-service between one to 2.5 years at the TTC with more than 2.5 million kilometres driven, and have reduced GHG emissions by 3.3 million metric tonnes.
TTC Report at p. 14
The basic problem here is the claim that for every kilometre travelled by an eBus rather than by a diesel bus, the saving would be over 1 Tonne of GHG. In the paragraph above, the saving should be 3.3 thousand metric tonnes, not 3.3 million. Who knows how many times this erroneous number will be cited.
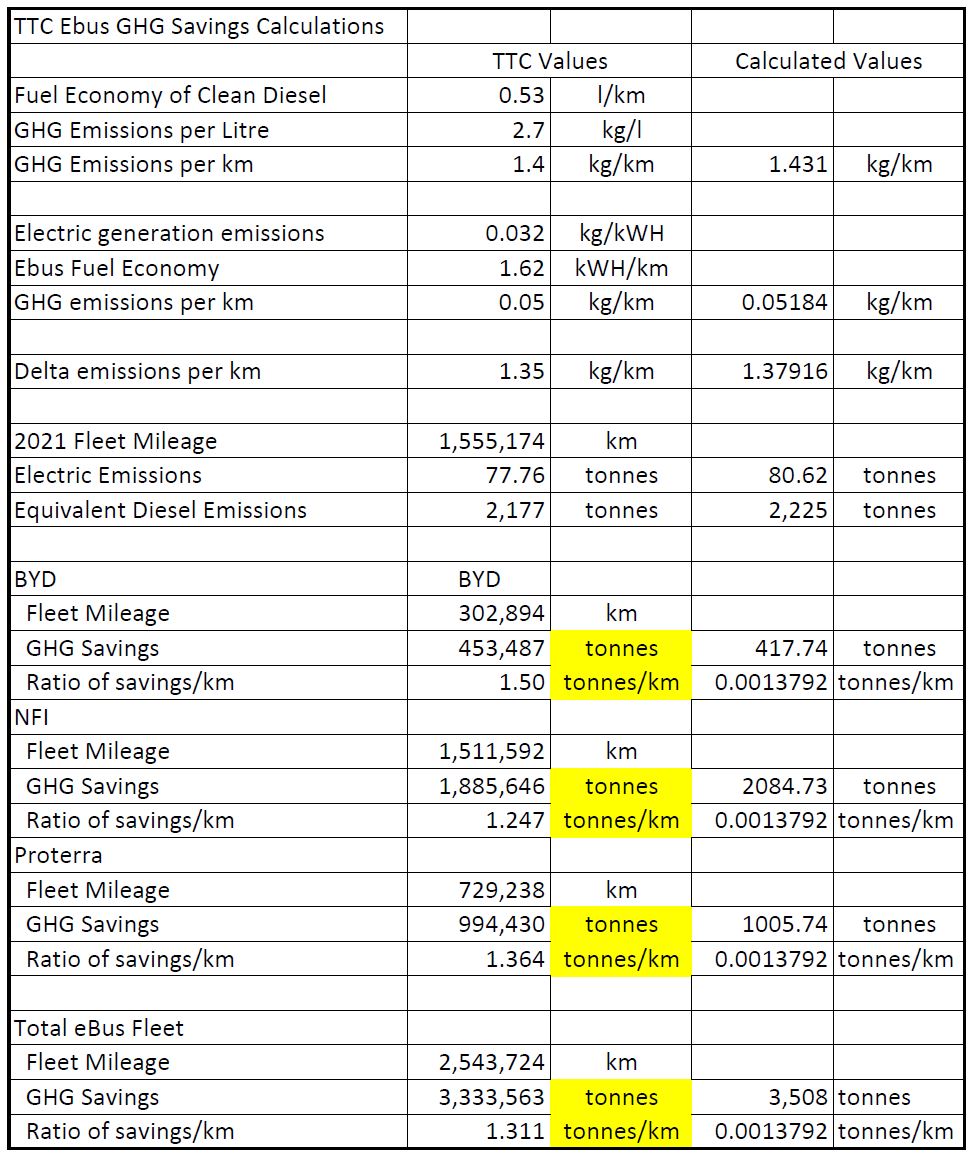
The basic numbers are summarized in one paragraph on page 97 of the report:
GHG Reduction
The greenhouse gases (GHG) reduction is primarily due to the avoidance of diesel fuel consumption. At an average fuel economy of 0.53 l/km, the TTC’s Nova clean diesel buses release 1.4 kg of CO2 per kilometre driven. The generation of electricity also creates emissions through many factors including direct emissions from fuel-fired power plants. For Ontario, the average CO2 emission for base load power is 32 g/kWh. The eBus fleet in 2021 averaged 1.62 kW/km (including all non-operating energy consumption sources), which equates to emissions of 0.05 kg CO2/km. Based on the fleet mileage of 1,555,174 km in 2021, emissions associated with the electricity supply are 80.8 Tons CO2. An equivalent clean diesel bus fleet would have emitted 2,177 Tons of CO2.
Note: The highlighted value should be 1.62 kWh/km. This is a typo in the TTC’s original text.
Running the Numbers
To save readers from working through these numbers, here they are consolidated as a spreadsheet.
The table below compares the TTC’s cited numbers with calculated values. Where a value is calculated, I have not rounded it as in the TTC’s descriptive text. For example, the GHG emissions per km for eBuses is shown as 0.05184 rather than 0.05 kg/km. Cells highlighted in yellow have the wrong units, but this is what the TTC specified in its chart.
The problem here is that the line “GHG Savings” claimed is erroneously stated in Tonnes (1,000 kg) rather than in kilos making the numbers 1,000 times bigger than they actually are.
This has the absurd effect of making the “saving” per kilometre over 1 tonne when the diesel fuel we start with weighs less than 1 kg.
I checked with the TTC, and, yes, the chart is wrong. It should specify savings in kilos, not in tonnes.
The calculated emission savings are obtained by multiplying the “delta” value (difference in emissions by fuel source) by the reported fleet mileages. The claimed values are taken from the TTC’s chart above.
There is a further problem that the ratio of claimed GHG savings to distance operated varies from one vendor to another. There is no explanation for this although the report does cite different fuel consumption rates for each manufacturer’s bus.
Although I have asked, the TTC has not explained why these values are different.
Clean Diesels vs Hybrids as a Reference
There is a further issue with the numbers published by the TTC. They are based on a comparison with “clean diesels” even though some of the vehicles to be replaced include the first generation of hybrids with have lower fuel consumption.
The TTC reports that the GHG saving between a first generation hybrid and an eBus is about 1.315kg CO2/km, as against 1.379 for clean diesels (from the table above). This suggests that the first generation hybrids are not saving much fuel compared to the diesels (less than 5%).
Getting It Right
The main report contains a more reasonable number:
When the entire fleet is zero-emissions, the following benefits are expected to be realized:
1. Greenhouse gas emissions will be reduced by approximately 250,000 tonnes of CO2 annually; […]
TTC Report at p. 3
In pre-covid times (2019), the TTC operated 145.1 million km with its bus fleet. At a saving of about 1.38 kg CO2/km, this translates to 200,000 tones of CO2, a somewhat lower figure than the TTC claims.
As Toronto launches into a new electric era, the TTC needs to clean up its statistics and calculations so that those trumpeting our efforts use the correct data.
Environmentalists, transit boosters, city planners, anyone who is touting electrification should be careful to cite correct figures for the expected benefit of eBuses.
I have no problem with “going green” and welcome the shift to electric vehicles. That said, it is important that the benefits be stated accurately and clearly so that “green” is not oversold. Toronto’s transit history is littered with hucksters.
Updated April 10, 2022 at 10:30pm: Minor typos fixed. Bus order size for eBuses by TTC corrected. Reference to use of pantographs for charging on TTC buses corrected.
Updated April 18, 2022 at 2:50 pm: Note that the GHG savings cited in the TTC’s chart below are off by a factor of 1,000 because they mixed up kilos and tonnes partway through the calculation. See also TTC eBus Errata: Tonnes and Kilos Are Different.
Since June 2019, the TTC ran head-to-head trials of three manufacturers’ battery-electric buses with a fleet of 60 vehicles:
New Flyer models SR2304 (10) and SR2382 (15)
Proterra models Catalyst 40 E2 RR Pro Drive (10) and DuoPower (15)
BYD model K9M (10)
Nova Bus was not part of the trial because, when it was launched, they did not have a vehicle with sufficient range to meet the specifications. However, their hybrid diesel-electric bus, of which the TTC has many, was used as a comparator for the trial.
The low number of BYD buses was due to their inability to supply vehicles even though their lobbyists had engineered, through Deputy Mayor Minnan-Wong, a “deputation” at a TTC Board Meeting that turned into a full sales pitch clearly hoping to short-circuit the procurement process. This was not a high point in TTC history, and the move to a green fleet was launched under very dubious circumstances.
There is also bitter irony for those who remember TTC history. Three decades ago, the TTC opted for the allegedly-green technology of Natural Gas buses as a replacement for trolley bus system expansion. The CNG buses are long gone from Toronto, and the TTC now plans to move completely to electric transit. Lobbyists are good at selling things – whether they work or not is a secondary consideration.
The 102 page report TTC’s Green Bus Program: Final Results of TTC’s Head-to-Head eBus Evaluation goes into great detail of Toronto’s experience with their trial fleet and sets out many “lessons learned” and “must haves” for any large-scale procurement. This article is organized somewhat like the report with an overview followed by some of the technical background. The “lessons learned” have been consolidated at the end. Interested readers should consult the full report.
The clearly superior vehicles in the trial were the New Flyer buses. There were severe problems with reliability and maintainability in both the Proterra and BYD fleets, and some of the “must haves” would exclude them from consideration even if both vehicles and manufacturers had performed better.
Whether this technical outcome will be coloured by another round of lobbying remains to be seen. There will be a lot of money sloshing around as governments rush to “buy green”, but running transit requires a fleet that delivers reliable service, not just publicity photos. Toronto cannot afford to tie the future of its bus fleet to a manufacturer whose political connections outweigh their ability to deliver good products.
The TTC has funding in place from various governments to cover the purchase of about 600 vehicles. These will meet its replacement and growth needs from 2022 to 2025. In February 2022, the TTC ordered 336 buses for delivery by the end of 2023:
Nova Bus LFS Hybrid 40′ (134)
New Flyer Xcelsior Hybrid 40′ (134)
New Flyer Xcelsior Hybrid 60′ (68)
These will be the last buses with diesel propulsion for Toronto, and they would be due for replacement in the mid 2030s completing the conversion to an all-electric bus fleet.
An RFP (Request for Proposals) was issued on April 4, 2022 for a large purchase (at least 240 vehicles) of eBuses with contract award planned for the third quarter of 2022. This lands in the middle of the municipal election campaign, and the authority to award will be delegated to TTC management by the Board. Bids will close on June 17, and the successful vendor(s) would be notified in July with execution of agreements in August. (The last scheduled TTC Board meeting is on July 14, 2022.)
The specification for these buses was developed jointly by the TTC with other agencies:
The TTC is engaged with other peer transit agencies in the province, including Brampton Transit, Mississauga Transit, York Region Transit, and others through the Ontario Public Transit Association on the first interagency co-operative procurement of eBuses. The aim of this collaboration is to develop a single zero-emissions bus procurement specification with the immediate benefit of reducing cost through economies of scale. The long-term benefit is through the optimization and standardization of customer experience and, operations and maintenance throughout the GTHA and beyond.
TTC Report at p. 4
The potential quantity of buses is considerably higher with options for both the TTC and other agencies.
Source: TTC Vendor Briefing Session Deck April 8, 2022 at p. 5
In parallel to its migration to an electric fleet, the TTC must convert its bus garages including the provision of charging infrastructure for hundreds of vehicles at each location. At a previous meeting, the Board authorized an agreement with Ontario Power Generation and Toronto Hydro for the charging infrastructure. The utilities will build, own and maintain this as an extension of their distribution system.
Although the specification includes a requirement for on-route charging using stationary charging points, the TTC has not yet determined if or how such facilities would be used. There is no consideration of “in motion” charging using conventional trolleybus infrastructure to avoid the need for buses to lay over to recharge during their revenue service hours.
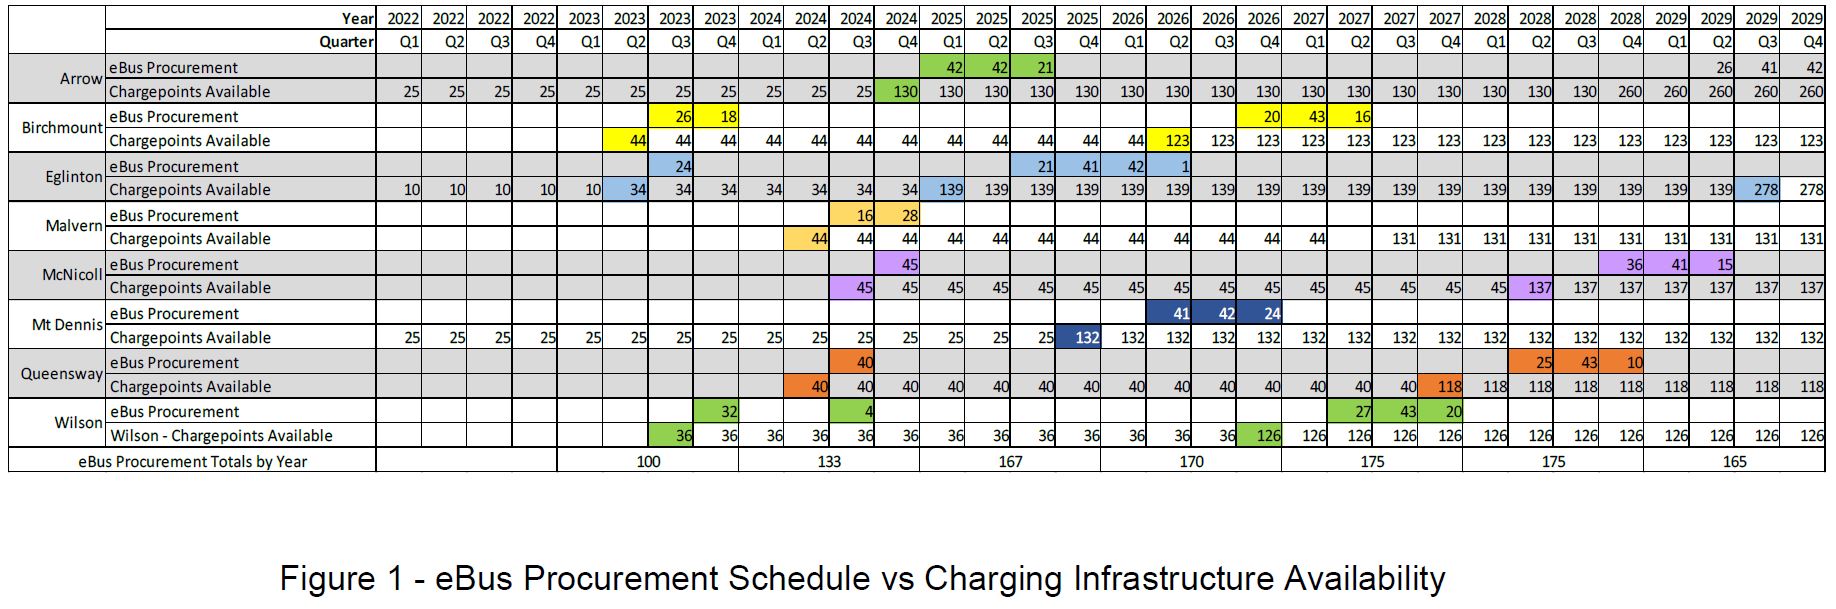
The overall plan for both buses and charging infrastructure is shown in the table below grouped by garage. This accounts for 1,085 buses, about half of the existing fleet. The first 240 buses planned in the contract award this year would take the TTC into early 2025. The program is not funded yet beyond that point. As and when more money appears, the TTC would extend its order.
Note that there are two phases to the installation of charging facilities at garages as the roll out of electrification works its way through the system. This allows some routes from each garage to operate with eBuses earlier in the program than might be practical if the conversion went garage-by-garage over the next decade.
The two-step scheme would also allow for a tactical change in charging strategy to move more of this to enroute facilities such charging stations at terminals. Although the TTC report is mostly silent on any charging technique beyond garage-based plug-in systems, there is a reference in “lessons learned” to a conversion to pantograph charging as a cure for problems with charging cables.
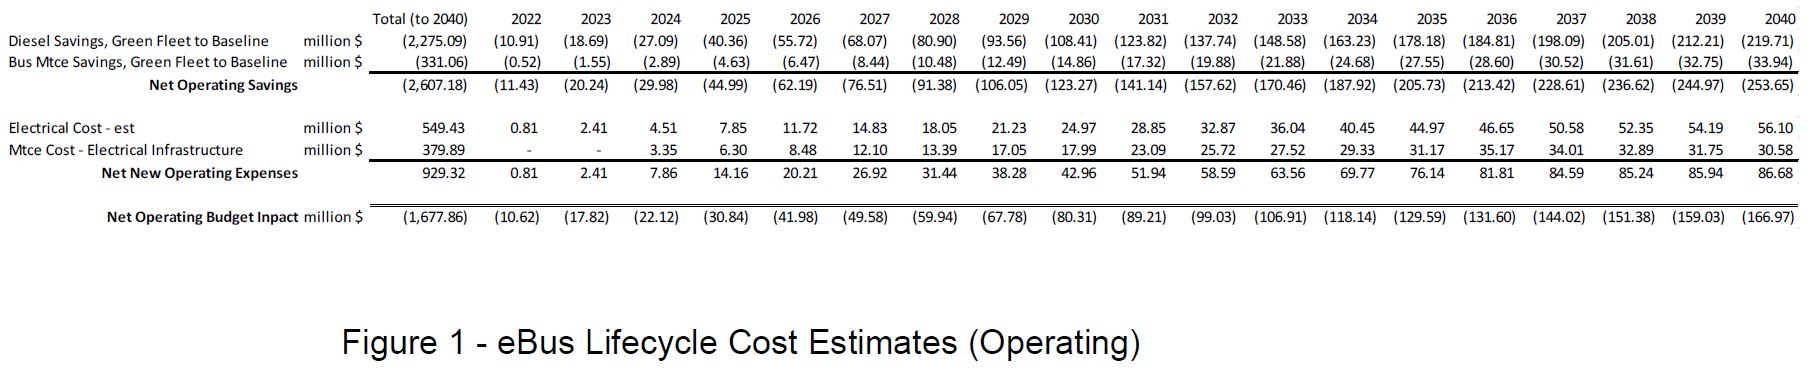
The TTC projects that life cycle costs for an electric fleet will be lower than for the diesels and hybrids it will replace because both energy and maintenance costs will go down. By 2040 this would save about $167 million annually. These estimates are sensitive to the future price of diesel fuel compared to electricity, but the TTC has not shown a range of values to indicate what the effect might be.
An 18-Year Design Life
Although the TTC report does not mention this, the actual RFP includes an interesting specification for fleet longevity. This signals a return to 18-year lifespans for the bus fleet after a retreat to 12 years in current fleet planning. If this can be achieved, it will offset the higher capital cost of the vehicles compared to hybrids or diesel buses.
1.1.1 The Bus shall have an 18-year design life and be equipped with a long life structure in accordance with Specification Section 1.8, made from full stainless steel in accordance with Specification Section 3.0, have a body with a maximum overall length of 12.8 m (42ft.) including a stowed Bike Rack , 2.59 m (8 ft.-6 in.) in width and a maximum overall height of 3.4 m (134 in.).
RFP Technical Requirements Section 1, Page 6
Later in the RFP:
1.8 SERVICE LIFE
Buses shall be designed for a minimum service life of 18 years or 1,610,000 km (1,000,000 mi.), under severe operating conditions similar to revenue transit operation in the City of Toronto.
RFP Technical Requirements Section 1, Page 19
And in more detail:
The vehicle design life shall be validated by successful completion of a simulated 12-year average New York City duty cycle service life. The test program shall be designed around input measurements taken from a vehicle configured similarly to the test vehicle while it’s being operated over a known severe route. The New York City B.35 route or an approved equivalent (i.e., the Queens Q.44 route is now reportedly used by New York City), shall be used for a simulated 800,000 km (500,000 mi.) to demonstrate Bus longevity. This is generally considered to be the equivalent of 16 to 18 years operating life at all other transit properties.
RFP Technical Requirements Section 1, Page 20
“Must Have” Specifications
An important outcome of the trial has been the development of a “must have” list, and certain aspects of any new fleet are not negotiable. Toronto has a history with every type of vehicle (subway, streetcar, bus) where pervasive problems have hobbled fleet performance and availability.
TTC’s next large-scale eBus procurement includes ‘must have’ requirements that are informed by the head-to-head evaluation and focus on ensuring longevity of the bus structure and high system reliability through a proven platform (e.g. stainless steel structure, doors, HVAC, suspension, etc.).
TTC Report at p. 2
These requirements are:
1. Altoona and shaker table testing has been successfully completed; 2. A full stainless steel structure with a minimum of six years of in service experience; 3. A minimum usable battery capacity of 400 kWh; 4. A maximum overall bus length of 12.8 m (42 ft.) including a stowed bike rack; 5. A maximum overall height of 340 cm (134 in.) including any roof-mounted equipment; 6. Ability to charge via roof mounted pantograph charging interface, capable of accepting a minimum charge rate of 300kW (400 ADC) at 750 VDC or greater via SAE J3105/1; and 7. Two rear-mounted charging ports capable of accepting a minimum charging rate of 150 kW (200 ADC) at 750 VDC or greater via SAE J1772.
TTC Report at p. 24
Requirement 3 conflicts with statements elsewhere in the report where a maximum length of 40 feet is cited so that buses will fit within existing garage designs and operations. The difference appears to be in whether the bike rack counts toward the total, but it is not clear whether the Proterra bus would meet this requirement.
Physical Compatibility: The industry standard bus length is 40-feet (12 metres). This standard was used to design storage facilities in the TTC’s existing bus garages.
The Nova HEV, BYD, and NFI buses meet this standard. Proterra buses are 42.5 feet long, but also offers the highest seating and standee capacity. Based on our bus garage layout, procurement of additional Proterra buses would result in a loss of storage capacity of approximately 10% at four of eight garages. The remaining four bus garages could accommodate this additional length. However, this would impose a significant operational constraint that would prevent movement of buses between garages.
TTC Report at p. 15
A maximum bus length specification of 40 feet is required in order to preserve bus storage density at existing maintenance facilities; …
TTC Report at p. 16, also p. 28, under “Lessons Learned”
It is not clear whether the TTC is prepared to accept buses over 40 feet long, and what position they will take about Proterra vehicles on that account. Other issues with that vendor, notably bus reliability, might knock them out of the running regardless of bus length.
An additional requirement applies to the contract itself rather than to the buses, and it addresses the City’s equity goals:
In support of the commitment to diversity, equity, and inclusion, the Contractor must agree, as a fundamental component to the Contract, to meet the Procurement Equity Requirements, by applying a percentage of the Contract Price in respect of the Diverse Business Enterprise Requirement and a specified number and percentage, as stated in the Proposal, in respect of the Equity Hired Requirement.
TTC Report at p. 7
This is a contrast to recent provincial actions to back away from equity and community benefit components in contracts.
Updated January 13, 2022 at 6:45 am: Sundry typos and scrambled phrases have been corrected. The projection of additional bus requirements for a 70 per cent service increase has been corrected to include spares.
At its recent meeting, Toronto Council endorsed a plan to move the City to Net Zero emissions by 2040. A review of the full plan is well beyond the scope of this blog, but some proposals affecting transit service and operations are very aggressive.
If Toronto is going to be serious about this we need a detailed examination of assumptions, scenarios, cost projection, and plans out to 2040. Where will population and job growth be? How will transit serve them?
Before I get into the report itself, a quotation from former TTC CEO Andy Byford is worth mention.
Andy Byford sums up the role of a transit system:
“…service that is frequent, that is clean, that goes where people want to go, when people want to go there, that is customer responsive, that is reliable, in other words that gets the basics right …”
Too often we concentrate on big construction projects, or a new technology, or a showcase trial on one or two routes rather than looking at the overall system. In particular, we rarely consider what transit is from a rider’s point of view. It is pointless to talk about attracting people to use transit more if we do not first address the question of why they are not already riding transit today. This is an absolutely essential part of any Net Zero strategy.
The reports contain a lot of material, although there is some duplication between them. They contain proposals for short and medium term actions. At this point, Council has not embraced anything beyond the short term plan.
From a transit point of view, that “plan” is more or less “business as usual” and does little to challenge the current status of transit service in the short term. There is hope that electrification of the diesel/hybrid bus fleet might be accelerated, but little sense of what, on a system-wide basis, would shift auto users to transit beyond works already in progress.
A vital point here is that transit has two major ways to affect Council’s Net Zero goals:
Conversion of transit vehicles to all-electric operation will reduce or eliminate emissions associated with these vehicles, depending on the degree to which the electricity sources are themselves “clean”. This is a relatively small part of the City’s total emissions.
Shifting trips from autos to transit (or to walking or cycling) both reduces emissions and relieves the effects of road congestion, including, possibly, making more dedicated road space available for transit and cycling. Emissions from cars are much more substantial than those from transit.
In the short term, the overwhelming focus is on conversion of the existing bus fleet to electric operation, not of expanding service to attract more riders. Improvements to specific routes might come through various transit priority schemes, but these will not be seen system-wide. Based on demand projections, large scale capital works, notably new subway lines, will primarily benefit existing riders rather than shifting auto users to transit.
The short term targets related to transit are quite simple:
Electrify 20 percent of the bus fleet by 2025-26.
This effectively requires that 400 diesel or hybrid buses be converted. The TTC already plans to buy 300 eBuses, and the Board has asked TTC management to look at accelerating this conversion. This target is very low hanging fruit provided that someone will pay for the buses.
Further targets are 50 per cent conversion by 2030, and 100 per cent by 2040.
Looking at the TTC’s likely replacement schedule (discussed in my Capital Budget Follow-Up), they will easily be achieved as much of the existing fleet is due for replacement by the early 2030s. Hybrid buses to be acquired this year will reach end of life in 2034-35.
This is an endorsement of “more of the same” in our transit planning, but no real commitment to making transit fundamentally better so that it can handle many more trips at lower emission rates than today.
Looking further out there are proposals for substantially more transit service and free fares, but these are not fully reflected in projected costs or infrastructure needs.
Some of the proposals for the NZ2050 plan are, shall we say, poorly thought-out:
Convert one lane of traffic to exclusive bus lanes on all arterials.
Many arterials are only four lanes wide and taking a permanent bus lane has considerable effects on how the road would operate. This is a particular problem for routes with infrequent service during some periods of operation.
Increase service frequency on all transit routes: bus by 70%, streetcar by 50%, subway off-peak service increased to every 3 mins.
This represents a very large increase in transit service with effects on fleet size, facilities and, of course, budgets. This would require an increase in the bus and streetcar fleets beyond what is already planned as well as construction of new garages and a carhouse.
Tolls of $0.66/km on all arterial roads.
This would apply only to fossil-fueled cars, and the forecast amount of revenue is less than half of the additional funding transit would require.
No transit fares.
The immediate cost of this would be about $1.2 billion in foregone fare revenue, offset by about ten percent in the elimination of fare collection and enforcement costs.
Shift 75% of car and transit trips under 5km to bikes or e-bikes by 2040.
This is truly bizarre. In effect, transit stops performing a local service for most rides and they are shifted to cycling. The average length of a transit trip is under 10km, and many are shorter. Moreover, trips are often comprised of multiple hops each of which might be quite small. There is a small question of how much uptake there would be in poor weather conditions.
Shift 75% of trips under 2km to walking by 2040.
Even some transit trips are short, and transit, especially with improved service, is the natural place for these trips. It is not clear whether the plan would be to somehow deter transit users from making very short trips just as, indeed, a car driver would.
[Revenue and cost issues are discussed in more detail later in this article.]
With all of the planned investment, transit’s mode share of travel is projected to fall, while walking and cycling would rise considerably in part because of the policy of diverting short trips. It simply does not make sense to push people off of transit just at the point where we are trying to encourage transit use. This part of the plan is laughably incoherent, and is an example of how good intentions can be undermined by poorly crafted policy.
For example, it is less than 5km from Liberty Village to Yonge Street, and if we were to take the proposal seriously, we would expect most people to cycle to work downtown, not take GO or the streetcar services. I look forward to the public meeting where this scheme is unveiled to the residents. If the demand for GO and for the King car is any indication, they do not want to use “active transportation”. Similarly, the planned development at East Harbour is less than 5km from downtown.
Meanwhile, transit electrification itself only eliminates 3 per cent of existing emissions, assuming a clean source of electricity. The subway and streetcar systems already are electrified, and both have capacity for growing demand if only more service were operated.
City Council endorse the targets and actions outlined in Attachment B to the report (December 2, 2021) from the Interim Director, Environment and Energy, titled “TransformTO Net Zero Strategy”.
Councillor Layton moved two amendments:
* Request the Board of the Toronto Transit Commission to identify opportunities to accelerate the Green Bus Program and to request the CEO, Toronto Transit Commission to report to the Board in the second quarter of 2022 on these opportunities.
* City Council request the City Manager, in consultation with the General Manager of the Toronto Transit Commission, to outline in the 2022 Budget proposal options to increase spending on surface vehicles and hiring additional operators aimed at increasing ridership to get us on the path to achieving the TransformTO goals.
The first amendment echoes a request from the TTC Board to its management at the December 20, 2021 meeting. Acceleration of eBus purchases will require additional funding from somewhere, as well as a vendor capable of meeting a larger order. It will also have effects on TTC infrastructure needs for garaging.
The second amendment is more pressing because it speaks to the 2022 Budget process that will launch on January 13. If the TTC is going to ramp up service this year, this must be factored into the budget. A likely problem will be that any growth beyond that now planned will be entirely on the City’s dime rather than supported by other governments. However, we need to understand what could be done, if only to know the cost should a “fairy godmother” show up with some spare change.
Neither the amendment nor the short-term target for 2022-2025 gives any indication of just what is meant by “better” transit service, nor do they distinguish between restoring pre-covid service levels and going beyond that to encourage more ridership.
The points listed above for NZ2050 are excerpted from Attachment C, the technical background report. A casual reader might think that Council has embraced a very expansive view of transit’s role, but they have not.
The tactics from Attachment C are notably absent from Attachment B which refers to them, but actually lists a much more restricted set of transit goals. I have confirmed with City staff that Council has only endorsed Attachment B.
Q: For clarification: There are, broadly speaking, two levels of a shift in the emphasis on transit in the short term plan to 2030 and in the longer term to 2040 and beyond. Reading the Council motion, it appears that Council has endorsed the short term plan (Appendix B), but has not endorsed the more aggressive targets of the longer term set out in Appendix C. Is this a correct interpretation?
A: Yes. City Council endorsed the targets and the actions outlined in Attachment B ‘TransformTO Net Zero Strategy’. Attachment C is a technical backgrounder report that was used to inform the targets and actions that were recommended and adopted.
Email from Steve Munro to Toronto Media Relations, December 29, 2021. Response from Toronto Environment & Energy Division, January 10, 2022.
That is a polite way of saying “we had some really aggressive ideas, but we know enough not to bring them to Council”.
“Transit” vs “Transition”
In the process of reviewing the reports, I searched on the word “transit”, but got hits more frequently on “transition” as there are many other sectors where reduction or elimination of emissions are possible and on a large scale.
According to the most recent greenhouse gas inventory, transportation is the second largest source of GHG emissions, accounting for 36 percent of total emissions with approximately 97 per cent of all transportation emissions originating from passenger cars, trucks, vans, and buses. Gasoline accounts for about 30 per cent of Toronto’s total GHG emissions.
TransformTO: Critical Steps for Net Zero by 2040. p. 30
Here is a pie chart showing the relative contribution of each proposed action in the Attachment C list which is a more aggressive set of changes than Council adopted. Note the small contribution of transit (red) compared with other areas such as personal and commercial vehicles and changes to building energy use.
Based on Section 7: Low-Carbon Actions pp 52-56 in the Net Zero Technical Report
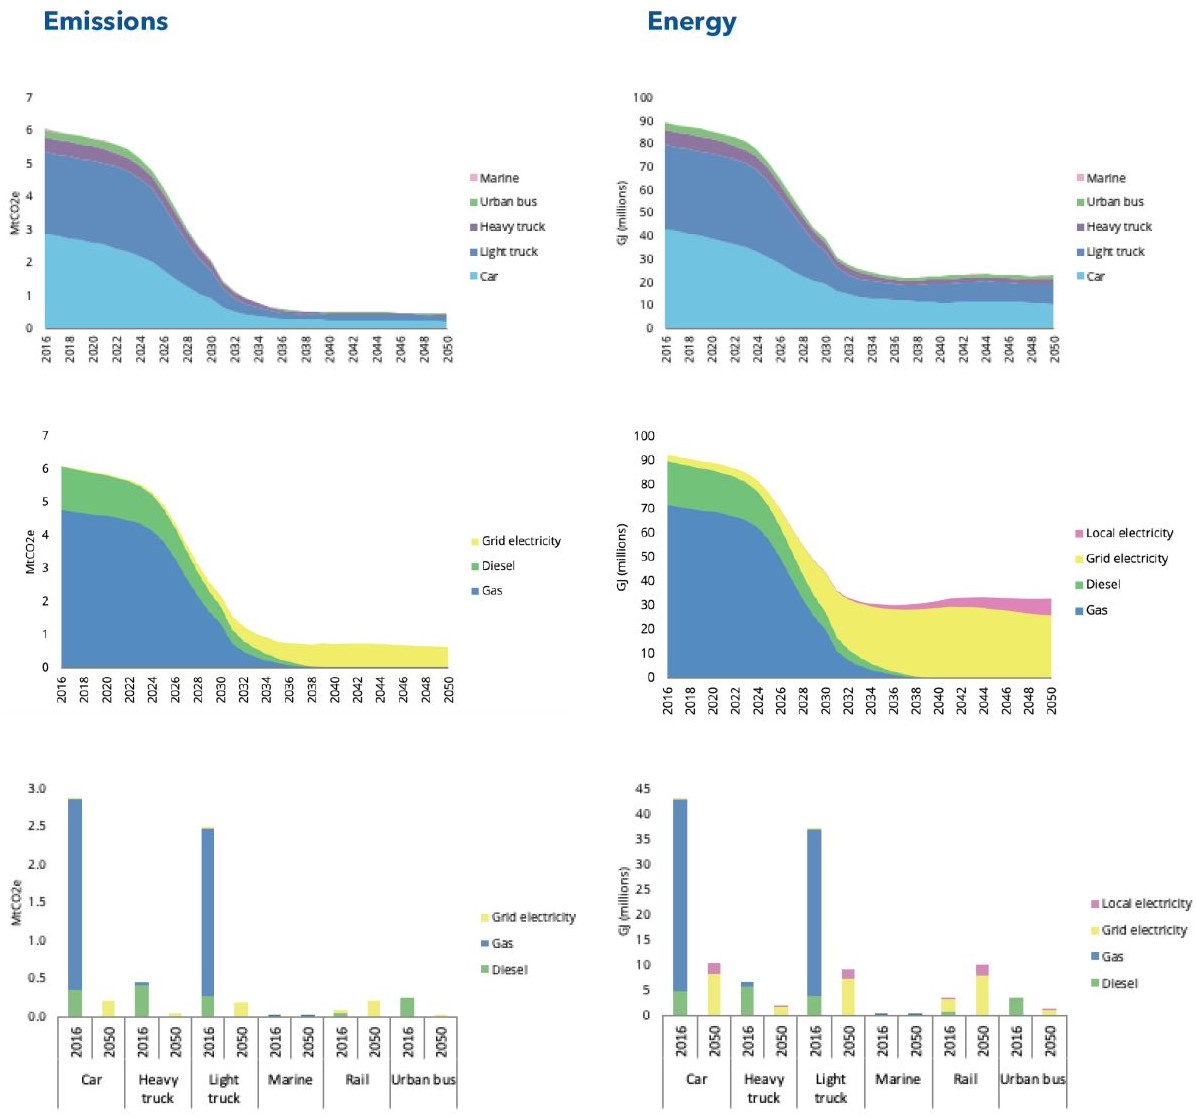
Another way to look at this is shown in a chart of energy sources and emissions generated by each transportation sector as the full NZ plan is implemented.
Top left: the emissions of urban buses are shown in green. This falls off to zero as the bus fleet electrifies.
Middle left: the decline in diesel (green) is a combination of transit, trucking and a small contribution from diesel-powered autos.
Bottom left: Cars and light trucks are the overwhelming contributors of emissions within the transportation sector.
On the right, the charts are harder to accept at face value because they include the effect of a very large shift of short trips to active transportation. An interesting comparison would be what might happen if autos electrified, but did not lose mode share.
That last point has a knock-on effect because if short trips are not shifted, but are only electrified, they will contribute a substantial demand to generating and charging capacity, not to mention continued auto traffic and competition for road space.
The topics here are a bit scattershot as was the Board debate, but they include:
The Toronto Net Zero 2040 plan and electric buses
The conflict between budget planning timeframes and available funding
The growing backlog in State of Good Repair
Fleet replacement timing issues
Where the money comes from
The need to co-ordinate related projects within the budget
Funding for capital programs
Future subway demand and capacity enhancements
There is always a problem with the complexity of the budget that drops on Board members at most a week before the meeting where it will be approved.
There is no “Budget Committee” at the TTC, and so there is no group within the Board who are primed for the debate and can vouch for management’s work in the same manner as the TTC’s Audit & Risk Management Committee. The Board used to have a Budget Committee, but it languished under an uninterested chair (ironically, a member of Council’s hawkish right) and the current Board is unwilling to recreate it.
This says a lot about how seriously (or not) they take their oversight role. Let a few pencils go missing and the Audit folks will be all over the problem, but billions in capital spending and the underlying policy decisions go with little review. This should be a job for whatever TTC Board is crafted for 2023 after the next municipal election.