
The Star’s Matt Elliott has reported on the issue of surplus vehicles beyond reasonable spare requirements in the Toronto Star:
First off, I must report an error in my previous article which includes a table showing that the TTC has 551 spare buses. The actual number turns out to be 478.
The reason for the error is that a chart in the CEO’s report incorrectly shows the total bus count at 2,114. That was the value when this chart was originally used back in early 2021, but it has not been updated to reflect retirements of old vehicles. The actual number of active vehicles, according to the TTC’s Scheduled Service Summary for March 26, 2023, is 2,041. (This number does not appear as a total, but is obtained by adding up the number of active buses for each group in the fleet. See the last page of the summary for details.)
This still leaves the TTC with more buses on their hands than they strictly require for scheduled service plus maintenance, or to put it another way, with headroom to run more service without buying more buses.
The TTC has three new bus orders in the works for delivery in 2023-24:
- 135 40′ hybrids from New Flyer
- 68 60′ hybrids from New Flyer
- 134 40′ hybrids from Nova Bus
It is not clear how many existing buses these will replace and what the resulting fleet mix will be by the end of 2024.
Separately from these will be a new fleet of over 300 battery electric buses. This contract (or possibly contracts) has not been awarded yet while the TTC awaits confirmation of federal funding for “green” buses.
How Many Buses Does the TTC Have?
Using the fleet details in past TTC summaries, I totalled up the number of buses and their types. The fleet hit its maximum size in early 2021 and has declined since then. The diesel bus fleet (red) was stable over the past few years while the hybrid fleet (yellow) has actually been declining as unreliable buses from that group are retired. The eBus fleet (green) begins to appear in mid 2019.
In the chart below, note that the recent samples are more frequent than in the early years when I show only annual values each January.
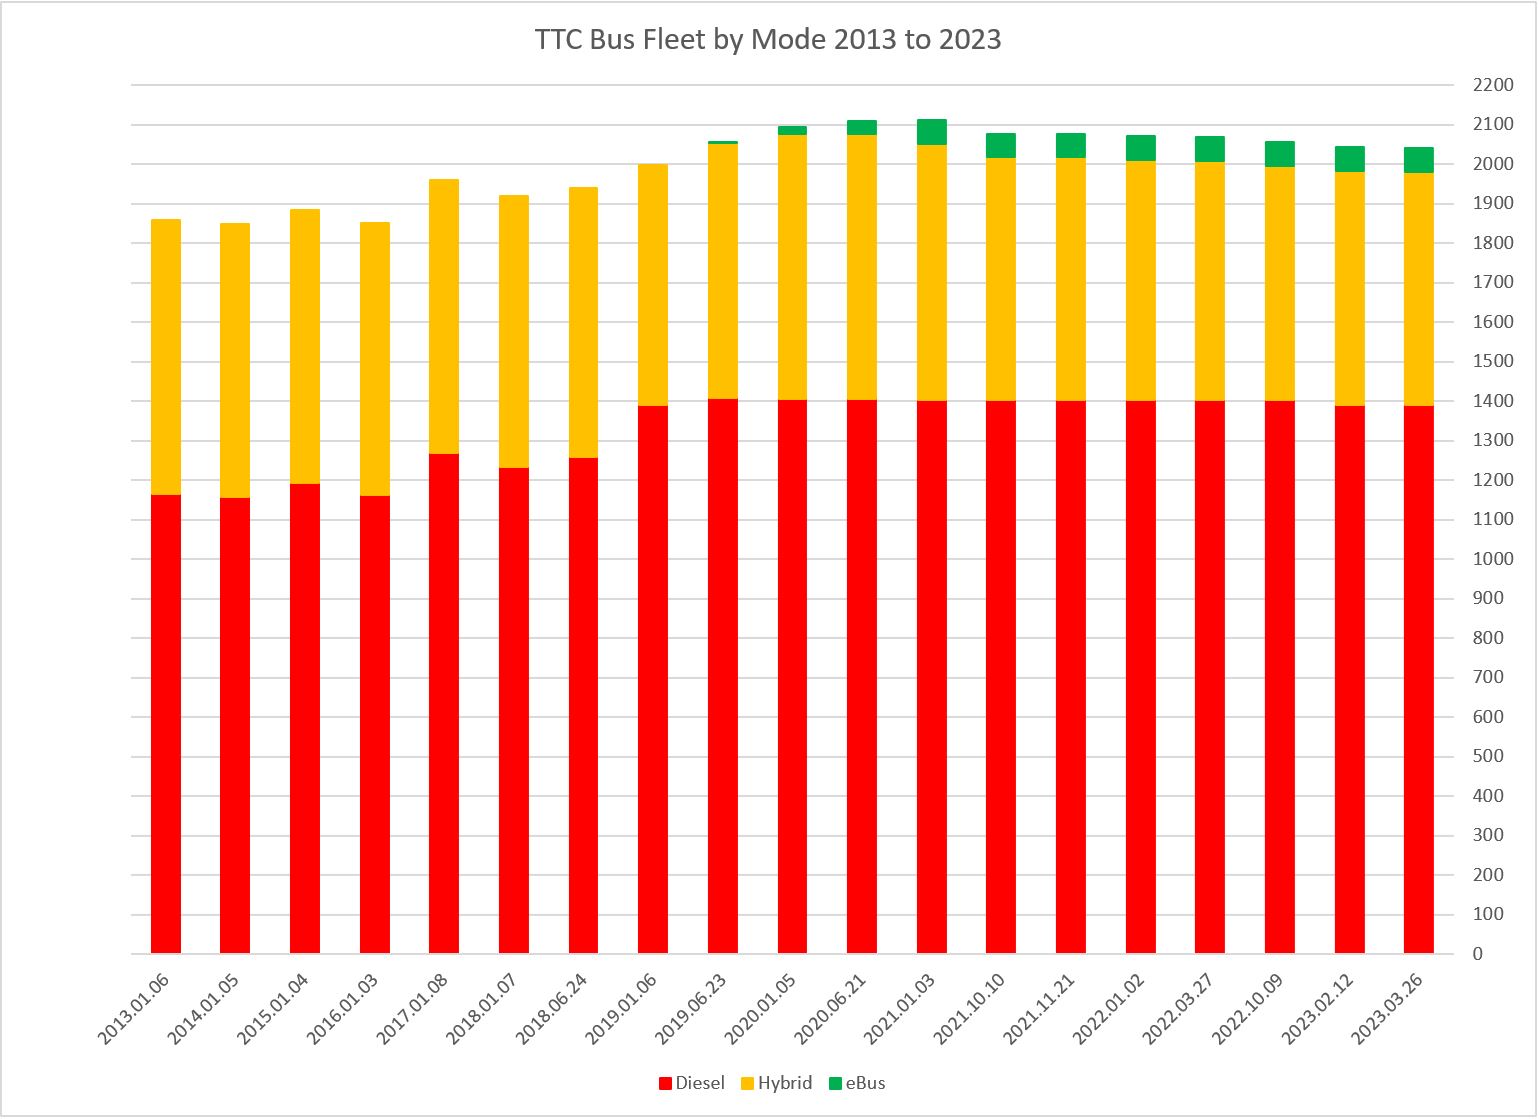
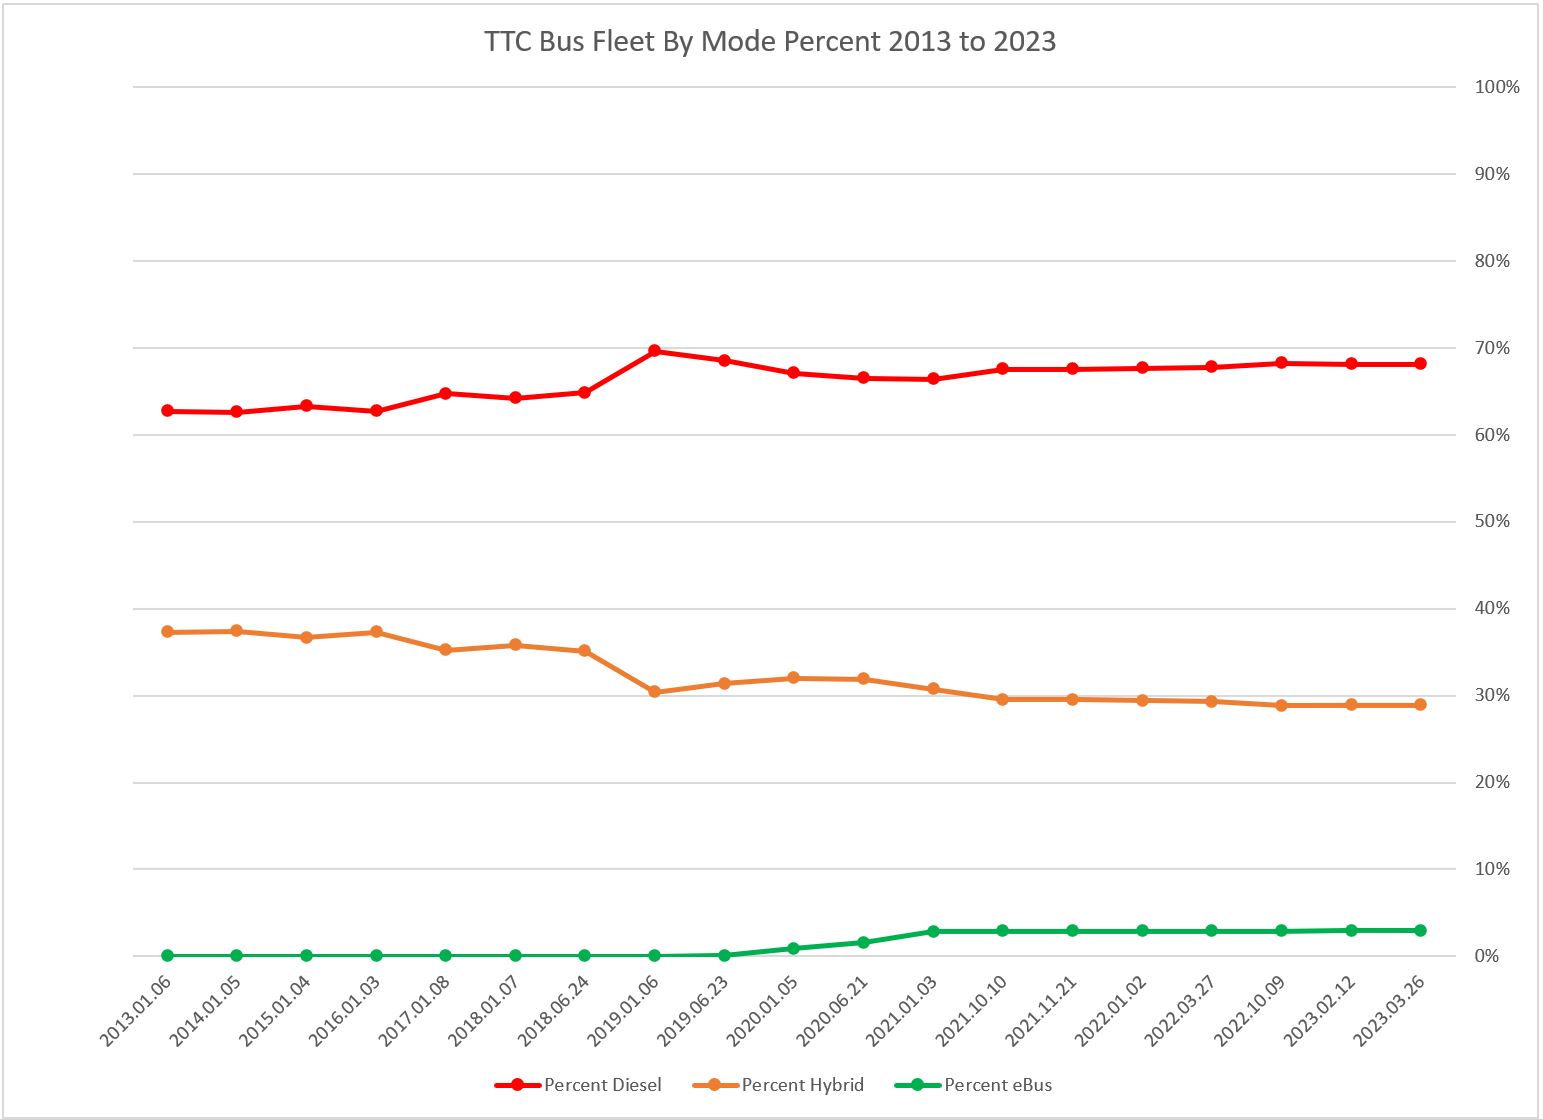
The decline in the hybrid fleet produces the unexpected effect that the proportion of “green” buses has actually fallen relative to the entire fleet. These numbers will change substantially with hybrid bus and eBus orders in the next few years.
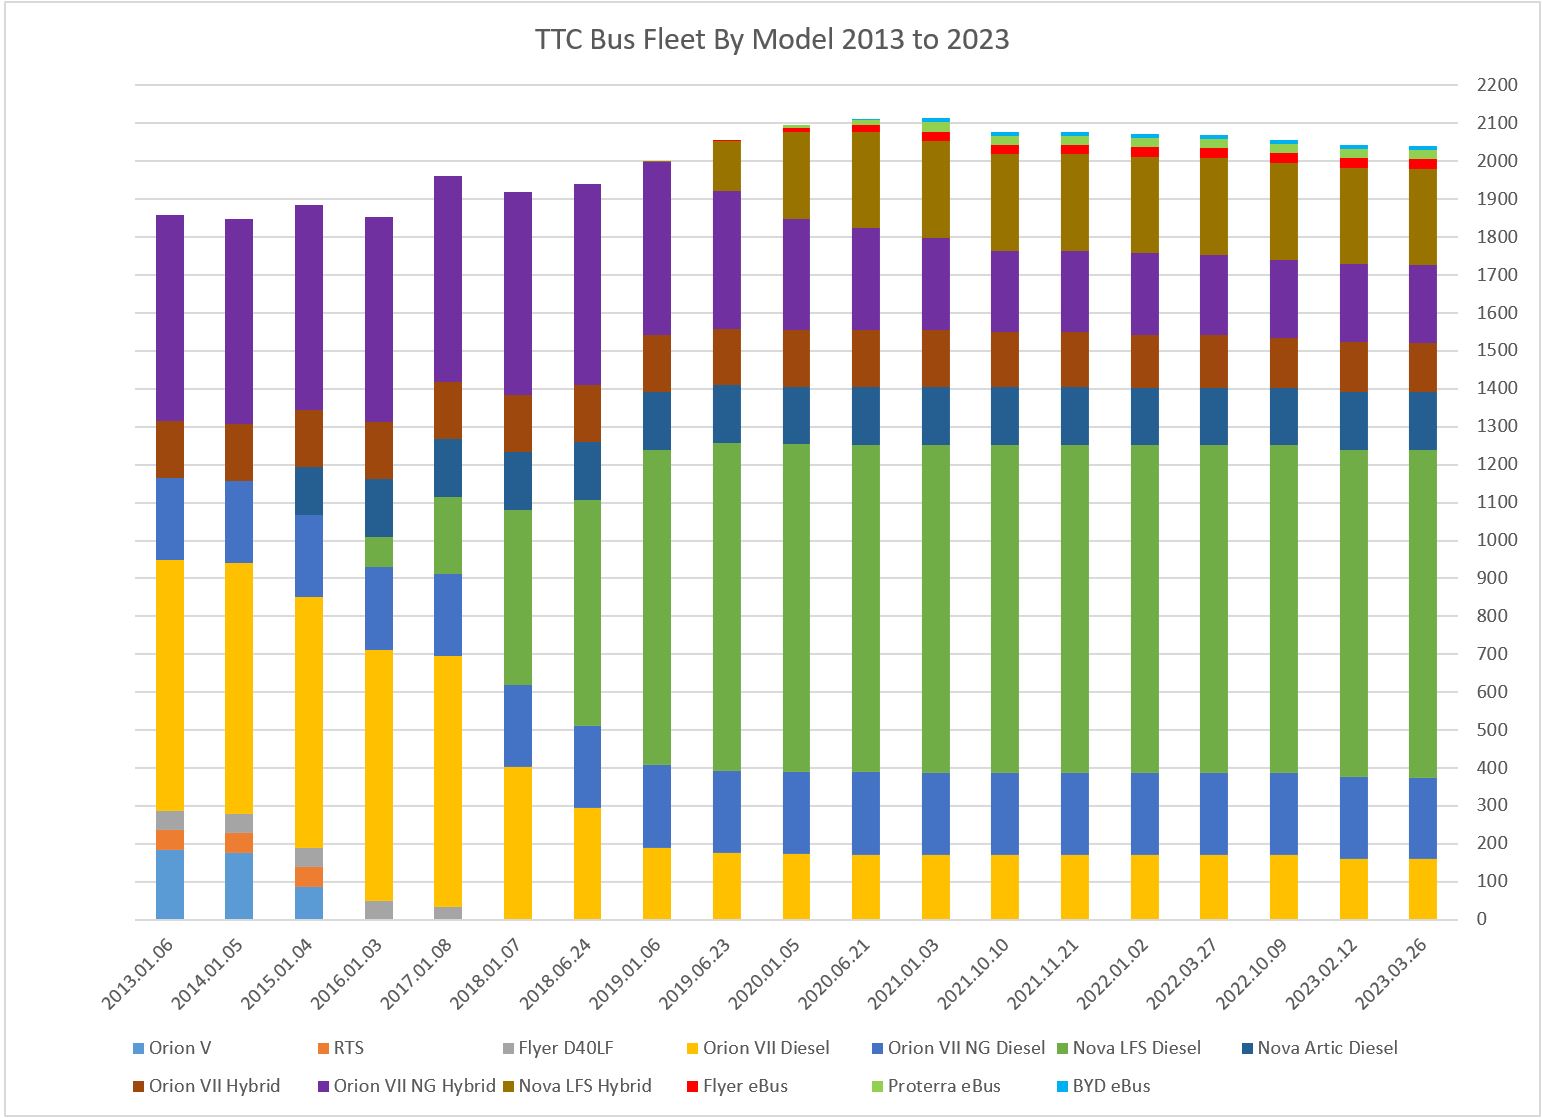
The breakdown of the fleet by model is shown below.
How Are the Buses Used?
The raw fleet numbers do not show what service looks like on the street. Owning a bus does not guarantee that it actually provides service.
Here is the fleet broken down by usage. The red section shows the actual peak scheduled service. This does not include any ad hoc extras or “run as directed” buses. It includes only buses operating on bus routes, not as streetcar substitutes.
Thanks to various construction projects, buses have replaced streetcars. Note that this requirement (green) has grown substantially in recent times in part because the pandemic era was used as a justification for accelerating major works projects.
The TTC has confirmed that a target ratio for spares, the number of buses held aside for maintenance relative to scheduled service, is in the 20-22% range. In the chart below, the yellow band shows the number of spares required to support the scheduled service including streetcar replacements.
This leaves us with the purple band showing the number of buses left over after allowing for scheduled service and spares at 22%. There is actually a negative value in 2013-16 because the fleet was “tight” relative to service needs and 22% spares could not be achieved.

Worth noting here is the trend in scheduled service before the pandemic. There has been a decline since early 2016, and then finally some recovery in 2019. It is ironic that during the 2014 election campaign, then-candidate John Tory downplayed the need for more buses, but relented after the election and agreed to buy the TTC 100 more in Spring 2017. This had no effect on the level of service operated, and only contributed to the growth of the spare pool until 2019 when operating subsidies caught up with the need for more service.
2020 brought the pandemic and a large service retrenchment seen in the June 2020 dip above. Service climbed back, but the TTC put the brakes on when ridership recovery did not meet expectations.
An important note about raw vehicle counts: Although the peak values for January 2013 and March 2023 are roughly the same (about 1,500 buses operating on the “bus” network), there have been changes in operating conditions including allowance for traffic congestion, more relaxed schedules for drivers, and network growth. This means that the level of service riders experience is not the same in 2023 as it was ten years earlier. Those 1,500 buses are stretched further today than in 2013.
The excess spare number remains high (134 in March 2023) and it will increase with the May 2023 service cuts for which details of fleet utilization are not yet available.
Some of these will be soaked up in late 2023 when the SRT is replaced by a bus shuttle, but the new vehicles on order will more than make up for this. The real question is the overall fleet size the TTC will retain and the level of subsidy City Council will provide to operate it. There is no excuse for us to fall back to the era when calls for better service were met with “but we have no buses”.
Even worse, transit cannot afford the reduced service levels becoming a “new normal”, a base from which calls for more funding are seen as “excessive” rather than simply getting back to where we were in early 2020.
In recent years, the TTC Board has actively blocked attempts by some members to pursue discussion of alternate futures and the subsidy implications these might trigger. Council talks a good line about building transit use, but the TTC puts no options on the table for discussion or advocacy of a pro-transit future.
The TTC produces detailed plans of its long-range capital needs including billions in unfunded projects. Many of these are essential for the system’s integrity and growth. Meanwhile, there is no plan looking out a decade or more, nor discussions of fleet and funding requirements for operations in future years. There is a service plan, but its goals are modest and it includes no discussion of “what if” for alternatives.
How many more new buses will sit idle because we are too cheap to pay operators and mechanics to drive and repair them?

Your point remains as solid as it did before.
Other than cost and availability of drivers and some other costs, maintenance etc, it still begs the question of the wisdom (or not) of stifling long-term projections of ridership for the sake of small savings today.
LikeLike
Thanks for the update! On a related topic, is there any prospect of the TTC figuring out how to allow for two bikes rather than just one on the front-of-bus bike racks again?
Steve: I would not hold my breath for this unless there is a major redesign of the buses. The problem is that the second bike blocks the operator’s view.
LikeLike
This is somewhat interesting, because the #1 beneficiary of battery buses will be the provincial government. Right now, the economic cost of people in the Toronto area of motor vehicle operators poisoning people with their lethal fine particles is $4.6 billion per year. Source is page 20 at this report.
The current diesel bus fleet produces 3% of this, so the annual cost savings after converting to electric should be $138 million. My source for the 3% number is a TTC presentation, but the TTC has a certain credibility problem in my eyes. So I would appreciate it if someone could provide another source for this.
That $138 million is mostly benefiting the provincial treasury. Right now, health-care costs are the #1 provincial government costs, at approximately half of all provincial government spending.
Why do I have a certain feeling that this $138 million is going to wind up in the pockets of Doug Ford’s cronies?
Steve: The calculated economic impact includes the value of lives lost which, the last time I looked, does not accrue to Doug Ford and his band of thieves at Queen’s Park. BTW the page in question is number 36 within the linked pdf.
As for the diesel emissions, be careful of the source and the date of the citation. As the fleet has transitioned away from dirty diesels to so-called clean diesels and then to hybrids, the emissions due to the bus fleet might not be as high as it once was. The TTC is fond of using dirty diesel numbers as a comparator even though they have retired most/all such vehicles. This makes further “greening” of the fleet look better than it really is. They also do not consider how “green” the power and the batteries might be.
LikeLike