
The TTC Board will meet on April 13, and the agenda for their meeting is rather small. Notable by its absence is any reference to the service cuts planned for May 7, 2023.
The big items in the public portion of the agenda are the monthly CEO’s Report and an update on TTC’s finances and major capital projects to the end of 2022.
There are also two reports on collective agreements and non-union salaries. Although the details lie in confidential attachments, the public reports give an overview of the various labour contracts and salary drivers across the organization. I leave perusal of these to interested readers.
Finally there are a few references to the TTC’s eBus program scattered through reports. I will consolidate this info in its own section at the end of the article.
Correction April 18, 2023: It turns out that the size of the bus fleet shown in the graphic below is wrong. There are only 2041 buses, not 2114, in service as of March 2023. The article has been amended to reflect this.
CEO’s Report for April 2023
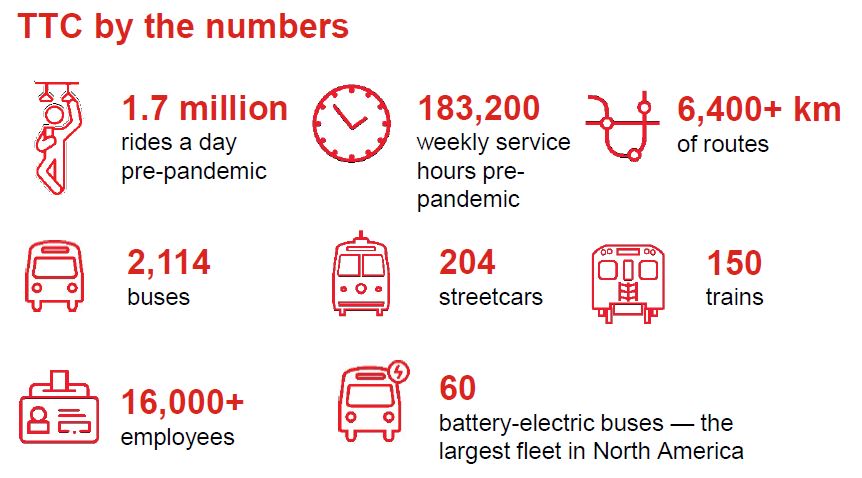
Each report begins with a graphic showing the overall scope of TTC operations. The numbers are impressive, or at least they were in pre-pandemic times, but after three years the TTC should really be reporting its current, not early 2020, performance.
Correction: The chart below incorrectly shows the bus fleet at 2,114 vehicles. The correct number as of Marhc 2023 is 2,041.
Boardings vs Rides and Revenue
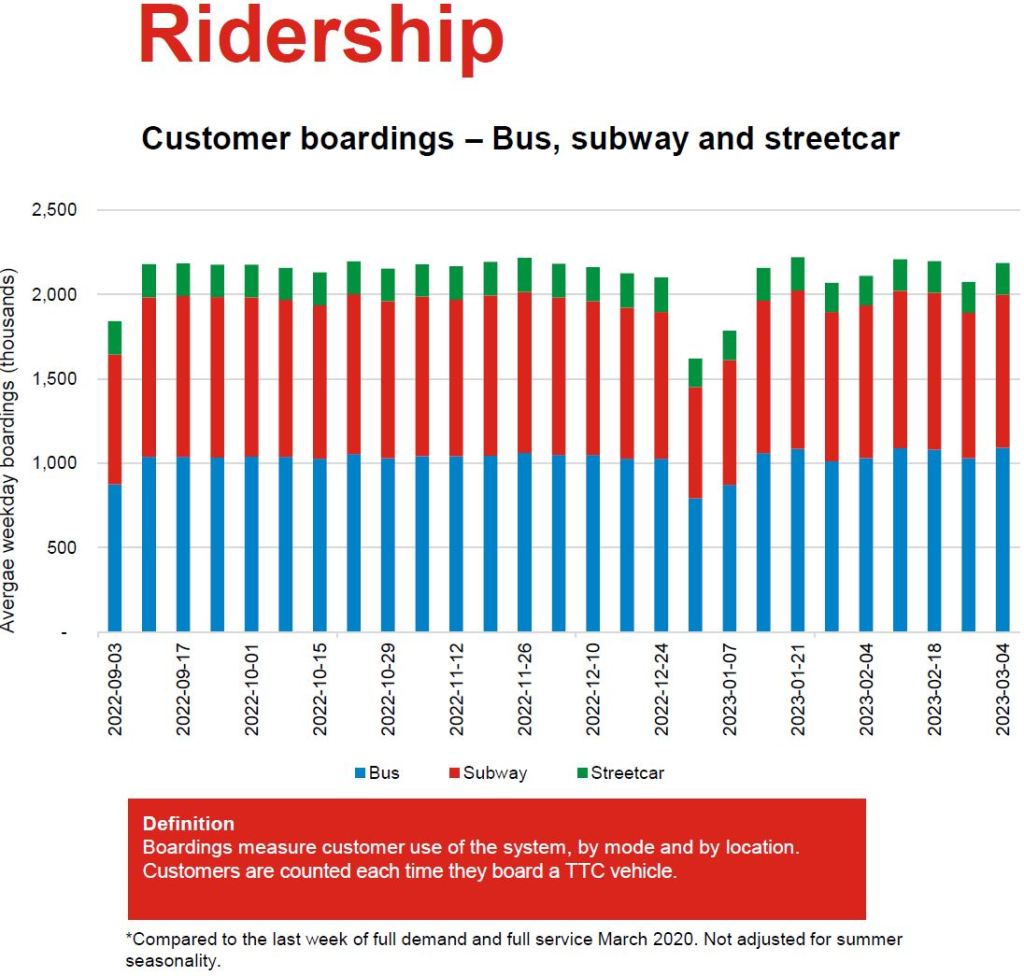
In the body of the report, the ridership is stated as “boardings” as opposed to “rides” per day.
As of the week ending March 10, overall weekday boardings stand at 70 per cent of pre-COVID levels at 2.27 million.
CEO’s Report April 2023 at p. 5
The distinction is that each separate leg of a journey counts as a separate boarding (although transfers between rapid transit lines are not). The ratio between rides and boardings used to be roughly 2:1 so that 2.27 million boardings would be equivalent to 1.14 million rides. This is about 67% of the 1.7 million rides shown above. A further problem in sorting out “riding” stats is that with the two-hour fare and other multi-ride passes, the distinction between a “fare” and a “trip” is blurry.
This has been a problem for years, and one regular concern was that the trips represented by monthly pass holders were overcounted. In the post-pandemic era, the problem is compounded by changes in commuting habits.
Boarding counts are not back to pre-pandemic levels, but the recovery varies by mode with the bus network at 82%, streetcars at 55% and the subway at 64%. These reflect the different character of demand across the system and the effect of reduced downtown demand on the transit network. One big problem with these numbers is that they are system-wide averages and do not indicate how much variation there might be between different times of day or week, or portions of routes.
Weekly Hours of Service
The figure of 183,200 hours cited by the TTC is the number of driver hours per week across all modes before the pandemic. This number does not include extra construction service, a considerable amount of which is funded from related capital projects. The comparable planned figure for the schedule period beginning March 26 is 170,122, or just under 93% of the pre-covid level. This will fall when the next round of cuts is implemented on May 7. That is a system-wide percentage, but the effect on specific routes varies considerably.
Scheduled hours do not translate directly to service because they can be affected both by crewing arrangements and by scheduling. For example.
- If the scheduled round trip time for a service is lengthened (including terminal recovery time), but the number of vehicles is unchanged, then the vehicle hours stay the same although riders see less frequent service. These are often referred to as “service reliability” changes.
- When subway crews are changed from two to one person, this reduces the number of operators, but not the level of service.
Fleet Utilization
The fleet numbers have not changed for some time, but what has evolved over the past three years is the actual utilization of the bus, streetcar and subway fleets.
As of March 26, 2023, the peak utilization for each fleet was:
| Fleet | M-F Peak Service | Spares | Spares:Service Ratio | |
| Bus (Corrected) | 2,041 | 1,563 | 478 | 31% |
| Streetcar (*) | 204 | 123 | 81 | 60% |
| Subway | Trains | |||
| Line 1 Y-U-S (**) | 76 | 60 | 16 | 27% |
| Line 2 B-D | 61 | 40 | 21 | 53% |
| Line 3 SRT | 7 | 5 | 2 | 40% |
| Line 4 Sheppard | 6 | 3 | 3 | 100% |
(*) The streetcar service level is below what it could be in part because of several overlapping construction projects and bus-for-streetcar substitutions on 501 Queen, 503 Kingston Road and 504 King. Bus replacements are included in the bus peak service.
(**) Effective May 7, the peak service operated on Line 1 will fall to 52 trains raising the spare count to 24 and the spare:service ratio to 46%.
(***) The original value reported for the bus fleet was based on an incorrect fleet size from the CEO’s report. The correct values are shown in the next line.
The TTC has a lot of spare equipment, but does not have the budget to operate it. A typical industry value for the spare:service ratio is 20-25%.
What Is The TTC’s Goal?
A related problem to the limitations of raw stats is the question of what goal we expect of the TTC. Do the reported stats support arguments for better service and funding, and do they clearly show what is happening on the system?
Should the TTC maximize usage in raw counts of trips or boardings, or should it maximize utilization of service in a bid to minimize subsidy requirements? Is transit a core city service that should be as good as possible, or a cost centre to be squeezed for efficiency? One might argue that these are not mutually exclusive, in that a “leaner meaner” TTC could provide better service at lower cost, in theory. However, the debate is inevitably clouded by which side of the service vs cost divide one starts on, and which of the goals is the top priority.
On the TTC, service is under attack because the combined effect of lower ridership and falling post-covid subsidies force cuts on the system. New crowding standards, which for off-peak demand are less generous than in the pre-covid era, were implemented not as a studied update to the TTC’s Service Standards, but as a budgetary item. The base document still shows the old pre-covid standards.
- 2023 TTC Conventional and Wheel-Trans Operating Budgets at p. 26
- TTC Service Standards at p. 13
A major job for the TTC in coming years is to rebuild its service and ridership. This will not be helped with three-year old stats from “before times”, but instead we should see service and demand as they actually are and evolve. These numbers are, to some degree, buried in the CEO’s report, but are not organized in a way to allow tracking of overall system performance.
Counting the Riders
The TTC has three ways to report ridership effects:
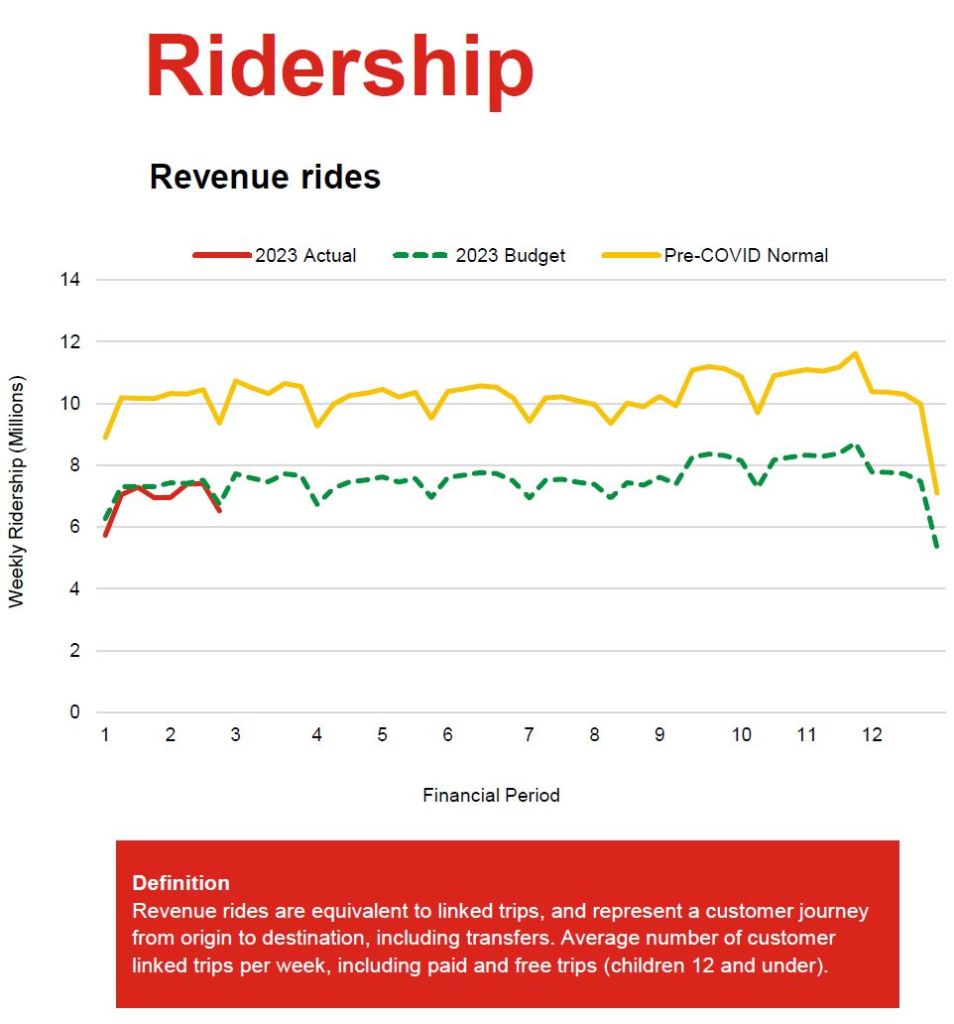
- Ridership: The number of “linked” trips, equivalent to what used to be purchased for one fare before the two-hour transfer. A “link” is the trip on one vehicle with the exception that subway-to-subway transfers are not counted.
- Boardings: The number of “unlinked” trips. This disaggregates the ridership number into the component links, again with the caveat that a subway trip counts as “one” even if you transfer.
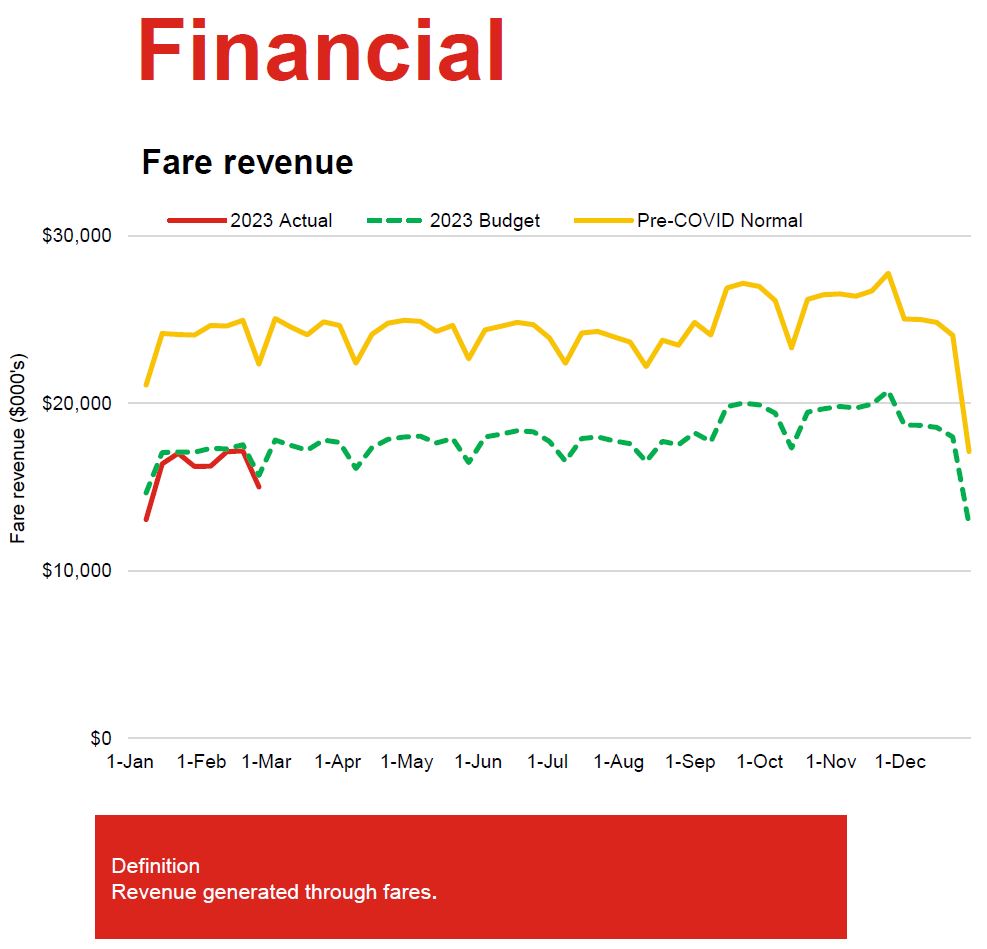
- Fare revenue: The amount of money paid in various ways be it cash or Presto card. The average fare is reported for budget purposes by dividing fares by rides.
Presto card usage shows a pattern also reported by Metrolinx: although the number of cards used in February 2023 is about 89% of the number used in early 2020, the number of taps per card is down. Riders who travel four or five weekdays per week are down from 70% of Presto users to only 58% while there are more occasional riders. Similarly, the sale of monthly passes is down by half from pre-covid.
This has implications for programs to rebuild ridership because luring new riders to transit is a very different problem from getting existing riders to use the system more. If the reason for a trip no longer exists (mainly commute to work), then no amount of enticement will restore that travel. Perceptions that the system will be more crowded and less safe also work against any marketing of transit as “the better way”.
Crowding
Service cuts fell on some routes like 29 Dufferin and 35 Jane that are notorious sources of complaints about crowding. Where are the ridership stats to justify these cuts? Is the problem that bunched vehicles are unevenly loaded, and “on average” there is room enough for everyone? Nothing in the CEO’s report establishes the justification for service reductions. What is needed is a route-by-route view showing where there are “hot spots” both in terms of crowding and of service reliability.
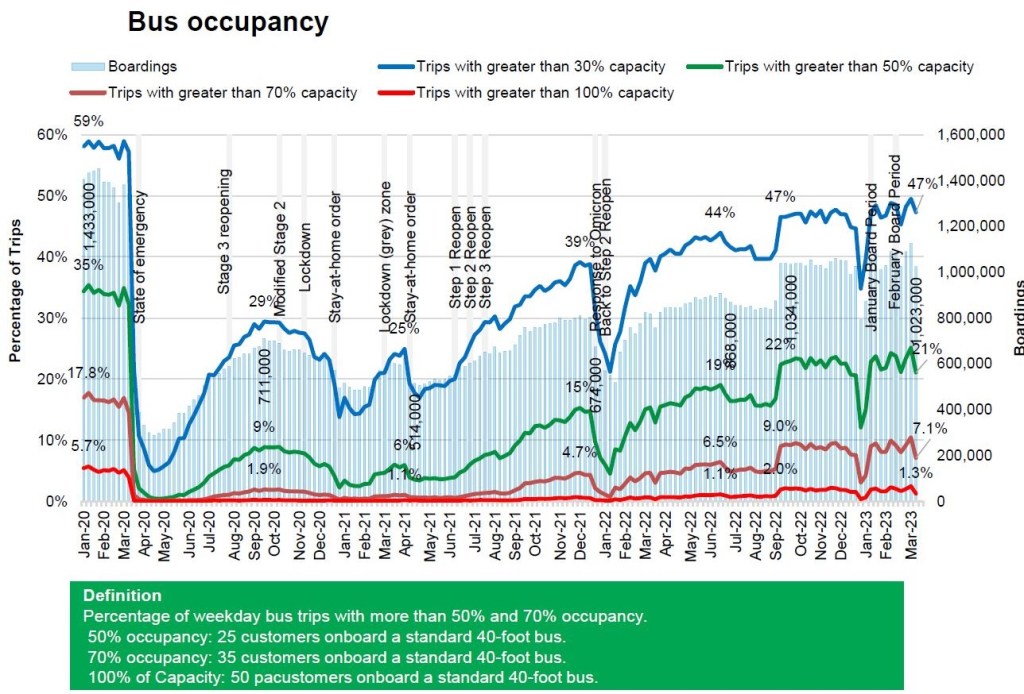
Bus occupancy numbers are reported to the end of March, and data have not accumulated yet to show he effect of new crowding standards and service changes on March 26 and May 7. Note that occupancy counts will be diluted by peak direction effects (counter peak trips tend to be more lightly loaded), and counts for all day on all routes hide the degree of problems where they exist.
In the chart below, the proportion of trips at various crowding levels was higher for all categories pre-pandemic. For example, the proportion of trips over 50% capacity is down from 35% in January 2020 to 21% in March 2023. This shows the effect of running more service relative to demand in 2023 than in 2020.
However, the 2020 figures are important in showing what average crowding looked like then. Less than 20% of trips operated at over 70% capacity even though packed buses and streetcars were a common experience on the network. The difference lies in the many trips outside of peak periods, on less-heavily used routes, and in counterpeak directions. Budget hawks point to partly-loaded vehicles as a symptom of “inefficiency” when it is a basic part of transit operations. The planning and budget challenges lie in balancing service attractiveness across the network with available resources. In turn, that comes back to the goal transit is expected to achieve.
On Time Performance
The TTC reports On Time Performance relative to scheduled service, but this has varied over time. It is nice to know that most of the scheduled trains operate as planned most of the time, but this brings two problems:
- There is little or no exception reporting even though we know from ongoing issues of security and other events that service disruptions are more common than in past years.
- There is no tracking of the change in service levels over time.
Where delays are reported, all types are lumped together including those due to planned activities such as construction, as opposed to unexpected delays. This muddies the view of which classes of delay are the major source of problems. We cannot address fixes to improve service without knowing which tactics will address the majority of problems.
On the surface network, “on time” is a rather elastic concept and is measured only at terminals. For frequent routes, it is possible for two buses to leave a terminal back-to-back and yet be considered “on time”. There is no measurement of service quality along routes, nor is there a time of day or day of week breakdown.
Even with generous margins for being “on time”, the TTC misses their target. Some of this is due to construction activities, and that begs the question of why the TTC pollutes reported stats by mixing together routes that are operating normally with those where there are ongoing disruptions. Moreover, one cannot help asking why schedules do not always allow sufficient leeway to deal with construction delays.
The TTC needs to rethink the way it measures and reports on service quality. Current metrics do not reflect what riders actually see, and only provide comfort for management who can claim that, on average, things are not too bad.
A further problem is that the magic (dare I say mythic) solution claimed for service problems is “run as directed” (aka “RAD”) buses. There is no reporting of their quantity of how they were used, nor do they show up in vehicle tracking data. Management can claim that they address service issues, but there is no way to prove this, let alone for riders to know in real time where these buses might be found.
Subway Service & Capacity
As an alternative view to the TTC’s presentation, here are charts showing the changes in subway service, measured as trains/hour, from January 2020 to May 2023 including pending cuts on Line 1 YUS. In each chart, the values are shown separately for each of the five service bands through the day. The initial cuts in 2020 are quite obvious, especially for weekday service. Weekend cuts were not as severe or immediate, and Line 2 BD saw little change except for a summer dip in 2021. Recent weekday changes are evident for both lines, as are weekend cuts on Line 1 YUS.
These charts give an indication of how much service has to be restored just to return to pre-pandemic levels.
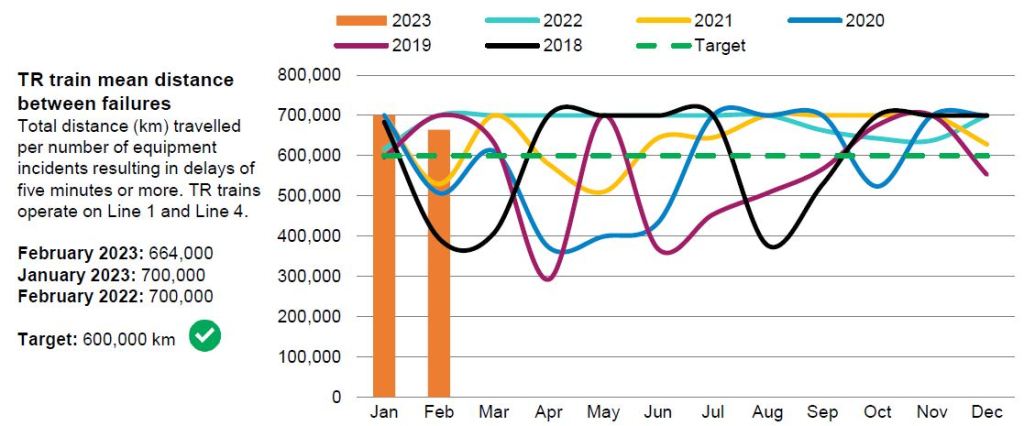
Vehicle Reliability
Reliability is reported using two metrics:
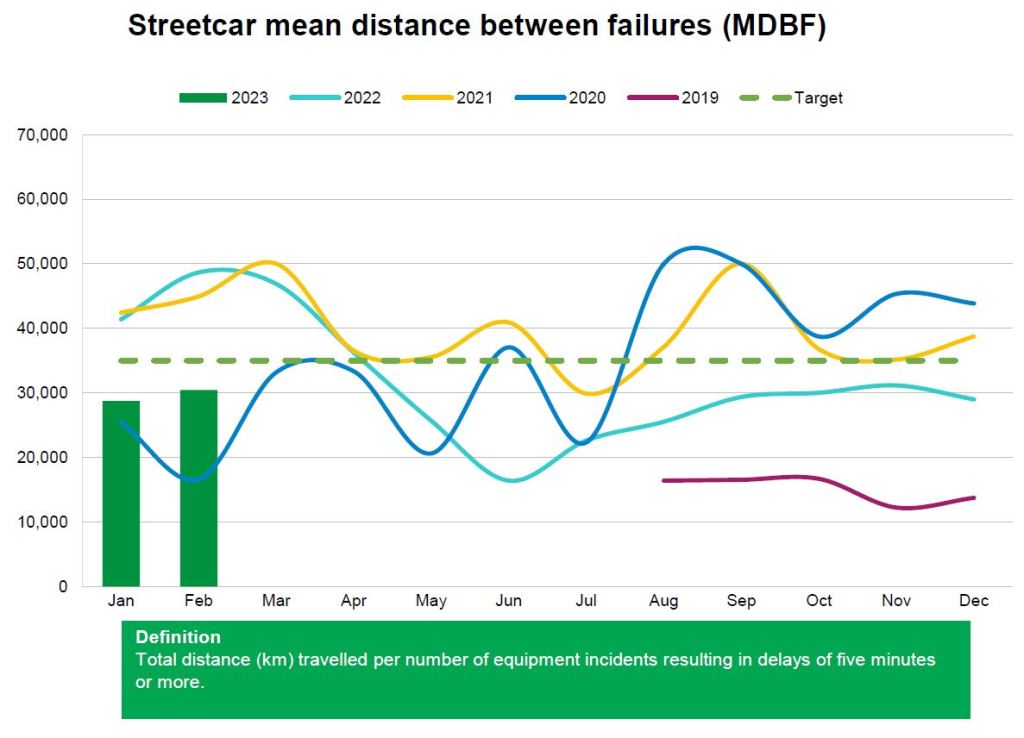
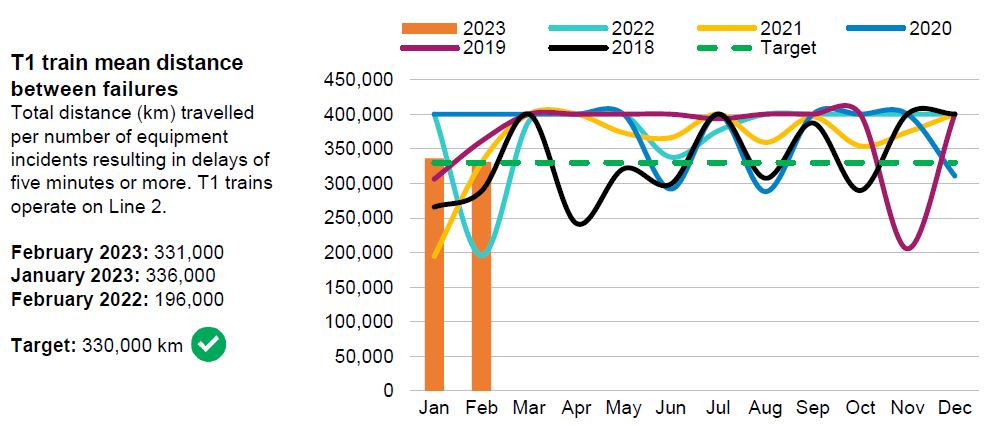
- Mean distance between failure (MDBF) measures how far vehicles travel between in-service failures measured in vehile kilometres.
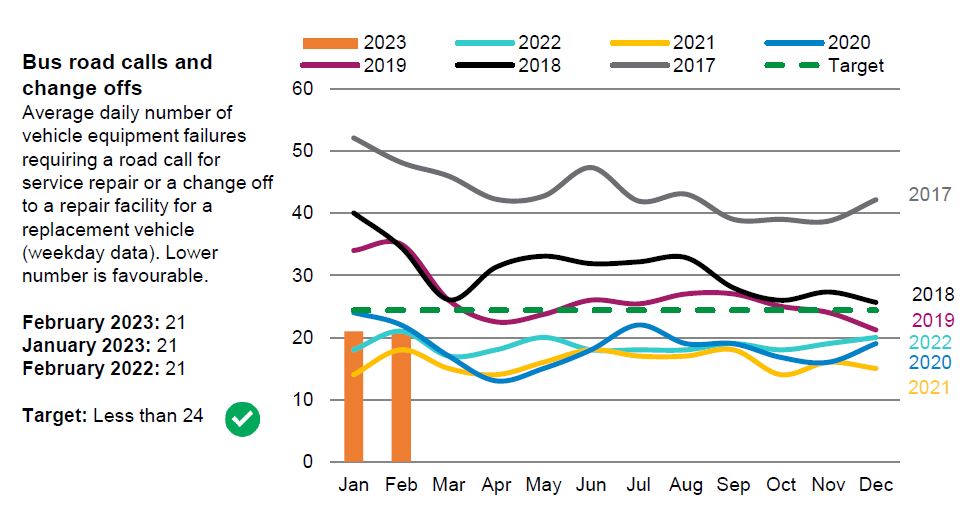
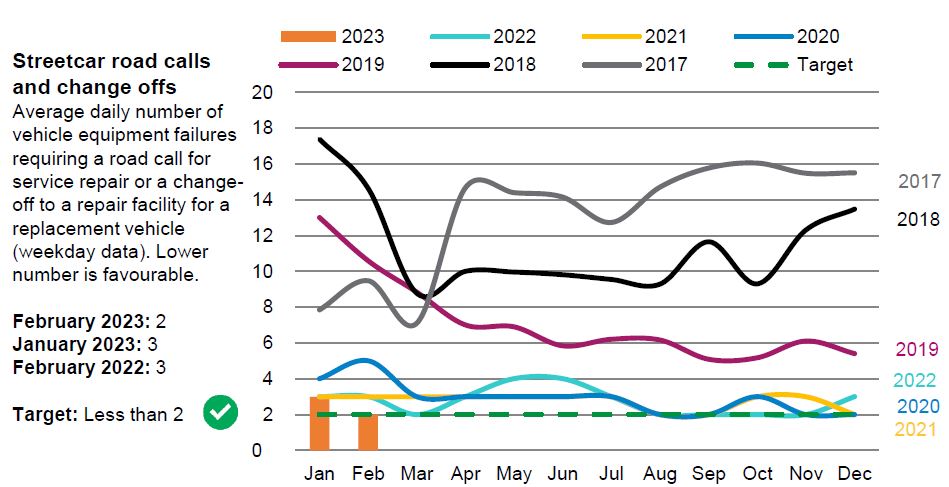
- Road calls and change offs (RCCO) is a raw count of the number of service failures per day requiring a repair truck or replacement of a vehicle in service. The target level is set relative to the peak scheduled service.
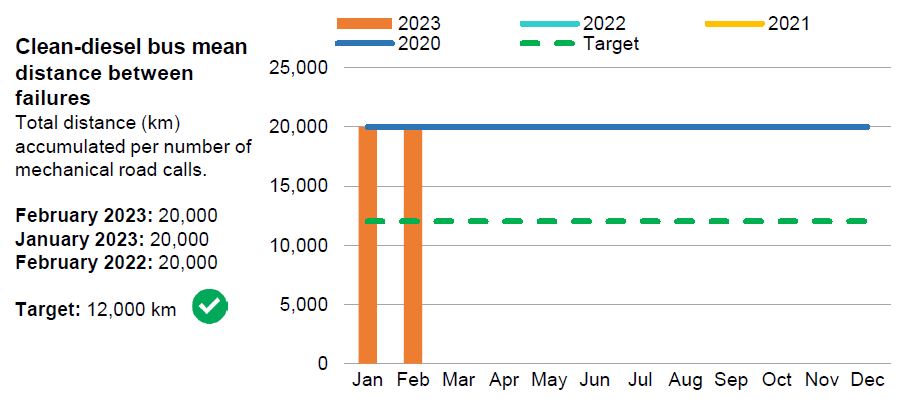
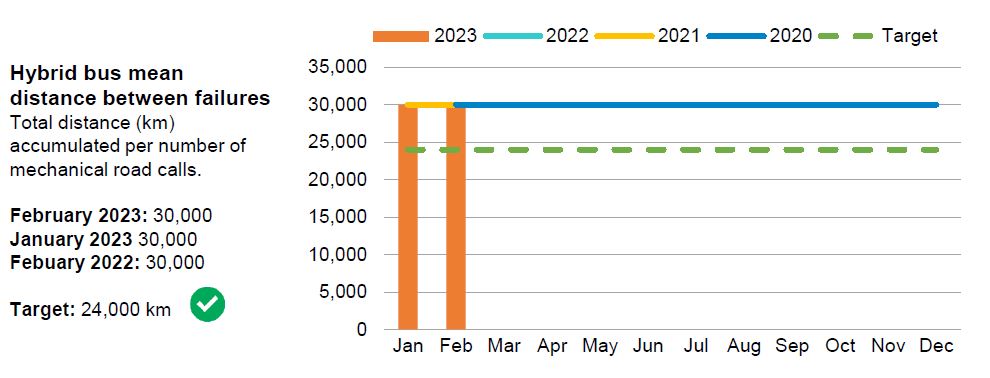
The bus MDBF numbers are reported in a misleading way in that diesel and hybrid values shown are capped at 20k and 30k km respectively with no indication of the variation above those levels. Both values are above the targets of 12k and 24k respectively. These charts are meaningless because they do not show actual performance levels.
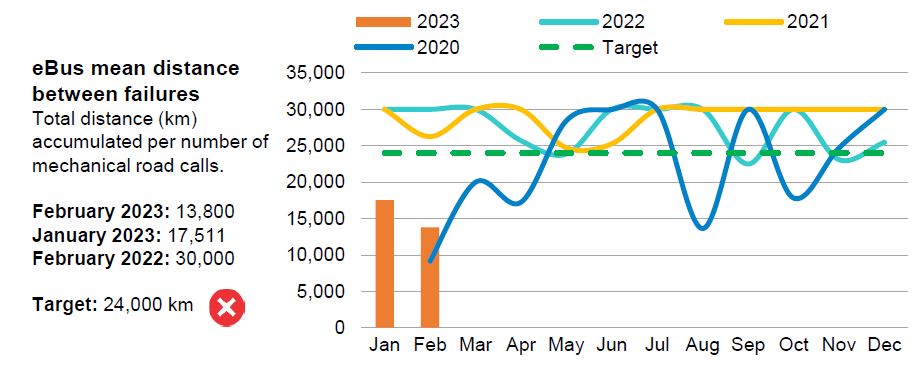
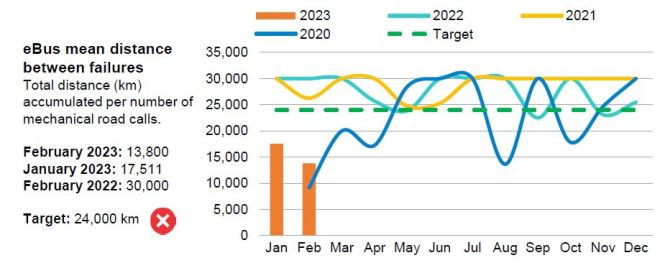
The eBus target is the same as for hybrids at 24k, but in this case we see the month-by-month variation including a recent severe drop in reliability.
By comparison, values for subway cars and streetcars show the actual values. There is a considerable variation from month to month. This does not reflect wild swings in fleet reliability, but rather the fact that there are few failures each month and so a small change in the number of incidents causes a big swing in the MDBF.
Road call counts for both the bus and streetcar fleets have improved over past years, especially for streetcars thanks to the retirement of old vehicles.
One unknown factor is the degree to which lower fleet utilization allows the TTC to field only the best vehicles while keeping less reliable ones in the garage.
Short turns
Short turns are reported for both bus and streetcar modes but, as I have shown in a separate article, the count of streetcar short turns is suspect and not all turnbacks are reported for the stats. This is a political issue because some Councillors see short turns and the associated complaints as a severe problem, and management obliges by restricting their use. This can be counterproductive when gaps and bunches remain in service that could be corrected with strategic short turns. Originally short turns were overused on some routes, and the simplistic fix of banning them was worse than the problem it supposedly fixed.
This problem is part of a more general challenge that whatever metrics one concocts, there is a good chance that actual service management will adapt to make the numbers look good with possibly unwanted side-effects.
Financial Update
The financial update reports the preliminary year-end 2022 figures for the TTC, subject to a final audit that will come to the TTC Board in June. Spending for the year was below the original budget forecast both because service did not ramp up to the level originally projected, and because extra costs for Line 5 Crosstown planned in the budget were not actually incurred.
A total of $72.6 million was saved relative to the budget of which $17.1 million was for lower than expected covid-related costs, and the remaining $55.5 million a saving on the base operating budget.
Savings were offset by lower than expected fare revenue and by higher diesel fuel costs.
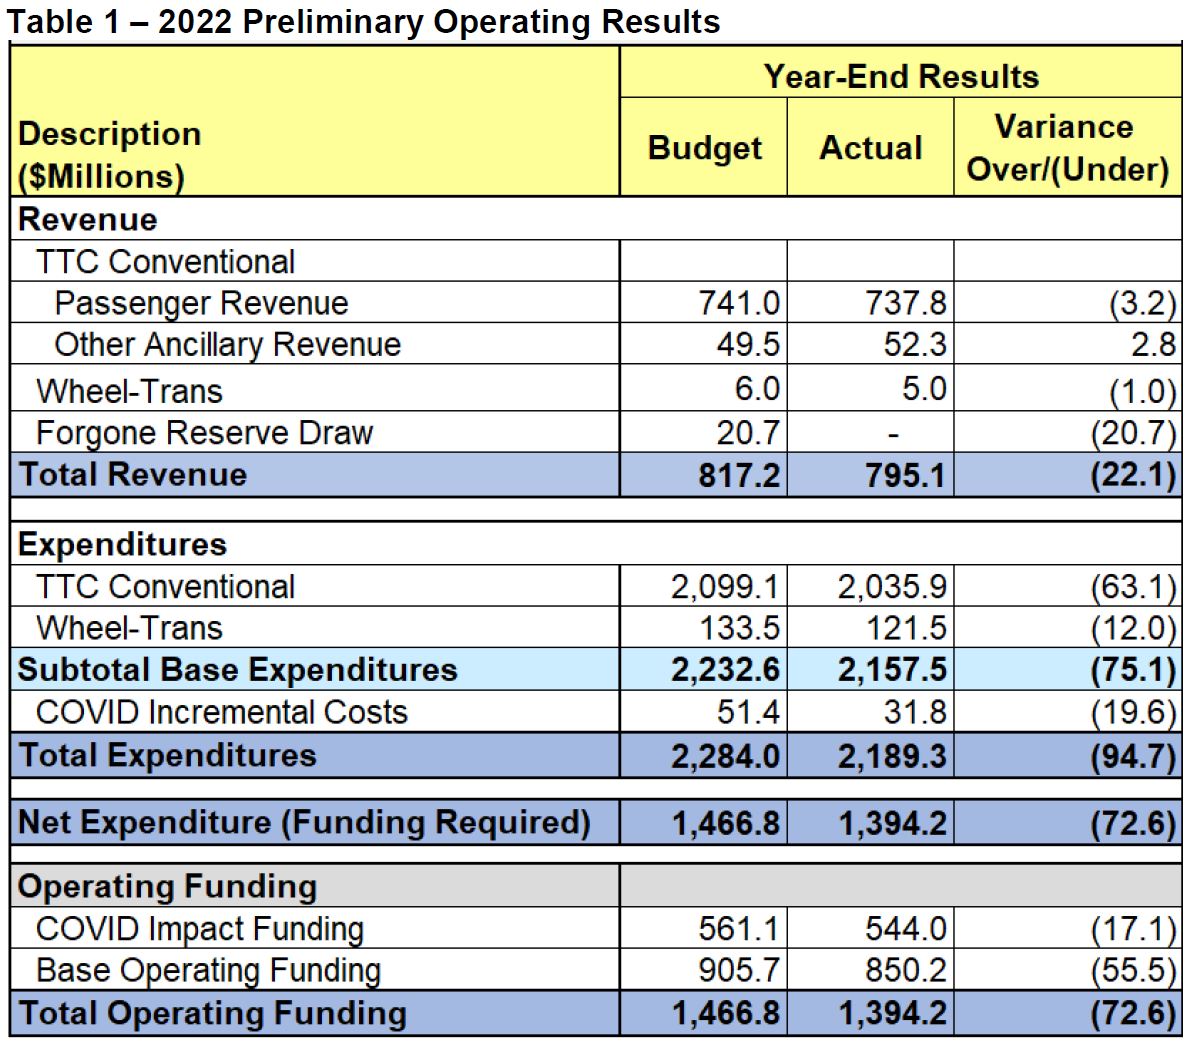
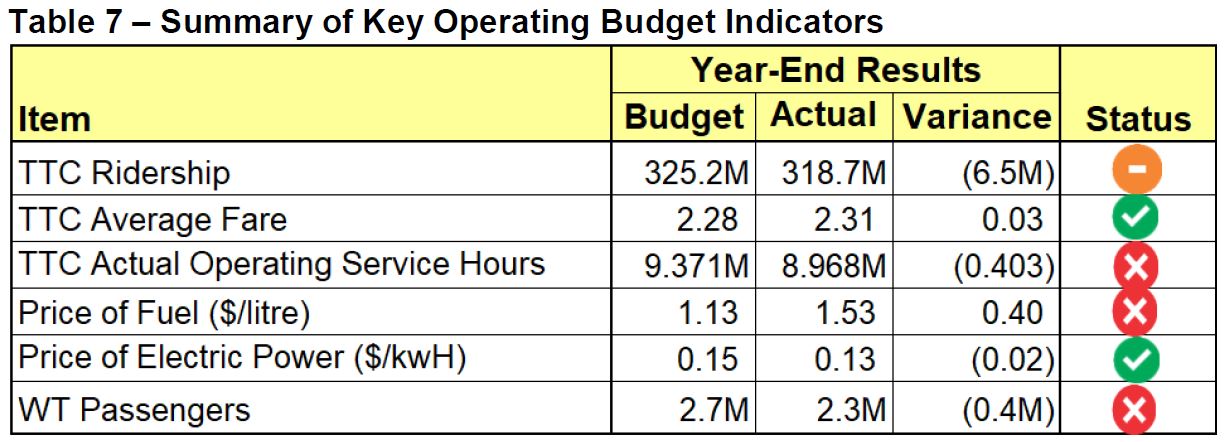
Ridership was below expectations both for the conventional and Wheel-Trans systems, although this was slightly offset by a higher average fare per trip. The service hours provided were about 4.3% below the budgeted level. The average price of diesel fuel was substantially higher than planned in the budget and this higher value continues into 2023 at a budgeted level of $1.50/litre. Total spending on diesel fuel in 2022 was $109.9 million.
For a much more detailed review of the TTC budget and results, please refer to the report.
Major Projects Update
The Major Projects Update includes several key projects some of which are described below. What this report does not address is the very long list of unfunded projects and the competition for funding that these represent both at the City/TTC level and for their provincial and federal “funding partners” whose generosity is in decline in the post-covid era.
Notable among the long list is a collection of projects to improve capacity on Line 2 Bloor-Danforth, and a project to install Platform Edge Doors across the system.
Line 1 Capacity Expansion
This is an almost $6 billion collection of projects running through the next two decades to add capacity to the Line 1 Yonge-University-Spadina subway. It includes many components, but much of this project has not be funded, or is proceeding only at the early design stage.
- Station capacity increases to handle larger passenger flows from more frequent service
- Traction power upgrades to handle more closely spaced service
- Fire ventillation upgrades to meet modern codes in light of increased station usage
- A new yard and maintenance facility with capacity for 34 trains
Some work is already in progress:
- St. Andrew Station modifications (in construction)
- King Station concourse and additional entrance (in design)
- Fire ventillation upgrades at Markdale ESB and St. Clair West Station (in design)
Pending work includes:
- Design of a new siding track between Bloor and Rosedale Stations
- Design for negative reinforcing cables from Vaughan to Sheppard West
For complete info, please refer to the report.
Separate from all of the above will be an increase in the fleet for Line 1 to handle both the Yonge North extension and planned service increases (assuming demand returns to and above pre-covid levels).
Bloor-Yonge Station Expansion
This $1.5 billion project is now in its early stages. The pre-qualification process is underway, and three proponents will be selected for a Request for Proposals to be issued in Q2/Q3 2023.
For more information about this project, please see Bloor-Yonge Station Expansion Update.
Line 1 ATC
Line 1 YUS is now operating entirely on Automatic Train Control, but there is an enhancement phase now in progress. This includes support for the relocated train stopping position and platform at Eglinton Station, fixes related to the Osgoode Station “near miss” incident, and other fine tuning of the system. Cutover of this upgrade is planned for Q2 2023, with the implication that Line 1 weekends shutdowns for installation and testing will end soon.
Fire Ventillation and Second Entrances
This $2.3 billion project is only partly funded. It includes upgrades at several locations some of which are consolidated with other work such as the Crosstown expansion at Eglinton Station and the much expanded Bloor-Yonge Station. Among the second entrance projects is Dundas West Station’s link to the Bloor GO/UPX Station which is in the tendering stage.
See the report for more details.
Stations Transformation
This is a relatively small project at $50.8 million to convert stations to a new customer service model, to improve communications and public announcement quality, and to add/upgrade security cameras.
With the recent interest in system security and safety, it would not be surprising to see the scope of this project grow.
Among the hoped for improvements is real time monitoring of escalators and elevators so that staff can be notified promptly when there is an outage and service can be restored quickly.
Purchase of Buses
This is a $3.8 billion project covering purchase of new buses from 2018 to 2036. Needless to say, this is not fully funded. The eBus program (see below) awaits federal funding under a special subsidy program.
New hybrid from NOVA and New Flyer are now in production, with deliveries expected to complete in Q2 2024.
Purchase of Streetcars
The TTC has ordered an additional 60 Flexity streetcars from Alstom. The first car delivery is expected to enter service in Q3 2023, with the full order delivered by 2026.
The update is silent on the project to expand system storage capacity by converting a portion of Hillcrest Shops as a carhouse for the 512 St. Clair line.
Presto Fare Collection
The overall Presto project is running behind schedule with many contracted items still not delivered. There is a catch-22 here in that some functions cannot be implemented until Presto goes through a major upgrade to is back-office systems, but that change could run up against the timelines for a TTC decision to extend or cancel their contract with Presto. I will write about Presto issues in more detail in a separate article.
eBus and Net Zero Program Update
Information about the eBus program is scattered in three separate reports on the agenda.
In the CEO’s report, we see that the mean distance between failures (MDBF) for the 60 eBuses is well below the target value. The data are not broken out by vendor. Here is the eBus chart again. The performance of this fleet is well below the target level and below the reliability of the diesel buses that would be replaced. This is a major reliability exposure for future service quality.
Authority to award a contract for about 340 eBuses was delegated to the CEO in 2022 because this process would overlap the election. According to the Major Projects Update:
All stages of the procurement process have been completed and the contract is ready to be awarded, subject to federal funding. [p. 44]
The successful bidder(s) have not been announced, nor is there any analysis of the difference between performance of the test fleet and expectations for the new buses. This lack of transparency is troubling because we will probably wake up to a press release some day with no supporting rationale for the TTC’s choice.
The CEO’s report shows the anticipated transition to a Net Zero fleet over coming decades in the chart below. Although the TTC might be buying some eBuses starting in 2023, it will be many years before they reach an all-electric fleet. As of the end of March 2023, the bus fleet contained 1,391 diesels, 590 hybrids and 60 electric buses according to the Scheduled Service Summary [see p. 70 for fleet details].
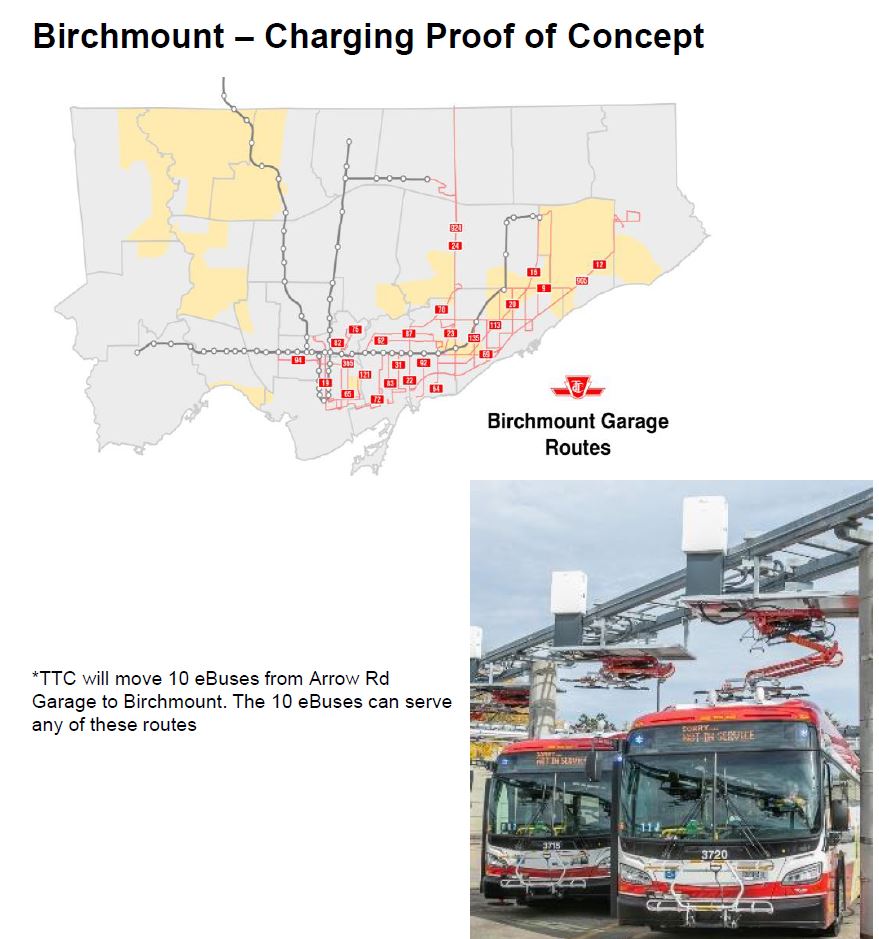
An important technical change in TTC plans is the testing of pantographs for overhead power pickup and charging. The CEO’s Report illustrates a trial setup at Birchmount Garage where 10 buses will move from Arrow Road Garage.
This type of charging requires less space than the plug-in units installed for the initial 60-bus trial, and has safety advantages for staff who do not have to handle charging cables. This charging technology could also be used for on route charging at layover points where buses could be “topped up” without returning to the garage. Although the TTC touts this as if they are leading the pack, this type of charging is already used in other cities, including neighbouring Brampton.
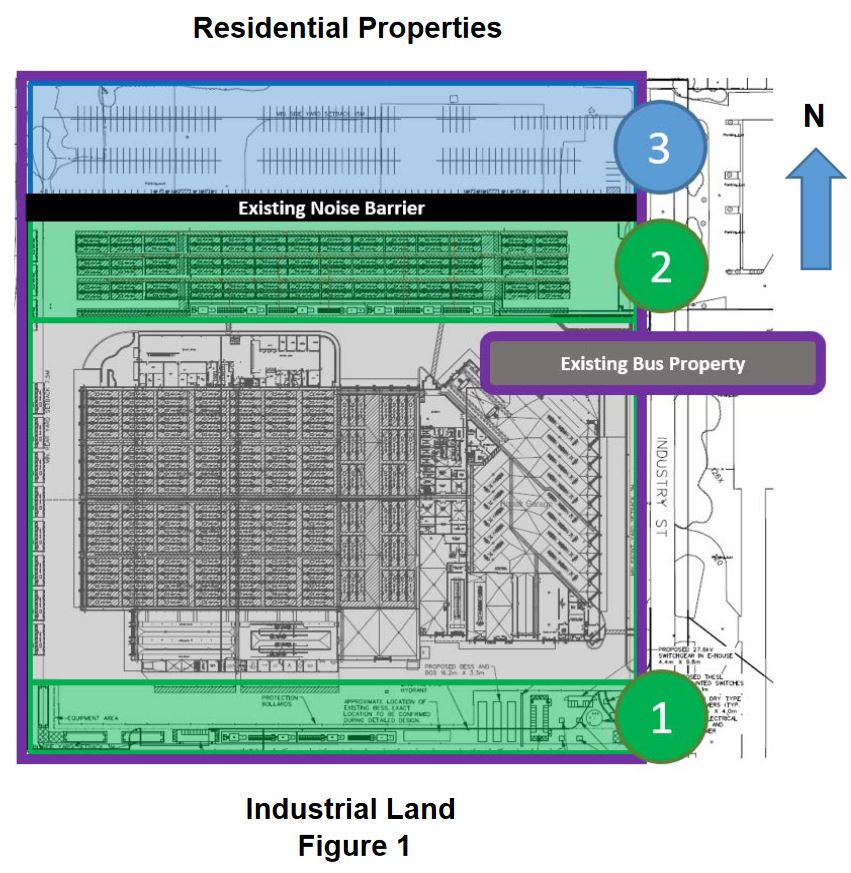
Finally, a report on Mount Dennis Garage proposes to reconfigure the site to accommodate charging equipment. This equipment would go along the south edge of the site (area 1 in the illustration on the right above). Buses now stored there would shift north of the building (area 2), and staff parking would shift to an underused are at the north end of the site (area 3). The upshot is space for an added 46 standard sized (12m) buses.
The report notes:
To date, the Green Bus Program has resulted in fleet-wide emissions dropping by close to 20% – to 1.33 kg of CO 2e per km from 1.65 kg of CO 2e per km – through the introduction of 255 hybrid-electric buses and 60 zero-emissions, battery-electric buses (eBuses). Over the next two years an additional 336 hybrid-electric buses will be available to serve TTC customers, and the TTC will have one of the largest low-to-zero emissions bus fleets in North America.
Overall, the TTC’s bus fleet is forecasted to increase by up to 300 buses over the next 15 years. In addition, the TTC plans to begin steady-state-procurement of only eBuses to remain on track to achieve zero emissions by 2040. As part of the Green Bus Program, Mount Dennis Garage is slated to receive 35 eBuses in 2024 and 42 in 2025.
Lastly, the electrification infrastructure being installed at Mount Dennis Garage over the next two years will include provisions for approximately 300 eBuses through to 2035 when this location is expected to reach 100% electrification.
The forecast increase of 300 buses in the fleet, about 15% over 15 years, does not portend a huge increase in bus service. Additional buses will be released by the opening of various rapid transit lines over the coming decade, but this will still be a far cry from a proposal in the City’s Net Zero strategy to substantially increase transit service. That proposal has not been endorsed by Council, but should they pursue such a goal, there are major implications for fleets and garaging, not to mention capital and operating budgets.

I’m a reasonable person and I believe in good faith discourse but I’m just really angry about this. As someone that works non-standard hours (because I’m poor), has to take multiple subway/bus transfers (because I’m poor), HAS to take the TTC (because I’m poor) and doesn’t have any meaningful influence over city, provincial, or federal politics (again, because I’m poor), I’m really angry that the three sets of government couldn’t work together to avoid service cuts. These cuts are going to add significant uncertainty to my travel time over the period of the rest of the year, the only way I can address it is by investing more time into the commute, thus reducing the time I spend with my family even more. I couldn’t read further into your blog post because I’m so furious. I’ve emailed my representatives, the federal ones don’t even have the courtesy to reply, the provincial ones gave me a word salad reply, and the city councillor tried doing something about it but got steam rolled.
LikeLike
Using pantographs and having charging locations at terminal points/on route is sort of like trolley buses? Maybe? If you squint a little?
LikeLike
I wonder how accurate the streetcar ridership figures are, given it is the only mode without controlled entry (POP), a low proportion of customers tapping and no APCs. These factors could result in significantly underestimating streetcar boardings.
Steve: About half of the streetcar fleet is supposed to have APCs now.
LikeLiked by 2 people
They only run 123 out of 204 (202) cars right now so what’s the plan when the 60 new cars start arriving later this year? Is the plan then to run 123 out of 264 cars while keeping 141 cars in idle storage for a sparkling spare ratio of 53%?
Steve: Eventually 501 Queen, 503 Kingston Road, 504 King, 506 Carlton and 512 St. Clair will be back to their full lengths, but even that will not soak up all of the fleet with the service cuts. The Waterfront LRT is a project for the late 2020s and early 30s. It’s going to be interesting.
LikeLiked by 2 people
Who are you endorsing for mayor? Gil Penalosa again of course? Gil Penalosa finished a close second last year and is our best chance to prevent a right wing mayor from getting elected. On the other hand, Josh Matlow has vowed to cancel the Scarborough subway and revert back to LRT if elected mayor. Fascinating race ahead.
Steve: I have not decided whether I will make a formal endorsement, certainly not until much later in the campaign when platform details are spelled out. Penalosa is not even a formal candidate yet. He was not a “close second” and obtained 98,525 votes compared to John Tory’s 342,158.
It is not in the City’s power to undo the Scarborough subway decision as this is a provincial project and it is already under construction. I think that your impression of Matlow’s position on the issue might date from a time when reverting to LRT might have been possible.
LikeLiked by 1 person
I didn’t see the edge doors project, only sliding doors which is part of easier access and I assume for the front doors, not the platform doors…
Steve: I am not sure what you refer to here by “sliding doors” and “front doors”. Do you mean the entrance doors to stations which, yes, are part of accessibility changes? Platform doors are in the 15 year capital plan at page 42 with a projected cost of $2.868 billion and no committed funding. They are not in the Major Projects Update becuase this is not yet an approved project.
LikeLiked by 1 person
*Sigh* Why is it that the list of unfunded projects is the ONE thing that is REPEATEDLY completely ignored over & over again by all the higher-ups in charge (at least from the government side, not sure how much those on the TTC side are pushing for funding, but I guess not that much)
LikeLiked by 2 people