Many changes will affect TTC operations with the onset of summer schedules for 2016. These include both the usual seasonal changes to service levels, several construction projects affecting routes, and the restructuring of routes serving the waterfront.
Updated May 24, 2016 at 7:30 pm: Preliminary information on construction diversions at Broadview Station has been added to this article.
2016.06.19 Service Changes
The information in the spreadsheet linked here is organized into three sections:
- Routine, mainly seasonal, changes
- Groups of changes related to specific projects and route reorganization
- Construction project calendar

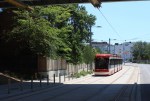
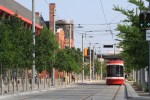
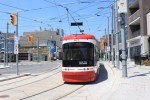
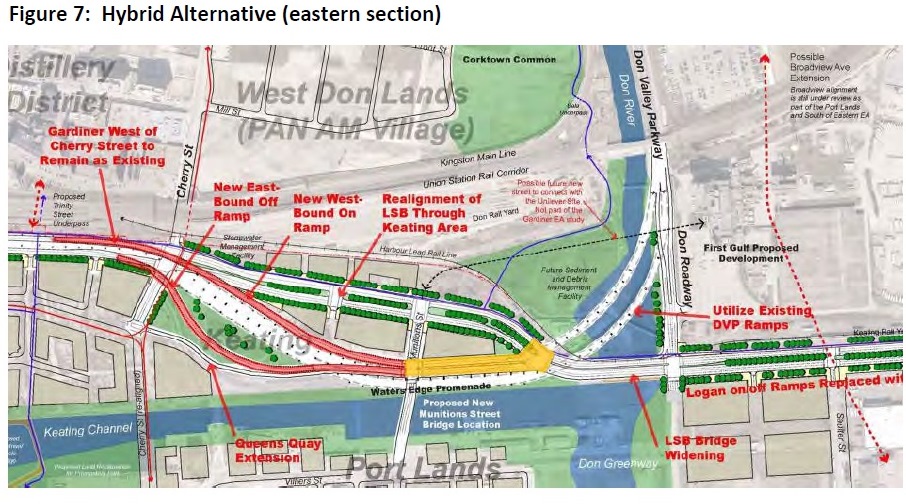
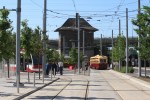
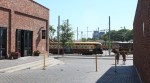
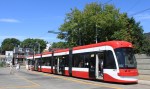
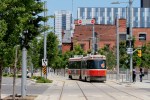
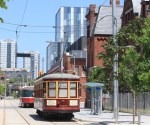
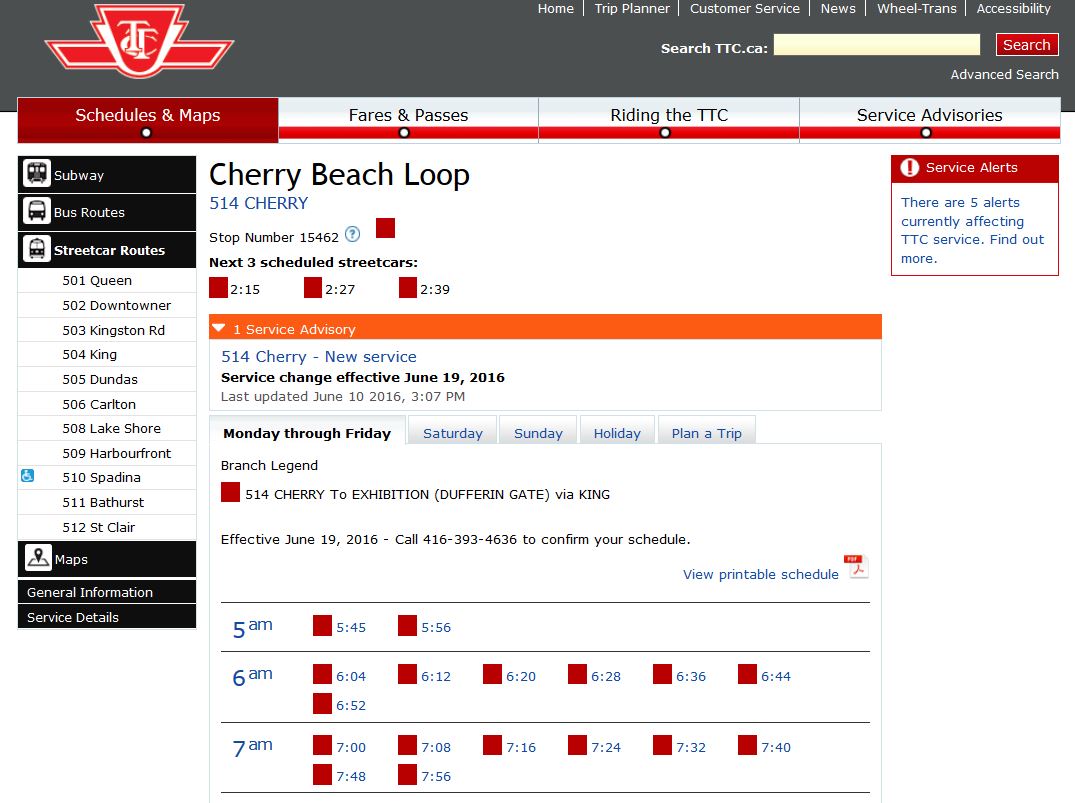
The 514 Cherry streetcar route begins operation running via a short spur south from King to Distillery Loop. Initially this will run with a mix of Flexities and CLRVs pending an increase in the fleet of new cars. Eventually track on Cherry will extend under the rail corridor and south into the Port Lands, but that is a project still years away and subject to the usual wrangling at Council about capital spending priorities.
In the 2016 Budget, the TTC Board and Council chose not to fund the new service with additional money, and so this operation will be implemented by cutting service on the outer ends of the 504 King route. Peak service will operate every 8-9 minutes, and off-peak periods, the line will operate on a 15 minute headway with five cars. A blended service on King is impractical given the large difference in frequencies between the 514 and 504 routes. Whether the Cherry cars actually pull out onto King into gaps and carry passengers, or merely slip in behind King cars and let them do the work remains to be seen.
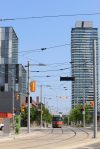
The 172 Cherry Street bus has been replaced by an extended 72 Pape over a new route serving Queen Quay East, and by a new 121 Fort York – Esplanade bus that will operate on, at most, 15 minute headways, a considerable improvement over the former 172 Cherry.
Sunday Stops
The TTC continues its program to remove Sunday Stops from the system with removal of stops at the following locations.

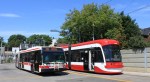
Streetcars Return due to Bus Shortage
With the onset of construction season, and despite the summer service cuts, several streetcar routes will be partly or completely replaced by buses: 512 St. Clair, 511 Bathurst, 506 Carlton. This will be offset by the return of streetcar service to the 502 Downtowner and 503 Kingston Road Tripper lines, as well as full streetcar service on 504 King with no bus trippers. Service will likely revert to combined streetcar/bus operation in September thanks to the late deliveries of new Flexity streetcars by Bombardier.
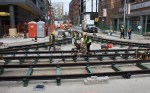
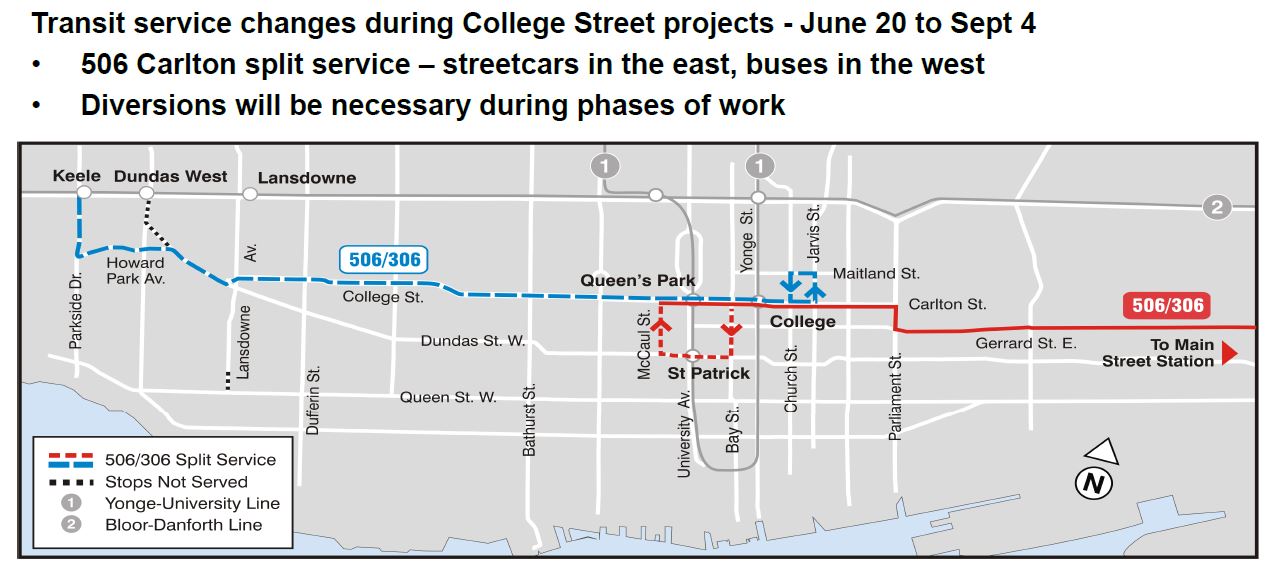
Construction Work on College Street
Several projects on College Street West have been timed to occur over the summer of 2016.
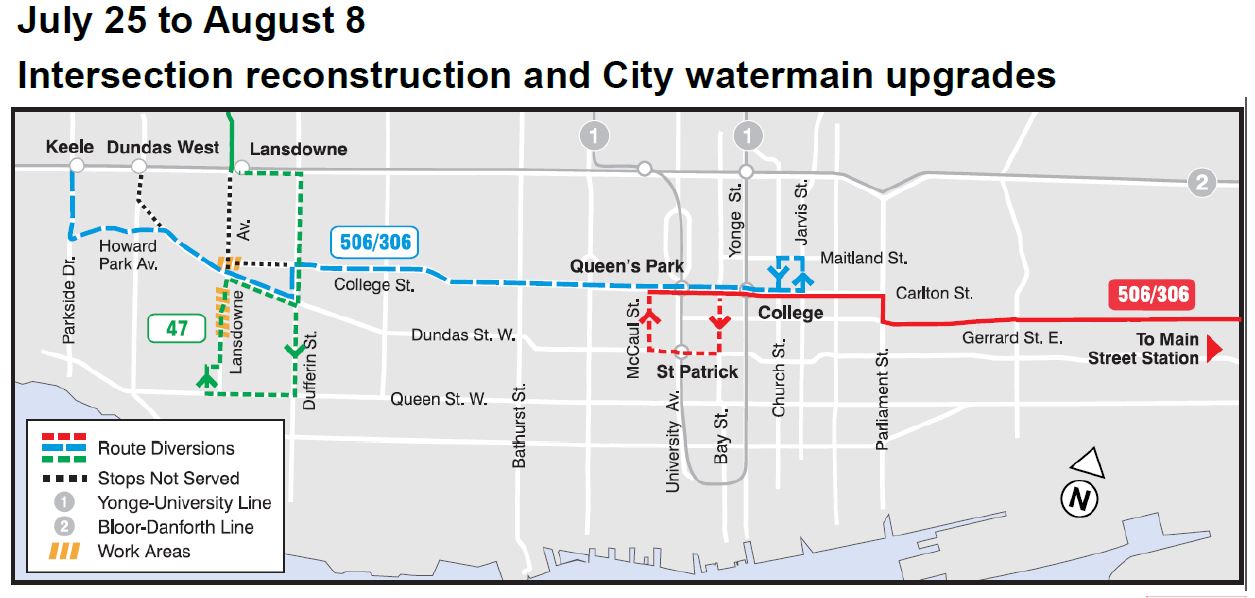
- Special track work replacement at Bathurst and at Lansdowne
- Removal of safety islands at Bathurst eastbound and at Bay Street both ways
- Expansion of the safety island westbound at Bathurst
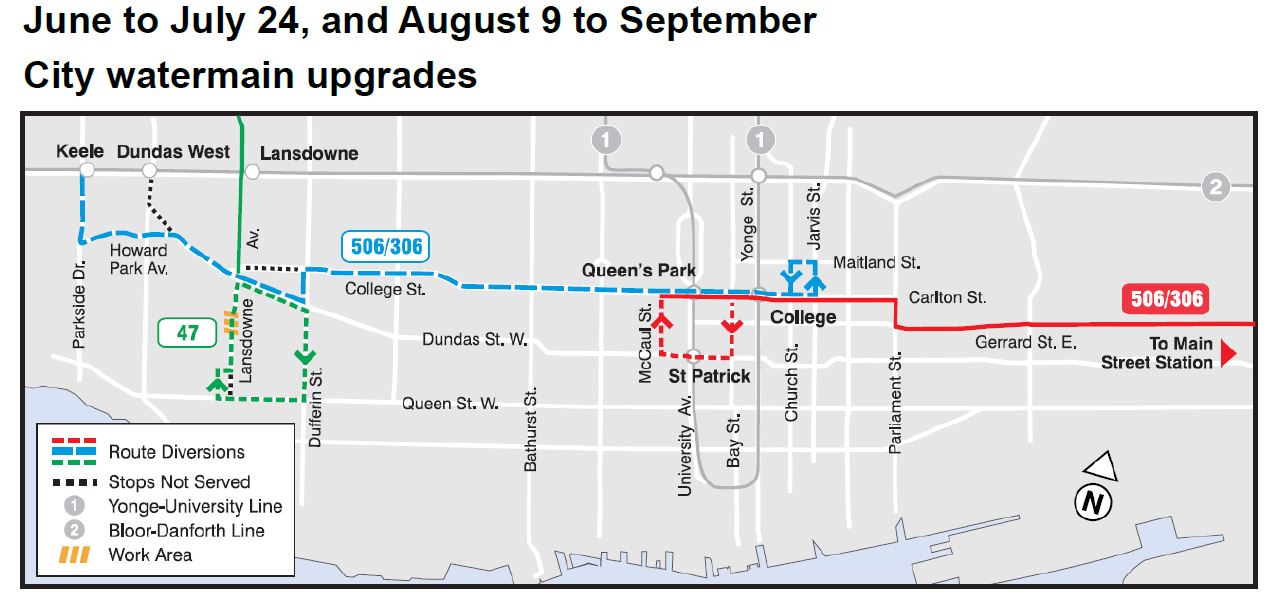
- Water main upgrades on College and on Lansdowne
- Streetscape improvements on College
The effects of these will be:
- 506 Carlton will operate with buses in the west and streetcars in the east on weekdays, and with buses over the entire route on weekends. The weekday services will overlap between Church and Bay. This will continue throughout the summer.
- 47 Lansdowne will divert around the construction area via Dufferin Street.
- 511 Bathurst will be operated by buses until the next schedule change at the end of July diverting around construction via Spadina between Harbord and Dundas.
- The 509/511 bus shuttle on Fleet Street will be replaced by the 511 bus service.
Details of the service diversions are in a separate article.
When streetcar service returns to Bathurst Street, the cars will operate into Exhibition Loop so that through service is provided until the Labour Day weekend. In September/October, service will be cut back again to Fleet Loop for a track replacement project in Exhibition Loop.
St. Clair Construction
Major construction work at St. Clair and St. Clair West Stations will require removal of streetcar service over the summer and early fall. The approach ramps at St. Clair West were not rebuilt during the line’s reconstruction, and the track must be replaced. The entire 512 route will be operated with buses through the summer, and streetcars will return from St. Clair West to Keele in September. Full streetcar service will resume on the Thanksgiving weekend in October.
Buses will not be able to enter either station during this project. At St. Clair Station, all bus service will loop on street via Avoca, Pleasant Boulevard, Yonge and St. Clair with transfer connections at the Pleasant Boulevard entrance. At St. Clair West Station, the 90 Vaughan bus will be extended south to Bathurst Station, and routes 33 Forest Hill and 126 Christie will be interlined. All buses will make an on street transfer connection at St. Clair West.
Broadview Station Construction
The bus loop at Broadview Station will be rebuilt over the summer and all bus services will loop on street via Erindale, Ellerbeck, Danforth and Broadview using an on street transfer. Given the frequent congestion of streetcars on Broadview awaiting entry to the station, the bus service will add to the congestion at Danforth northbound. The arrangement of on street stops for the four bus routes affected here has not yet been announced. Running time has been added to allow for the around-the-block loop except in cases where there was already enough recovery time in the existing schedule.
Updated May 24, 2016: Brad Ross at the TTC has provided the preliminary construction notice for the service and street changes. In addition, the Brick Works shuttle bus which normally loads on Erindale outside of Broadview Station will be relocated to Chester Station.
Bayview Services Reorganized
Peak period frequent service on 11 Bayview now ends at Davisville & Bayview, but this will be extended to Sunnybrook Hospital with every second bus running through to Steeles.
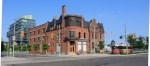
The 28 Bayview South route serving the Brick Works now operates only on weekend daytime hours, but will provide service during all periods.
Victoria Park North
Service in York Region on Victoria Park will now be provided by York Region Transit. The 24D Victoria Park branch to Major Mackenzie will be dropped and all service will turn back at Steeles Avenue. The 224 Victoria Park North route will cease operation.
Richmond Street Construction
All Downtown Express services will divert westbound from Church to Peter while Richmond Street is rebuilt from Victoria to York. Whether there will be any provision to assist the left turns west-to-south at Peter that will block 501 Queen Service (itself forced to divert and turn south at Spadina for water main construction) remains to be seen.