From time to time, readers mention in comments the common delays at Spadina Station caused by the manner in which streetcars unload and load at the platform.
Before the introduction of the new Flexitys, cars would enter the station, unload at the east end of the platform, then pull ahead to load at the west end. There was even enough room that three cars could be on the platform at once with one ready to move forward into the loading zone as soon as room was available.
However, with the longer Flexitys, two cars will not quite fit on the platform, and although there are still separate unloading and loading stops, in practice only one car can be on the platform at a time. When this is compounded with delays for crew changes and with the siestas some cars take while loading, delays to passengers waiting to get off of arriving cars are chronic and lengthy.
I asked the TTC’s Brad Ross why cars did not make better use of the space.
An option that comes up is for the loading car to pull slightly beyond the platform and not open its front-most door. This would allow the following car to come fully onto the platform and unload. The front of the loading car would not be in the tunnel itself, but adjacent to an unused area of the platform at the west end.
The reply from the TTC is:
- It is not possible to isolate the front doors of the LFLRV. If the streetcar were to go past the glass barrier to allow a second streetcar to access the platform, we would not be able to open the remaining 3 doors, while keeping the first door closed. All doors would closed but enabled, and would require our customers to push the door button to gain access to the streetcar. In addition, we would not be able to prevent anyone from opening the first set of doors from the inside of the streetcar (or even from outside, should a customer go around the glass wall and push the button). This is a huge safety issue, as the front doors are not flush with the platform at that position, and customers would have to step down to the rail bed.
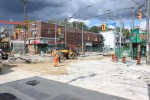
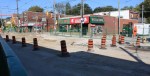
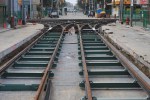
- One obvious solution would be to extend the platform so that it does sit flush with the front doors, but that is not an option at this point. The issue actually lies with the structural pillars that support the station; they are too close to the streetcar to allow proper egress. This is where I am seeking clarification from the Construction group. I am unsure of which pillar is in the way and what the actual requirement is, but have heard that it would cost millions to relocate the pillar to allow us to extend the platform. That is why that section of the platform is not being used and the glass partition is in place.
This begs the rather obvious question of why it is not possible for an operator to selectively open doors on a car. It is not unknown for vehicles to be in locations where a physical barrier would prevent use of all doors. In the specific case of loading at Spadina Station, the loss of the comparatively narrow first door would be a good tradeoff for simply getting a car far enough into the loading area that its follower could unload behind it.
I await further feedback on the matter of the cost and practicality of modifying the station, but in the meantime, it is useful to look at this problem in the manner we normally see for evaluations of expensive rapid transit projects: the value of riders’ time. Billions in spending on rapid transit has been justified by the premise that people will move more quickly and thereby save time, time that has a value against which the capital investment can be offset.
(This is a dubious proposition because the public investment is “balanced” against a private saving in “money” that can never be recaptured, but stay with me for the purpose of the exercise.)
- There are 15 cars per hour attempting to serve Spadina Station. If we assume that each car is delayed by an average of 2 minutes, and that it has an average of 50 passengers, this translates to 1,500 minutes of passenger delay per hour.
- If this condition persists on average for 8 hours per day, that means there are 12,000 passenger minutes of delay, or 200 passenger hours.
- The value of riders’ time is often quoted at about $30/hour, and this means a value of lost time of $6,000 per day. Scaling up to a year with a 300:1 factor (counting weekends as one day) gives us an annual lost time value of $1,800,000.
It is self evident that any of the variables used here can be tweaked up or down, but this gives the general idea of how the calculation would come out. Of course the City cannot “spend” that $1.8 million to offset reconstruction at the station because it is not real money, as I’m sure we would be told by the financial boffins.
In addition to any notional saving that riders might obtain, there is the real cost of, probably, one extra car on the Spadina route thanks to the extra running time needed to serve Spadina Station Loop.
There is a real need for the TTC to sort out operations at Spadina Station to minimize delays. This should include both figuring out how to use the loading area with a car projecting slightly beyond the platform and ensuring that crew changes happen as briskly as possible.
I will update this article when/if more information becomes available.
Updated Aug. 14, 2017 at 4:05 pm
Based on Twitter feedback, a few comments are in order.
In this article, I did not refer to explicit methods of crewing, but used the term “drop back” on Twitter. Some took umbrage saying that the term is “step back”. In fact both terms have been used over the years. It is the mechanism that counts, not the name. The idea is that operators get a break without the car having to sit there while they take it. To do this, there are more operators than cars, and an operator from car “n” “steps back” to car “n+2” (or whatever) so that they get a break of, in theory, two headways (the number can vary depending on how long a break is desired). This works fine as long as the operator who is supposed to take over an incoming car is actually available when it shows up.
At a location like Spadina Station, there is no stacking space to accommodate late crew changes whether they are part of a step back system or a regular shift change, and the problem can be compounded when the home division for the line is a long way away, and operators have to travel to pick up their cars in service.
Delays of cars getting on to the platform because of the loading techniques just make this worse by holding cars in the tunnel.
My aim in writing this article was twofold:
- Everyone involved – TTC management, planners, line supervisors and operators – need to work together to find a way to improve operations at this busy station which have deteriorated noticeably since the new cars were introduced.
- The principle of “value of riders’ time” is often used to justify big ticket capital projects, but it does not have the same clout in day to day operations.