
TTC Waffles On Reduced Crowding

Following my recent article in NOW, the TTC replied to my request for clarification of their position on crowding and how it would be addressed in their 2020 budget.

The TTC’s Stuart Green emailed on Tuesday, January 21, 2020:

The increase of 89,211 hours is comprised of the initiatives outlined in [the] table on page 18 which are described below the table on page 18.

The comments on page 17 are referencing the fact that some of these hours have been provided to preserve service standards. The crowding standard in this case is an example. No statement was made that there would be a reduction in crowding. The hours for reliability initiatives are being added to address operating needs and thereby preserve existing standards as noted in the Improvements to Surface Transit Schedules report (June 2019). The report indicated that it “is not possible to bring all schedules that actually operate outside of the tolerances of service standards in line with them within existing funding.” The 2019 funding for service reliability was used to maintain a balance between providing a reliable and comfortable service.

Page 17/18 reflect the base budget additions only. Page 22, identifies a further $3.7M investment (classified under new & enhanced). These approximately 39,000 hours are additional to the hours presented in the table on page 18 and are aligned to the 5 year service plan.  The “priority action” from the deck is linked to this specific initiative. These hours will be added in stages throughout the year, primarily in May and September.

With all of these references to other reports, a guide is required to understand what is stated here. It all begins with those 89,211 service hours, part of the increase for 2020 over the 2019 total of 9.45 million hours. Service is budgeted in hours because that is the primary driver of costs, but hours are not affected by inflation allowing service to be planned and measured on a constant basis.

They first show up on pages 17-18 of the TTC’s 2020 Operating Budget Report:

A further $4.8 million and 88 TTC operators are required to deliver an increase in service hours, which is required to adhere to the TTC’s service standards so that no more than 51 passengers are accommodated per bus in peak periods and 36 in off peak periods. To adhere to these standards, an additional 89,211 scheduled operating service hours are proposed for 2020 and is described in greater detail in the Service Budget section below.

The following section includes a table setting out the build-up of the 89,211 hours:
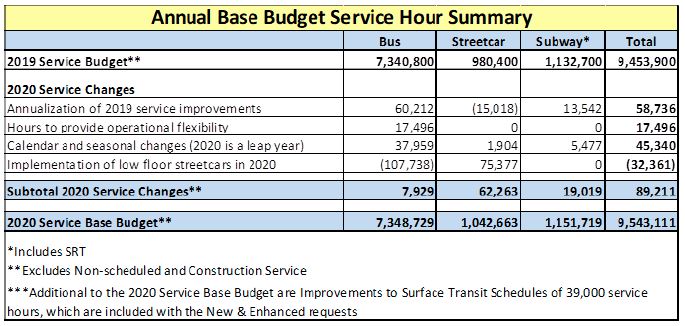
None of the components listed here address bringing service into line with crowding standards. Over half of the added hours simply carries forward 2019 changes into 2020 on a full-year basis, and the next highest component is the provision for the Leap Year. “Operational Flexibility” refers to additional buses that are on standby to deal with gaps and emergencies. There is an offsetting saving due to the full implementation of the new streetcar fleet.

The TTC has previously reported that some routes are operating above its crowding standards, and the TTC acknowledged in 2019 that they could not operate within these standards using existing funding. The text quoted from the budget states that the 89,211 new hours are needed to adhere to the standards. This implies that improvements would correct past problems and limit the effects of ridership growth to stay within the standards. The table shows that in fact the hours would go to other purposes.

The point was reiterated in the presentation deck used at the Board meeting which included the bullet “Delivery of expected service standards” [p 13].

In previous conversations with Stuart Green, he has described this as a problem with editing, but his email is quite explicit that “No statement was made that there would be a reduction in crowding”.

A further 39,000 hours will be added in 2020 at a cost of $3.7 million. The purpose of this is described in the TTC’s Budget Report [p 22]:

Service Reliability

5 Year Service Plan: Improvements to Surface Transit Schedules

To improve on-time performance, which is crucial to customer satisfaction, surface transit schedules will be revised to reflect operating conditions and improve reliability for customers. This is consistent with the plan outlined in the 5 Year Service Plan and 10 Year Outlook, which was presented to the Board on December 12, 2019. In all, 1,000 weekly service hours will be added over the course of 2020 at an estimated cost of $3.7 million and is essential to fulfill our commitment to customers that we will improve service reliability on our bus network.

This is our “truth in advertising” promise – that the TTC’s bus will depart on time according to published schedule. To start, service will be added on 5 of the busiest and most operationally challenging corridors in the City including 29/929 Dufferin, 35/935 Jane, 39/939 Finch East, 37/937 Islington and the 86/986 Scarborough Routes. These improvements will benefit service for 175,000 customers per weekday.

On time performance is not the same thing as route capacity, especially when the TTC only measures this at terminals and does not achieve it even there. The schedule changes often brings wider headways, less frequent service, to routes as the allocated vehicles are stretched over longer scheduled round trips. Combined with gapping and bunching of buses and streetcars, this can make for worse service, not better, but it avoids running more buses and streetcars.

It is not clear whether the TTC expects that 2020 will continue the problem that available resources will not fund service across the network to meet the service standards. CEO Rick Leary has stated that a quarterly crowding report will be coming to the TTC Board this year, but if past experience is any indication, the TTC will report vehicle loads on an average hourly basis without also showing the effects of service gaps. Crowding could be improved with more-reliably spaced service, but there is nothing to indicate that this is part of the overall plan.

What is clear is that the TTC Budget Report claimed that new resources were going to address service standards as their sole purpose, not “some” or “as an example” as the TTC claims. However, only one page later, the same resources were allocated to other changes.

What we do not see is a dedicated, explicit plan to address crowding, nor any estimate of what will be needed to achieve this. New capital funding for a variety of state of good repair projects, not to mention vehicle purchases, brought much rejoicing to the TTC. However, without clear plans and funding to operate more service, riders will not see any improvement in their daily travels.

We’re Not Getting Our Ten Cents’ Worth

My latest for NOW on the subject of the pending fare increase and budget.

TTC’s 10-cent fare hike doesn’t buy much transit

On the subject of just how much new service we will see in 2020, when and where, I repeatedly asked the TTC for this information, and am still waiting as of 8:30 am January 20.

There is a related issue with the TTC’s claims of widespread service improvements in 2019. I will explore this in a future article here.

Toronto Budget 2020: More Transit Money, But How Will It Be Used?

The City of Toronto launched its 2020 budget process on January 10, 2020 with a presentation by senior management and a short question-and-answer session with some members of Toronto Council. At this point, the material was quite high level, including some management puffery, but the real meat of the budget lies in the departmental and agency Budget Notes to be discussed at meetings on January 15-17. The TTC budget will be discussed on January 17.

Useful links:

Major Issues

Much has been made of the City Building Fund and its rising property tax levy to finance substantial growth in the TTC and Housing capital budgets. The changes to the TTC’s ten year capital plan between its original launch in December 2019 and the version presented in the January 2020 Budget Note are detailed later in this article. Within those changes are two major categories:

  • It was only one year ago, that TTC management proposed, and the Board approved, a significant change in the timing of Line 2 Bloor-Danforth renewal pushing out the installation of Automatic Train Control, construction of a new yard and purchase of a new fleet by a decade. The new Capital Plan shifts this work back into the 2020s and better aligns with the timing of the Scarborough Subway Extension. It also removes a reliance on older technology whose longevity was uncertain, notably the signal system.
  • The original Capital Plan included no money for new vehicles beyond purchases now in progress. There is a new item for “Vehicles”, but this is not subdivided by mode. Significant spending is budgeted for 2022 and beyond. Expanding any of the fleets also triggers a need for garage/carhouse facilities and there is a substantial increase in the planned spending on facilities.

On the Operating budget, the changes are much more modest because the additional revenue mainly keeps up with inflationary pressures, but does not go beyond for an aggressive expansion of service.

The TTC plans to hire 88 more operators and has budgeted more service hours, but the purpose of this is described differently depending on which part of the budget report and presentation one reads/hears. In December 2019, the Operating Budget and its presentation talked of relieving overcrowding that placed some routes beyond the Service Standards. However, the same addition to the Service Budget is used to handle other factors and the list makes no mention of reduced crowding.

I await clarification from the TTC on this important issue – does the TTC plan to reduce crowding or not? Will they burn up new service hours mainly to pad schedules for better service “resiliency”, or will they actually add service on overcrowded routes?

Continue reading →

Now Also In NOW!

Starting this week, I will be writing a column for NOW magazine.

Fear not. The deep dive articles on budgets and operations and transit policy will still appear in this site, but for smaller nibbles, I will have the column.

There will also be the occasional article in Spacing magazine including the winter issue that should come out quite soon.

The first NOW column is an introductory piece about the many things people expect public transit to accomplish, a tiny manifesto.

What Is Transit For?

TTC Weekday Ridership From 1976 to 2018

For many years, publication of ridership data has been sporadic, and information on crowding appears even less frequently. A major problem has been the cost of acquiring information on a system-wide basis and staff cuts in the group that once performed this task manually. Even when data were published annually, the values for major routes such as 501 Queen did not change in each year because the resources needed to conduct a count on such a large, busy route were not always available. However, most vehicles now have automatic passenger counters and the amount of data on tap today has increased quite substantially.

Recently, the TTC published data for 2017 and 2018, bringing us more up-to-date than the 2014 tables. Those were more than a little stale, especially in an era when strong growth has been reported anecdotally and is clearly evident with the success of the King Street Pilot.

An important point about these counts: they measure riders who are actually on vehicles, not those who could not board nor those who gave up and took another route or mode. A badly needed companion report is a review of vehicle crowding by route and time of day, not to mention an evaluation of the interaction between uneven service and crowding.

One long-standing problem within the TTC is that there is an ongoing struggle between the very large “operations” side of the organization responsible for running service and the tiny “planning” group who look after things like schedules and riding counts. Operational metrics given monthly in the CEO’s report say almost nothing about service quality especially at a granular level experienced by riders. Simple targets and all-day averages mask what is really happening, and there are no real “standards” for how to measure service and crowding.

These are topics for another day. At least now we have comparatively current ridership data, and we must hope that they will now appear annually to better track the system’s evolution.

A troubling fact about the charts in this article is the number of routes and the areas of the city where riding has been stagnant or in decline for many years if not decades. There are areas of growth, but many of these can easily be linked with specific changes such as a new subway line, the growth of housing to the edges of the city, and more recently the growing population along the waterfront.

This is a system that is doing well in certain places, but has a malaise over many parts of its network. Years of making do with only marginal increases have taken their toll. Any Ridership Growth Strategy would do well to understand this situation, and address how or if those trends can be reversed.

The TTC published route-by-route ridership numbers, among other data, starting in 1976, although from 2006 onward, this did not happen regularly. The practice began in the early days of “Service Standards” when the growing level of political involvement in TTC affairs brought a concern that new and modified routes would arise not because they were the best use of resources, but because their advocates had “friends at court”. A fundamental problem was to compare existing and proposed services, and that required ridership counts.

Service Standards and the methodology behind evaluation of routes have changed over the years. The current version was adopted in May 2017 consolidating existing standards, policies and practices, reviewing standards used by other cities and incorporating information from rider surveys about what matters to them.

In December 2019, some changes were proposed to the existing standards, but these modifications are not yet reflected in the document linked above. See Appendix 3 of the following report for details.

A problem with technical standards is that they are meaningless without understandable, public data. The standards themselves are “board approved”, but this process does not guarantee that those voting to endorse them actually understand the tradeoffs built into the policy. Even worse, without regular reporting on how well the system meets the standards, there is the nagging sense that they exist more as a lofty goal than an actual bar against which riders can judge TTC performance.

Ridership and Boardings

When the TTC reports that it expects to carry 533.5 million “rides” in 2020, this number is a computed equivalent to fares dropped in a now-vanishing farebox. In the old days these were easy to count by processing coins, tokens and tickets. Even with Presto farecards, there is a count of “taps”, but even here the link to “rides” in the traditional sense is not what it was fifty years ago.

As riders moved to passes from single fares, the link between countable revenue and “rides” became less certain. More recently, the introduction of a two-hour fare replacing the byzantine TTC transfer rules allowed “trip chaining” where travel formerly considered as separate rides (each requiring its own fare) could be consolidated into fewer charges against a Presto card or ticket. The riders did not go away, but the ability to count them one by one from fare revenue no longer exists. Even before Presto, the TTC handled Metropass ridership by using rider surveys of travel patterns to determine the typical number of conventional token-based “trips” a passholder would take. This produced a conversion factor to translate between pass sales and “ridership”.

In recent years, the validity of this conversion fell under a cloud as some riders, those for whom a Metropass represented more of a convenience than an actual saving over single fares, migrated away from passes. They represented a paper “loss” falling from over 70 trips/month assumed for a pass to under 50 in single fares, but those 20 trips were rides they never actually took.

Meanwhile, the view of transit service seen by looking at vehicles showed that crowding was an increasing problem and this ran contrary to the revenue-based view that ridership was falling. Budget hawks care only about dollars, not about service or riders, and this remains a problem in an era where year-over-year municipal operating costs are supposed to be held at inflationary levels, but no more. Any new service or extraordinary cost increase is paid for by cutting something else. We will see how the TTC fares on that score when its 2020 budget comes before Council.

For the purpose of looking at demand on a route, the relevant measure is not fares collected, but “boardings”, or what planners call “unlinked trips”. In this view of the transit world, each change between vehicles counts as a new boarding even if no fare is paid. This eliminates the artificial linkage between revenue and measured demand. In the budget, TTC management notes that in recent years boardings were going up even while “ridership” was falling. This is a direct result of the change in how ridership is calculated and, more recently, of the amount of travel a rider can purchase for one fare.

Continue reading →

Streetcar Service During the CLRV Era

With the retirement of the CLRV fleet on December 29, 2019, this is a good time to look back at how service on the streetcar network has evolved during the lifetime of those cars.

When they first entered service on the Long Branch route in September 1979, the new cars marked a real sign that Toronto was keeping its streetcar system.

Although Toronto decided to keep streetcars in late 1972, there was no guarantee that without renewal of the fleet and infrastructure the system could last very long. The last-built cars in the PCC fleet (the 4500s) dated to 1951 and, despite their simplicity compared to what we now call “modern” cars, they would not last forever. Second hand cars from other cities were older than the most recent “Toronto” cars. They were retired over the years even while the TTC undertook major overhauls on its own, younger fleet.

In 1980, the streetcar service was still dominated by PCCs as much of the CLRV order was still to come, and the ALRVs would not arrive until the late 1980s.

Yes, I know. What are all of those acronyms? Not every reader is a die-hard railfan with all of this information at their fingertips.

PCC: The President’s Conference Car was the product of work by a consortium of street railways to update streetcar design in competition with the rise of the private automobile. This was a large research project, especially for its time in the 1930s, and it produced a totally re-thought vehicle. The TTC was working with Hawker Siddeley on an updated PCC design in the mid-1960s, but nothing came of this thanks to a provincial fascination with new, high-tech transit. A license agreement for updated PCC patents held, in the 1960s, by the Czech manufacturer Tatra was never signed, and work on a new PCC for suburban routes stopped.

PCCs on King Street at Atlantic Avenue

CLRV: The Canadian Light Rail Vehicle. This car was designed partly by the TTC and partly by a provincial agency, the Ontario Transportation Development Corporation (later renamed as “Urban” to remove the explicit local reference). The design, from the Swiss Industrial Group (SIG), was very different from the car the TTC had worked on, but the UTDC needed a viable product after their magnetic-levitation project ran aground with technical difficulties. As a city streetcar, it was overbuilt in anticipation of high-speed suburban operation, notably in Scarborough. That scheme was supplanted by what we now know as the “RT”.

CLRV at High Park Loop

ALRV: The two section “Articulated” version of the CLRV was designed to run on heavy routes, notably the Queen car. These vehicles were never as reliable as the original CLRVs, and they were the first to be retired. At various times over the years, they ran on Queen, Bathurst and King.

An ALRV at “Old” Exhibition Loop

Flexity: This is the generic product name for Bombardier’s low-floor streetcars. It exists in many formats with Toronto’s version being designed to handle tight curves and steep grades. Delivery of the 204-car fleet was almost complete at the end of 2019.

Flexity on King Street at University Avenue

When the TTC decided to keep streetcars in 1972, they were still enjoying a long period of post-war ridership growth with constant expansion into the suburbs of bus and subway lines. Getting new riders was a simple task – just run more service. The downtown streetcar system was still bulging with riders thanks to a stable population and a robust industrial sector.

By 1980, however, the TTC hit something its management had not seen before, a downturn in ridership, thanks to the economic effect of the first Middle Eastern oil war and its effect on energy prices. Although the TTC continued to grow through the 1980s, a mindset of running just enough service to meet demand took over. This would be particularly unfortunate when the ALRVs entered service, and the new schedules merely replaced the capacity of former CLRV/PCC service on wider headways. With cars 50% bigger, the scheduled gap (headway) between cars increased proportionately. This combined with the TTC’s notoriously uneven service to drive away ridership, and the Queen car lost about a third of its demand.

The real blow came in the early 1990s with an extended recession that saw the TTC system lose 20% of its ridership falling from about 450 million to 360 million annual rides over five years. The effect was compounded when Ontario walked away from transit subsidies when the Mike Harris conservatives replaced the Bob Rae NDP at Queen’s Park.

The TTC planned to rebuild and keep a small PCC fleet to supplement the LRVs in anticipation of vehicle needs on the Spadina/Harbourfront line. However, when it opened in 1997 service cuts had reduced peak fleet requirements to the point that the PCCs were not required and the network, including 510 Spadina, operated entirely with CLRVs and ALRVs. This locked the TTC into a fleet with no capacity for growth, a situation that persisted for over two decades and which the new Flexity fleet has not completely relieved.

The combination of rising demand, in turn driven by the unforeseen growth of residential density in the “old” City of Toronto, and of commercial density in and near the core, leaves Toronto with unmet transit needs, latent and growing possibilities for transit to make inroads in the travel market, and a customer attitude that “TTC” means “Take The Car” if possible.

The problem with service inadequacy and unreliability extends well beyond the old city into the suburban bus network, but this article’s focus is the streetcar lines. I have not forgotten those who live and travel in what we used to call “Zone 2”, but the evolution of service on the streetcar system is a tale of what happens when part of the transit network does not get the resources it should to handle demand.

The evolution of service and capacity levels shown here brings us to the standard chicken-and-egg transit question about ridership and service. Without question there have been economic and demographic changes in Toronto over the years including the average population per household in the old city, the conversion of industrial lands (and their jobs) to residential, the shift of some commuting to focus outward rather than on the core, and the shift in preferred travel mode.

Where service has been cut, ridership fell, and it is a hard slog to regain that demand without external forces such as the population growth in the King Street corridor. The lower demand becomes the supposed justification for lower service and what might have been “temporary” becomes an integral part of the system. However, the level of service on any route should not be assumed to be “adequate for demand” because that demand so strongly depends on the amount of service actually provided.

This is a challenge for the TTC and the City of Toronto in coming decades – moving away from just enough service and subsidy to get by to actively improving surface route capacity and service quality.

Continue reading →

Analysis of Route 70 O’Connor for November 2019

A month ago, I looked at the O’Connor bus as a particularly bad example of TTC line management and the huge difference between service actually provided on the street, the scheduled operation, and the official claims of service quality. On December 20, I tracked the route’s operation during the PM peak period when it was short vehicles, and those actually in service provided erratic service with large gaps.

The November 2019 tracking data came in a while ago, but I have been distracted by other issues, notably the TTC budgets, and a lot of holiday cheer. Riders of the O’Connor bus need a lot of cheer to get through what passes for service on that route.

Scheduled Service

The schedule for 70 O’Connor has not changed from October.

The route originates at Coxwell Station, and it has two branches splitting off at O’Connor and St. Clair. One heads east to Warden Station, and the other goes north to Eglinton. Scheduled service is the same on both branches at almost all periods of operation.

Continue reading →

An Example of Service on Route 70 O’Connor December 20, 2019

One month ago, I presented an analysis of 70 O’Connor in response to a tweet complaining about long waits. This tale began on a Saturday afternoon when all four of the buses on route 70 had congregated at Coxwell Station, then left in a pack, and all reappeared at the same time. This is the absolute nadir of line management.

The article and tweets touched a nerve with media coverage (finding disgruntled passengers at Coxwell Station was an easy task) and claims by the TTC that maybe I didn’t have all of the data. Although I have offered to incorporate any information they might have about using extras – Run as Directed “RAD”  or Construction Service buses (it really does not matter what they are called) – I am still waiting for any confirmation that my presentation was inaccurate. Complaints on Twitter continue to accumulate, and it is not hard to find a period when service on the route is badly bunched simply by looking at NextBus or a similar app.

This started off as a planned update with the November tracking data, but that will have to wait because what I watched unfold on NextBus was a perfect example of how things go wrong.

As I started to write this (just after four pm on December 20), there are five buses on the route all in spitting distance of O’Connor & St. Clair, two westbound and three eastbound. There are supposed to be six buses on the route. During the period I was watching, the sixth appeared late in the peak period at Eglinton Garage, and as I publish this at 5:50 pm, it is about to enter service southbound from Eglinton & Pharmacy.

Here is the service at 4:05 pm. Two of the eastbound buses, oddly enough 8643 and 8644, headed east to Warden Station. At about 4:18, 8644 headed off south on Warden (!) in a clear attempt to make an express trip back to Coxwell Station and space out the service. This was a brave attempt, but as we will see it didn’t quite work out.

[Click on any map in this article to view a larger version.]

Continue reading →

501 Queen: Streetcars vs Buses November 25-29, 2019

During the last week of November, the first to see streetcars return to The Beach after almost three months’ absence for construction at Kingston Road, the line had a major disruption thanks to a broken rail near Roncesvalles. This rail damaged the track brakes on 22 Flexity cars, and while the TTC searched for the problem, the line was completely switched to bus operation.

Streetcars ran on Monday and Tuesday, November 25-26, and on Wednesday November 27 until midday. Buses ran from the afternoon of November 27 to the end of service on Friday,November 29 (actually Saturday morning).

There have been calls from certain quarters on City Council for a comparison of the operation of both modes. I published an analysis of route 505 Dundas in May 2018. Broadly speaking, it showed that buses outrun streetcars only when there is no traffic in the way and operators can drive as if they are on the suburban streets they are used to.

The substitution on 501 Queen gave an opportunity to compare the two modes over the entire route, not just over a segment running with buses due to construction. This article reviews the data from November 25-29 for 501 Queen.

Methodology

The TTC has two vehicle tracking system, CIS and VISION. The streetcar fleet (and a small number of buses that often run on streetcar lines) is tracked by CIS, while most of the bus fleet is tracked by VISION. The entire system will be on VISION probably in a few years, but for the moment there are two data sources.

Until quite recently, I was unable to obtain finely-grain information about vehicle locations from VISION, but this changed in October 2019. It is now possible to get comparable data tracking vehicles from both systems. This meant that comparable data were available for both the streetcar and bus operations on 501 Queen.

The process for converting data from snapshots with GPS co-ordinates to a format suitable for analysis is described at length in Methodology For Analysis of TTC’s Vehicle Tracking Data.

In this case, we are interested in three aspects of streetcar and bus behaviour:

  • How long does each type of vehicle take to get from one point on the route to another?
  • What are the speed profiles for each vehicle type along the route?
  • What are the dwell times for each vehicle type along the route?

For the comparatively coarse measurement of travel times between points, the route is divided by screenlines. Tracking when each vehicle crosses a screenline gives both the headways at each line, and the travel times between them.

For fine measurement of vehicle speed, the tracking data are used to calculate each vehicle’s speed as it moved along a route. The route is subdivided into 10m segments, and the speeds of every vehicle passing through that segment in each hour are averaged. This reveals locations where vehicles spend a lot of time stopped or travelling slowly, and of course locations where they move much faster.

For dwell times, the points of interest are those where vehicles are stationary. The “tick” of the clock for tracking data is every 20 seconds, and so the length of a vehicle’s stay at a point can only be calculated to a multiple of that interval. This is a fairly coarse measurement relative to the length of time most vehicles take to serve stops, and the resulting data give only a broad outline of comparative dwell times. Note also that “dwell time” is not necessarily all “stop service time” because vehicles can be awaiting a green traffic signal, or be stuck in traffic at the stop.

The distance scale to which I convert GPS positions is measured in 10m increments. Given that vehicles will not necessarily stop at exactly the same place every time, the charts here give moving averages of dwell times over 30m.

All of the analyses presented here are subdivided into hourly intervals recognizing that a route’s behaviour at 6am is vary different from midday, the two peaks, and the evening. Far too much data presented by the TTC is summarized on an all-day basis, and even on an all-route basis. This masks variations in behaviour by location and time of day, and does not give a detailed picture of what is happening.

Summary

The data reveal various aspects of bus and streetcar operation on 501 Queen, and by extension, on other routes where a substitution might be contemplated. The results for 501 echo those seen in the 2018 article on the 505 Dundas route.

  • Across the entire route, buses travel faster than streetcars, but their performance varies from place to place, hour to hour.
  • On sections of the route where traffic is not free flowing, and where stops are busy, buses do no better than streetcars and during some periods they are worse.
  • Where traffic is free flowing, some of the advantage buses have arises from driving at above the speed limit which is 40 kph within the old City of Toronto, and 50 kph on the Lake Shore section west of the Humber River.
  • The effect of streetcar slow orders at numerous locations is clearly evident in the data.
  • Dwell time for buses appears to be slightly longer than for streetcars. This could be due to loading delays, but in turn that could be caused by the bus service being overwhelmed by streetcar-level demand. (There were complaints about the quality and capacity of the replacement service.) Also, buses lose time getting to and from curbside stops, but this is not necessarily reflected in “dwell times” because they are merely slow, not stopped during these moves.
  • I am unable to comment on service quality with buses because many vehicles were not logged on to VISION with the 501 route number. Therefore, their data do not appear in the extract I received. However, there were enough vehicles to get a sample of their behaviour and determine travel times.

Continue reading →