The King Street Pilot: Sorting Fact From Fiction (Part IV: Headway Reliability)

The King Street Pilot has been a success in reducing travel times for streetcars through the core area with knock-on benefits to the outer parts of the route in reduced short turns and more reliable service especially outside of the peak period.

Headway (the space between vehicles measured in time, not distance) is a big issue for riders, and it also affects crowding levels.

If a service is scheduled to show up every 4 minutes, and actually does so, then on average each car will have a similar load (subject to surges that will upset this), and riders can expect an average waiting time of half a headway. Even if they just miss a car, they know fairly certainly that the next one will be along soon, and it might even be in sight.

A chronic problem on all transit services is the bunching of vehicles that can yield two (or more) cars or buses close together followed by a long gap. When cars bunch, riders inevitably pack onto the first one. This is not simply a lemming-like desire to rush the first car, but the effect of years of experience telling riders than when there is a bunch, some of the cars will be short turned. If they are on the first one, they can at least drop back one car when this happens. If they are on the second or third in the parade, they may get dumped off and face the next big gap.

Some transit systems implement time points along a route where vehicles will hold for a scheduled departure time. A more sophisticated version of this is to hold in order to space out service regardless of the schedule. Riders do not care if a car (and its driver) are “on time”, only that the headway is close to the advertised value. It is the transit system’s problem to sort out operator crewing with schedules that can be achieved most of the time, but which are not excessively padded to the point service dawdles along a street. The latter has been a problem on some TTC routes where extra running time overshot the mark leading to annoyingly slow service and congestion at terminals where vehicles arrive early.

With the removal of much of the downtown congestion, and hence the variability in travel times for that part of the route, there was hope that headway reliability would improve. Results to date leave a great deal to be desired. There has been some reduction in the most annoying of wide gaps, but bunching remains a problem.

To be fair, when the scheduled headway is under 4 minutes, some bunching is inevitable. Even if cars leave the termini like clockwork, demands at stops vary as does the traffic enroute, and cars will get slightly off schedule. The follower will catch up, in part because of the lighter load from its shorter headway.

The TTC has a service quality target that all vehicles will leave their termini no more than 1 minute early or up to 5 minutes late. This is the only point on the route where schedule reliability is measured. (Until early 2015, the value was measured at several points along the route to provide a blended score, but this practice was dropped.) There are three basic problems with this scheme:

  • A terminus is the simplest place to monitor and dispatch service, and headway variations should always be the lowest at these points.
  • When the scheduled headway is small, the allowed 6-minute window for being “on time” permits vehicles to depart in bunches and still be “on time” because they remain within the allowed variation.
    • A perfect four minute headway would depart a terminal at 0, 4, 8, 12, 16, 20, 24 … minutes past the hour.
    • The same vehicles operating in pairs at 0, 7, 8, 15, 16, 23, 24 … would be “on time” because the alternate cars in the sequence are only three minutes late.
    • This problem is worse for wider scheduled headway because until the “five minutes late” line is crossed, the service is on time.
      • 0, 6, 12, 18, 24, 30, 36 … and 0, 11, 12, 23, 24, 35, 36 … are both “on time” but the latter actually provides a 12 minute headway of vehicles in pairs.

The TTC has, in effect, constructed a target for “on time performance” that considers bunched service to be acceptable even at a terminal. The problem with this is that as vehicles move along the route, the headway variations get bigger and bigger. It is ironic that even with this generous standard, actual service across the system does not achieve anywhere near the target on the streetcar or bus networks. The streetcar network itself went into a long slide through 2017 thanks to declining vehicle reliability and the proliferation of construction projects.

Continue reading

The King Street Pilot: Sorting Fact From Fiction (Part III: Service Capacity)

An important issue for the King Street Transit Priority pilot is the rising demand on that corridor. Previous TTC stats showed a total of 65,000 riders using the 504 King and 514 Cherry lines combined, but this has now been updated to 71,000 even before the pilot began. Further growth comes from riders attracted to the improved service, and the line is now crowded beyond capacity at some times and locations.

The TTC has announced “improvements” from time to time on the King route, but this masks declines in service capacity.

The service design for the am peak period uses a base service about every 4 minutes overlaid by peak “trippers” that bring the headway down to about 2 minutes. However, the number of trippers has fallen over the years and in practice, the “wave” of very frequent service now lasts only about half an hour. This comes eastbound on King at Dufferin 6:50 and 7:20 am, westbound at Broadview between 7:45 and 8:15 am, and eastbound again between 8:55 and 9:25 am.

There are now seven trippers where once there were sixteen, and for some time streetcars on the trippers were replaced by buses at a lower capacity. Recently, peak vehicles were swapped between 504 King and 505 Dundas so that the trippers could revert to streetcar operation.

When buses began operating on 504 King, the TTC claimed that this was a service improvement. This was true for a time when buses allowed the service to build back to its previous high point, but over time the number of bus trippers fell.

Using the TTC’s vehicle tracking data, one can plot the actual capacity operated at various points and times on King Street. These are actual, not scheduled, capacities, and they reflect the day-to-day fluctuations in service and vehicle types. For the purpose of the charts here, the Service Standards planning capacities are used. These are not the crush capacity of vehicles, but a target level in Board-approved TTC standards for an average level of crowding that should not overwhelm the service with loading delays and severely uncomfortable conditions. Whether the TTC actually achieves this is another matter, but the numbers give an indication of the relative levels of service operated over time.

The Service Standards for peak period vehicle capacity are:

  • Bus: 51
  • Standard streetcar (CLRV): 74
  • Two-section streetcar (ALRV): 108
  • New five-section streetcar (Flexity): 130

[Service Standards at p. 10]

Here is an example of one chart showing capacity eastbound at Bathurst & King between 7:00 and 8:00 am from January 2016 to December 2017 (note that February 2016 data are missing).

The capacity provided here was at its height in the spring and summer of 2017 when ALRVs normally used on 501 Queen were redeployed to 504 King. In fall 2017, service levels were reduced because of the change in vehicle type.

Noteworthy in this chart is the growth in capacity provided by Flexitys first on 514 Cherry (building up to full low-floor operation by mid 2017) and more recently with the addition of the new cars to 504 King. Although they do not make up half of the vehicles operating on King, they account for half of the capacity in the central section.

For a longer-range view of capacity, here is the same chart with data (where I have the details) going back to December 2006. This illustrates the long period during which the capacity provided on 504 King was static even as land along the route redeveloped. This is a chronic problem on the streetcar routes because an order for new cars and a larger fleet was delayed so long.

The sets of charts below illustrate capacities at five locations and times. Each set contains four charts covering the peak periods from 6-10 am and 3-7 pm depending on which period is illustrated.

Jameson AM Peak EB

Service eastbound at Jameson does not include the 514 Cherry cars which enter the route at Dufferin. Flexitys appear here only after their recent addition to 504 King. Note how the capacity provided here drops in the hour from 8-9 am compared to those on either side of it.

Bathurst AM Peak EB

Service eastbound at Bathurst includes the 514 Cherry cars and the growing contribution of Flexitys on this route is evident from June 2016 onward.

Yonge PM Peak WB

The PM peak service design is different from the AM in that there are few or no trippers (depending on which schedule one considers), and so this location has been less affected by cutbacks in that part of the service. However, service capacity has not changed much over the past two years especially during the peak 5-6 pm hour.

Bathurst PM Peak WB

The situation at Bathurst is similar to that at Yonge, although it can be affected by cars short-turning at Spadina. After the 503 service is added in February, the capacity at Yonge will be slightly higher than at Bathurst.

Jameson PM Peak WB

The capacity of service outbound west of Dufferin is, if anything, lower now than it was in past years. This reflects the concentration of service east of Dufferin with the coming of the 514 Cherry route.

In summary, riders who believe that service, as measured by capacity, has been better in the past are in many cases correct. An important part of the King Street Pilot will be to determine how much latent demand can be attracted to the route through the combination of lower travel and wait times, and greater route capacity.

The King Street Pilot: Sorting Fact From Fiction (Part II: Travel Times)

On the Torontoist, I wrote an article reviewing experience with the King Street Transit Pilot and some of the preliminary claims and reactions to it. This piece is the first of the technical follow-ups to that article with more detailed data about the behaviour of transit service on King.

Note that this analysis only covers the operation of transit vehicles, not of general traffic. For information on other data collected by the City of Toronto, please refer to the “data” page on the project’s site.

This article deals with travel times on various parts of the King route both inside and outside of the Bathurst-Jarvis pilot area. Following articles will address capacity and service reliability.

For a review of operations up to the end of November 2017, please see:

Averages versus Individual Data

In reporting the change in travel times, the City of Toronto cites averages, maxima and minima for the “before” and “after” conditions. For example, in the chart below, eastbound trips in the PM peak before the pilot ranged in length from 13.0 to 25.0 minutes with an average of 18.9.

However, the “before” numbers omit some of the worse cases for travel times:

  • The period of the Toronto International Film Festival from September 7-17, 2017. During early days of TIFF, service was diverted via Spadina, Queen and Church adding greatly to travel times. Even after King Street nominally reopened, service was interrupted from time to time with unannounced diversions.
  • The period of track construction at Queen and McCaul Streets from October 16-27, 2017. This period saw 501 Queen streetcars shift south to King adding turning movements at Church eastbound and Spadina westbound that took place generally without any transit priority. Some traffic spillover from Queen to adjacent streets occurred, but this was not measured.

Gray: Pre-pilot Pink: November Mauve: December

Although omission of these two periods puts the best possible light on the “before” conditions and avoids criticism that the project is making a worst/best case comparison, it is a fact of life that service and travel times on King are routinely affected by various projects including construction and special events. A valid test for the pilot will be the street’s operation during a Queen Street shutdown for an event at City Hall or at Much Music. How will transit service and other traffic behave when part of the downtown network is taken “offline”? This remains to be seen.

The averages are the most commonly cited data in the press and in political comments. However, these averages hide a great deal.

  • Travel times vary considerably from hour to hour, and from day to day.
  • A three-hour average over the peak period includes many trips that occur under less-than-peak conditions, and this pulls down the averages.
  • Averaging data for several weeks smooths out the effect of daily variation.
  • Averaging over the entire pilot area merges data from areas where the pilot’s effect is small with those where it is large.
  • Averaging over only the peak periods misses the benefits, if any, of the pilot for off-peak operations.

Continue reading

TTC Service Changes Effective January 7, 2018

There are few changes planned for the January 2018 schedules.

2018.01.07_Service_Changes

14 Glencairn is the latest of many routes to get additional running time compensating for the Crosstown LRT construction. Oddly, the end date shown for this change is December 2022 where all other Crosstown-related end dates are in 2021.

Supplementary service on 32 Eglinton West is being reorganized. There are currently several Service Relief buses operating from Mt. Dennis during most operating periods. These will be replaced by peak-only buses from various garages.

75 Sherbourne trips at the start and end of service are being changed to begin/end at Sherbourne Station rather than at South Drive in Rosedale.

The official route and stopping arrangements for various lines serving Finch West and Pioneer Village Stations have been clarified for periods when these stations are closed.

The TTC has already confirmed through the media that due to the late delivery of Flexitys from Bombardier, there will be bus substitutions on 505 Dundas and 506 Carlton starting with the February 18, 2018 schedules. This is also related to service reorganization to boost capacity on King Street. I will report the details when they are available.

(Bus trippers originally planned for 504 King are now actually operating on 505 Dundas replacing CLRVs that have been redirected to King Street for extra capacity.)

It should be noted that due to track construction on Broadview planned in 2018, there will be effects on the Carlton, Dundas and King routes that will probably last two schedule periods.

Analysis of Routes 501 Queen and 6 Bay: November 2017 (Part 2: Preliminary King Street Pilot Review)

This is the second article reviewing the effects of the pilot King Street transit priority scheme. Part 1 looked at the behaviour of the 504 King streetcar route, and Part 2 concerns the operation of 501 Queen and 6 Bay during the same period.

Among the effects anticipated from the pilot was an increase in traffic on parallel streets with the effect reaching as far north as Queen Street. Queen suffers badly during the shutdown of King for TIFF in September, and by extension some problems were expected to show up with the pilot’s changes changes on King.

Another effect that was expected was congestion on the north-south streets crossing King. Only one transit route in mixed traffic, 6 Bay, operates on such a street.

The City of Toronto is monitoring traffic behaviour on many streets in the study area and will publish their own preliminary findings in mid-December.

The charts presented here are in the same two formats as those in Part 1:

  • One pair of charts shows the travel times between Bathurst and Jarvis on Queen, and between Dundas and Front on Bay, both ways. Each day’s data are plotted individually to show the difference between individual trips, the evolution of travel times over the day, and the degree of dispersion in travel time values (i.e. the predictability, or not, of travel time for any journey).
  • One pair of charts shows average times, by hour, for each day to illustrate daily fluctuations and any before/after changes concurrent with the King Street Pilot.

For both routes, there is almost no change in the average travel times after the pilot began. Values on Queen bounce around a lot, but they do so both before and after the pilot began.

There is a quite striking weekly pattern with much higher than usual averages during the PM peak eastbound on Queen and southbound on Bay with low values usually on Mondays, and much higher values later in the week. This shows the importance of studying route behaviour over several days, while remaining aware that external events can create patterns in the data, or can create one-time disruptions for special events such as parades or sporting events.

501 Queen:

6 Bay:

TTC Plans Flatlined Service and Fares for 2018 (Updated November 17)

Updated November 17, 2017 at 6:30 pm

The TTC Budget Committee met today and considered the draft 2018 Operating Budget. Between the original release (described later in this article) and today’s meeting, Mayor Tory and two members of the TTC Board endorsed the concept of a two-hour fare to replace the complex transfer rules now in place.

Although this was listed as the second item on the revised meeting agenda, Commissioner Mary Fragedakis moved that it be considered first. This re-ordering was a procedural move to forestall a standard tactic used at City Council where a motion setting the next year’s tax increase is introduced and passed before the budget which it will fund. The result is that any proposed budget changes must fit within the already-approved tax level rather than having taxes set after the budget is finalized. In this case, the motion regarding a two-hour fare was only a report request, and the order was less critical. That request passed by a vote of 3-1 with Budget Chair John Campbell in the negative as he opposes the two-hour fare scheme.

The meeting then turned to a series of deputations which, as these things tend to do, fell on largely hostile ears. A favourite tactic is to challenge members of the public to explain “how would you do  it”, despite the fact that the issues are complex and do not fit within an answer of a few sentences. The Budget Committee itself cancels more of its meetings than it holds, and opportunities for an open debate about transit policy options and the budget rarely occur.

Beyond information already in the budget report, there were a few additional items of note in the staff presentation.

The Cost of the Vaughan Extension

This comes up from time to time, and it is clear that the Committee did not fully understand the costs and revenues associated with the extension.

For some time, a cost increase of $30 million annually has been cited for the TYSSE. However, the 2018 Budget only includes a $25 million bump because $5 million had already been included for start-up costs and operation in the 2017 Budget.

The $25 million comes from a combination of new costs, and revised revenues. The TTC now receives $8 million for bus services operated on contract for York Region, but those services will be assumed by the Region when the subway extension opens. The TTC will continue to operate the vehicles, but now at their own cost and so this is a net increase in costs because of the lost revenue. That amount is partly offset by a combination of $3 million in new fare revenue and $1 million in parking revenue.

Ridership

The projected ridership for 2018 is 539 million, a growth of 3 million over the probable results for 2017, but below the originally budgeted target of 543.8 million. The change from 2017 to 2018 arises from several factors:

Increases:

  • 4.8 million rides due to economic growth
  • 2.1 million rides due to service improvements and the GO Transit co-fare
  • 1.5 million more rides by children (who travel free of charge)
  • 1.2 million new rides from the TYSSE
  • 0.5 million additional rides counted due to improved reliability of Presto readers
  • Total: 10.1 million

Note that most of the expected ridership on the TYSSE will be by existing riders changing travel patterns, not by net new riders. This is further constrained because York Region Transit will continue to serve York University directly thanks to a lack of agreement on a co-fare between YRT and TTC. Riders who were anticipated to show up as YRT-TYSSE-YorkU trips will not be using the subway. It is ironic that there will be more new rides by children on the system as a whole than by riders on the subway extension.

Half a million rides were estimated to have not been counted in 2017 because failing Presto readers were unable to charge these fares. The TTC’s Brad Ross advises that these are

“rides not counted, assuming they still rode but couldn’t pay. The TTC is in the process of accounting for all lost revenue due to out-of-service Presto readers.”

Reductions:

  • 0.5 million rides due to increased subway closures
  • 0.7 million rides due to the elimination of the Public Transit Tax Credit
  • 2.8 million rides due to decreasing sales of Metropasses and Day Passes
  • 3.1 million rides due to a reduction in the average number of trips taken on each Metropass
  • Total: 7.1 million

This provides the net increase of 3 million over 2017 probable results.

Expense Risks

The budget has been drawn up on a conservative basis and leaves several areas where the outcomes in 2018 could be different than projected. The $14 million now sitting in the Transit Stabilization Reserve could be used to offset some of this risk, provided that Council does not scoop the reserve simply to hold down the subsidy increase.

Some of the items below refer to savings that allowed 2017 to show a “surplus” (actually a reduced requirement for subsidy), and these might not all continue into 2018.

The budget contains a provision for $4.1 million in extra costs through the provincially mandated payment for two emergency leave days per year. This has been estimated conservatively, and TTC staff advised the Committee that the worst case cost could be $18 million.

The History of TTC Budget Variances and Subsidies

For many years, the TTC has consistently come in under budget for the annual subsidy requirement. In the table below, the amounts are for the subsidies, not for the overall operating costs. This always leaves the TTC in a position for its next year estimates that a budget-to-budget subsidy flat-line actually represents an increase over actual requirements in the current year.

The subsidy per rider will go up in 2018 because of the fare freeze. Although this takes Toronto back to the level of 2010, that does not allow for cost inflation over that period which has been well above the CPI.

Continue reading

Sustainable Cities, Best Transit Systems and Crowded Vehicles

Toronto loves to pat itself on the back for being the best at just about anything, although understanding exactly what that means seems to matter less than just being somebody’s “number one”. A few recent events combine to provide a view of the city and its transit system from different perspectives.

  • The TTC receives the American Public Transit Association’s “Transit System of the Year” award for 2017. (See APTA 2017 Awards Program at pp. 10-11.)
  • Arcadis, a design and consultancy firm, has issued their 2017 Sustainable Cities Mobility Index in which Toronto ranks 54 out of 100 on a global ranking, 9 out of 23 for North America.
  • The Toronto Star, in an article by Ben Spurr, reveals that some TTC routes are crowded beyond the target level of TTC standards.

The APTA Award

The APTA award was announced with much fanfare by the TTC even before it was actually acknowledged on the APTA website. Every vehicle now sports a logo touting this win, and it is a matter of considerable pride for TTC management. Riders might be forgiven for wondering just what APTA was thinking given long-standing problems with overcrowding and irregular service. If Toronto is the best, what are the rest like?

In fact, APTA does not send out teams of mystery shoppers to gauge the quality of its member transit systems. Nominations are submitted by member agencies like the TTC and cite the basis on which they feel entitled to the prize, and these are judged by an APTA panel. In Toronto’s case, the win is for activities that, in the main, made up the Five Year Plan instituted by CEO Andy Byford in 2013, completion of activities already underway such as the Spadina-Vaughan extension and delivery of new subway cars, and reversal of the service cutbacks of the Ford era.

The list of achievements to date in the Five Year Plan is notable for the omission of improved quality of service as an explicit, measured goal. Yes, there has been a reduction in short turns, but this has not been accompanied by an improvement in service reliability. Bunching of at least pairs of vehicles is common, and the TTC’s stock answer is that “congestion” is responsible for this.

Line-by-line reports of service quality, long-promised by the TTC, have not been published since the first quarter of 2015. Even with such data, the metric is on time performance at terminals with a six-minute window to qualify for acceptable service. The result on most routes is that service can leave a terminus in pairs of vehicles and still be “on time”. Despite this generous standard, the system comes nowhere near the overall target.

Subway trains are crowded during peak periods to the point that passengers cannot board, and this cannot be fixed without additional subway capacity that is, for parts of the network, many years away.

This is the reality transit riders experience, and the APTA award and logos brought as much laughter as praise when they appeared.

Sustainable Cities

When BlogTO reported on the Arcadis Sustainable Cities rankings, it did so under the mistaken headline “New ranking trashes public transit in Toronto”. In fact, the rankings look at a much broader view of how cities compare to each other, and transit is only one part of the evaluation.

The review is of urban mobility generally, with transit being an important part, but also auto congestion, cycling and pedestrian facilities. The scoring comes from three “pillars” of sustainability with several sub-indices for specific aspects of city mobility. For those interested in the component scores, a visit to the detailed rankings shows info that is not available in the main report. (Click on various tabs to see the three pillars, and then the components of these. Scores are normalized so that top cities get 100, and the actual component score can be view by clicking on the bars of the charts.)

Toronto lies in the middle of the pack at 54th out of 100, but this masks the offsetting effect of different scores in the three component pillars.

An important point to bear in mind here is that for the purpose of the study, a “city” is defined as not as the metropolitan area, but as the city proper. In Toronto’s case this means the 416 alone, and in the case of some other cities, the area covered would be less even that what Toronto represents in its own region.

The topics under which cities were scored are summarized below (click to enlarge).

These components were weighted based on their importance within each group.

Under “People” (which deals mainly with mobility issues), Toronto ranks 65th with a score of 43.9%. The ranks and scores for sub-indices are:

  • Fatalities: 18th / 90.1%
  • Access to Transport Service (Bus and Metro stops per sq km): 64th / 10.8%
  • Modal Split: 54th / 36.5%
  • Rider Connectivity (WiFi): 67th / 32.8%
  • Upkeep of the Transit System: 67th (note that there were no data for 28 cities) / 66.7%
  • Wheelchair Access: 68th /55.9%
  • Uptake of Active Commuting: 84th / 7.9%
  • Transit Applications and Digital Capabilities: 73rd / 63.2%
  • Airport Passengers: 33rd / 53.3%
  • Hours of Metro Operation: 34th (in a group of 54) / 20%

Some of these numbers are a direct result of the scope of the review. For example, Toronto includes large suburban areas where route spacing is wider than downtown, and the stop density is lower. A “city” with a comparatively small suburban component would have a higher stop density. Similarly, the uptake of Active Transportation as a mode will be higher in a dense urban area than in the suburbs. By contrast, the percentage of passengers to the airport by transit is high. It could well be that the airport in question is on the Island, not Pearson Airport which is outside of the city proper. Moreover, even Pearson’s transit mode share for Toronto-based flyers is higher than for those in the 905 simply because there is better transit service available from Toronto (TTC and UPX).

Under “Planet” (which deals with environmental issues), Toronto does well at 32nd and a score of 62.5%. It is this comparatively high ranking that pulls up Toronto’s overall score and prevents it from falling to the lower tier of the global rankings.

  • Greenhouse Gas Emissions: 67th / 60.3%
  • Provision of Green Space: 57th / 20.6%
  • Congestion and Delays: 51st / 56.3%
  • Bicycle Infrastructure: 26th / 65.4%
  • Air Pollution: 8th / 90.3%
  • Efforts to Lower Transport Emissions: 40th / 40%
  • Electric Vehicle Incentives: 34th (in a group of 62) / 100%

Almost none of these scores has anything to do with the transit system directly with an indirect effect only through the absence of good transit as an alternative in some parts of the city.As for “electric vehicle incentives”, this consists of a provincial giveaway to new vehicle buyers, not a widespread availability of the infrastructure needed to operate these vehicles. A significant part of Toronto’s good score is its low air pollution which has much more to do with changes in industrial activity in southern Ontario and the midwestern USA than it does with transit policy.

Under “Profit” (which deals with financial issues), Toronto ranks poorly at 86th and a score of 31.9%.

  • Commuting Travel Time: 60th / 45.2%
  • Economic Opportunity: 25th / 58.7%
  • Public Finance: 74th / 14.5%
  • Efficiency of Road Networks: 94th / 14.6%
  • Affordability of Public Transit: 85th / 34.7%
  • Utilization of the Transport System: 46th / 32.3%

Toronto’s low score here is clearly a combination of the relatively low level of public financial support and the low efficiency of the road network, something one must reasonably ask whether we should want to improve. Indeed, “efficiency” is measured as the maximum speed of the road network on the premise that higher speeds show that the roads can operate more safely. I am not sure this is a valid metric especially if one’s goal is to discourage rather than build travel by private auto.

Public financial support is measured against the operating budget, not capital, and Toronto ranks low on this score because so much of its revenue comes from the farebox. The affordability index measures the ratio of a monthly pass price to average monthly net earnings in the city, and Toronto has a high-priced Metropass compared to much of the rest of the world.

These scorings are not intended as an absolute measure, but as a way of providing a comparison across many cities. Toronto may do relatively well within the North American context, but it is still very much a car-oriented city compared to other parts of the world, and its fiscal policies are rules by keeping taxes down, not by constant improvements to transit service.

Overcrowded Routes

The Toronto Star article revealed that many TTC routes are overcrowded, although the degree to which this is so and the time of day when it occurs varies across the system. The following two files contain the raw data as provided by the TTC, and charts showing the percentages of overcrowding by time period.

Overcrowded routes 2017-10-25 Data

Overcrowded routes charts 2017-10-25

These data do not appear in published reports, but they should be part of the CEO’s Report to indicate the degree to which the system is falling short of the Board-approved Service Standards (see section 3.2, p. 10). The TTC, after all, prides itself on being a customer-focussed organization.

Where there is only a slight difference between the average load and the standard, one might be tempted to let things be. However, a critical factor not included in the data is the degree to which individual vehicle loads vary from the hourly averages. This is an aspect of service which can be quite sensitive to service quality and bunching, with the trailing vehicles running half empty while leaders of bunches are crammed. The difference between the “average” rider experience and the “typical” one can be quite substantial.

The standards are intended to allow for this effect in that there is “elbow room” to accommodate small variations in average loads. However, when service is erratic, this leeway is insufficient, and the crowding on lead vehicles, coupled with the extra wait endured for them to arrive, make for a less than ideal experience. Indeed, a route might have average loads within standards but typical riding experience of crowded, irregular service.

Finally, the TTC is fond of saying that it cannot run more service because it has no spare vehicles. This only applies to peak services, however, when the fleet is stretched thin. For off-peak services, the real issue is that the TTC is pinching pennies on service, operating considerably less of it this year than they had originally planned. That’s a political decision, one that says a lot about the kind of city we live in.

Summary

There are many factors by which a transit system and a city could be measured, and these will always come with a set of caveats, long footnotes to explain how the numbers work, and how to filter out the oddballs among them.

That said, there is an important place for seeing the transit system through the eyes of its riders and the city through the eyes of its residents. This is not necessarily the same as a more narrow view of attainment of management goals, or of reviews that only look at the tourist version of a city rather than its many neighbourhoods.

TTC Service Changes Effective Sunday, December 17, 2017

The December schedules bring the opening of the Spadina subway extension to Vaughan Metropolitan Centre Station and a major reorganization of bus routes along the subway corridor.

2017.12.17_Service_Changes

Bus routes will be reorganized to serve the subway stations, and in some cases services will be split at the subway corridor. The map below is taken from the TTC’s project page for the line.

Services north of Steeles Avenue that were formerly operated by the TTC on behalf of York Region under contract will now be run by their own transit agency. Fares on the subway have yet to be integrated with YRT, and so a TTC fare will apply to subway journeys while a local YRT fare will apply to the bus feeder network. This is the subject of ongoing discussion, and as usual the issue is who will pay to subsidize a lower co-fare between the two agencies.

The subway will continue the same hours of service it now provides, and the new first/last train times are shown in the table below.

The first train of the day inbound from Vaughan will be at about 5:50 am except on Sundays when service begins at 7:50.

The late night schedule is driven by the long-standing meet at Bloor-Yonge between outbound trains to Finch, Kennedy and Kipling stations at 1:54 am. The last inbound train from Vaughan will leave just after 1 am, and the last outbound train will arrive at about 2:30.

Service on the bus routes affected by the subway is generally at levels similar to what operates today with only a few exceptions.

York Region Transit will take over service north of Steeles Avenue now provided by the following routes:

  • 35 Jane
  • 105 Dufferin North
  • 107 Keele North
  • 165 Weston Road North

Route changes:

  • 35 Jane and 195 Jane Rocket: Extended to Pioneer Village Station (Steeles).
  • 36 Finch West: Route split at Finch West Station (Keele & Finch) during most operating periods. Peak service west of Keele Street improved. Service east of Keele will be reduced in many periods recognizing that many riders will not ride east of the station.
  • 41 Keele: Local service extended to Pioneer Village Station. Express service terminated at Finch West Station.
  • 60 Steeles West: Service reorganized to focus on Pioneer Village Station rather than York University.
  • 84 Sheppard West: Peak period Oakdale service extended to Pioneer Village Station. 84E express from Yonge to Sheppard West Station replaces 196B York University Rocket.
  • 106 Sentinel: Formerly named 106 York University. Extended to Pioneer Village Station.
  • 107 St. Regis: Formerly named 107 Keele North. York U service rerouted and extended to Pioneer Village Station.
  • 108 Driftwood: Formerly named 108 Downsview. Extended to Pioneer Village Station.
  • 117 Alness-Chesswood: Formerly named 117 Alness. Rerouted to better serve the area west of Dufferin Street.
  • 196 York U Rocket: Replaced by the subway extension.
  • 199 Finch Rocket: York U branch cut back to Finch West Station.

Night service will be provided to the York U ring road by 335 Jane, 341 Keele and 353 Steeles. The 336 Finch bus will not serve Finch West Station.

Holiday Period Service

The summary of the schedule changes linked at the top of this article includes a page outlining the service to be provided through the December-January holidays. The highlights are:

  • Service on many surface routes and on Line 2 Bloor-Danforth will operate with summer schedules from Monday, December 18 to Friday, January 5. Extra school trips will not operate.
  • Christmas and New Year’s Days will operate with Sunday service including the 8:00 am opening time for the subway.
  • New Year’s Eve service will be extended on many routes until roughly 4:00 am with extra service on the subway.
  • Regular service resume on Monday, January 8, 2018.

New Year’s Eve services include:

  • Service is expected to operate free after 7:00 pm as in past years, but the details have not yet been announced.
  • The last train meet at Bloor-Yonge for outbound service will occur at 3:37 am rather than the usual 1:54 am. The last trains on 4 Sheppard and 3 SRT will wait for the last trains on 1 Yonge and 2 Bloor-Danforth respectively.
  • 501 Queen will divert via Church, King and Spadina after 11:00 pm for festivities at City Hall.
  • 509 Harbourfront will have extra service every 9 minutes until 2:00 am and every 15 minutes thereafter.
  • 510/310 Spadina will have extra service every 6 minutes until 1:30 am, every 8 minutes until 3:00 and every 12 minutes thereafter.
  • Gap and standby buses will be provided downtown and at other locations to provide extra service as needed.
  • Contract service outside of Toronto on 52 Lawrence West, 129 McCowan North and 68 Warden will be extended to 4:00 am. Service on 160 Bathurst North, 17 Birchmount and 102 Markham Rd will end at the usual time.

King Street Pilot Design Unveiled (Updated Oct. 30, 2017)

Updated October 30, 2017 at 10:00 pm: The City has announced the timing of various works to prepare King Street for the pilot implementation.

As various elements of the pilot appear, I will post photos here for those who are not regularly in the downtown area.

Updated October 25, 2017 at 10:50 am: The treatment of left turns from King at minor intersections, and of left turns onto King, has been clarified by the City. Also, my reference to a reduction in the number of taxi spaces in the banking district has been clarified.

The City of Toronto has released the design for new lane arrangements for the coming pilot of a transit and pedestrian oriented King Street that will go live in the second week of November.

The illustrations below are taken from a single long pdf on the City’s project website. Click for larger versions.

The pilot section of King to be modified runs from Bathurst to Jarvis. Between these bounds, through traffic will be discouraged by forcing motorists to turn off at regular intervals, and left turns will be banned.

The street will be broken into segments by intersections where all traffic except transit vehicles must turn off of King. Taxis are exempted from this rule between 10 pm and 5 am, but they must be bona fide, identifiable taxis, not Uber vehicles or private cars pretending to be.

  • Bathurst to Portland
  • Portland to Spadina
  • Spadina to Peter / Blue Jays Way
  • Peter to University
  • University to Yonge
  • Yonge to Church
  • Church to Jarvis

Vehicles wishing to access any segment of King will have to do so via the intersecting north-south streets, and through travel will be forced to divert to parallel roads.

At some locations it is now possible to make a left turn onto King from a north-south street (either a south to east or north to west turn). No ban on these turns is shown in the map, but they are not shown as possible ways to access King.

Some side streets such as Brant Street (other similar locations are Charlotte, Widmer, Duncan and Jordan, Victoria and Toronto Streets, and Leader Lane) can be accessed from King by left turns only during certain hours. It is unclear whether the hours of the ban will be extended or remain as is for the pilot.

Updated October 25: I asked the City to clarify these issues and they replied:

The map shows only new restrictions (all existing restrictions continue, and a note is being added to clarify).

Since we are making some signal changes, the left-turn prohibition is meant to apply to major (signalized) intersections. So some left turns, while being discouraged, are not prohibited. Of course, we will monitor and make adjustments as required if we start to see major impacts.

Similarly, we are not initially banning turns onto King Street, beyond existing restrictions, but these regulations could change over the course of the pilot project.

We fully expect that traffic patterns in the area will change significantly, and plan to respond accordingly. University Avenue is certainly one location that we’ll be watching closely.

[Email from David Kuperman, October 25, 2017]

At many locations, the transit stops will be moved “farside”, that is the streetcar will cross the intersection before stopping, and at these locations the sidewalk space will be widened out into what is now the curb lane to provide an expanded transit stop. The existing transit shelters will not be moved, but new ones will be installed at some of the relocated stops (the details are not yet published).

The farside stops will be protected from curb lane traffic with Jersey barriers that will be decorated for the pilot. Come the spring, a more attractive barrier such as planters might be used. The important point is that nothing will be “nailed down” and the configuration will be easy to change.

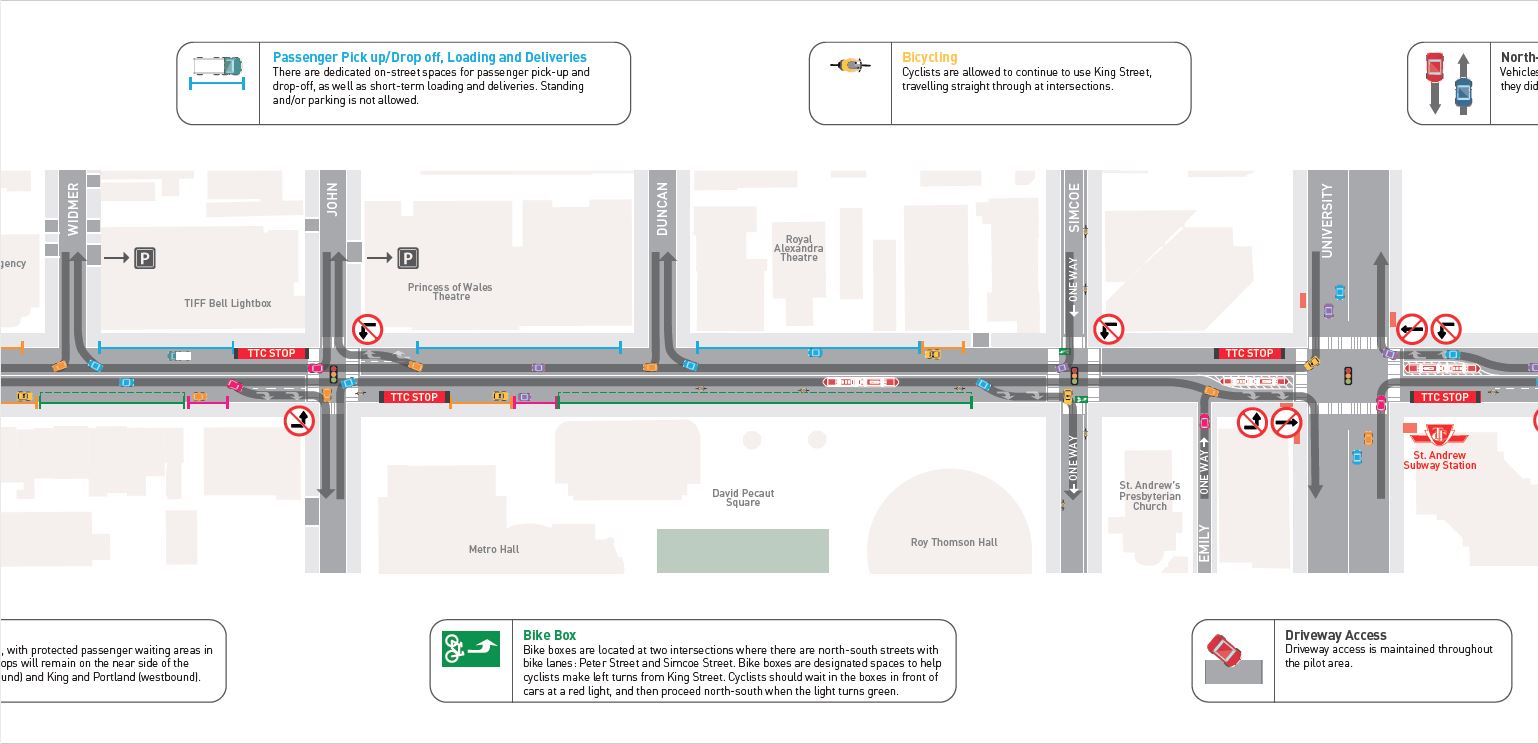
Sections of the curb lanes will be set aside for various purposes, and these are colour-coded in the diagrams below:

  • taxi zones (yellow)
  • accessible loading areas (pink)
  • passenger pick up/drop off/loading zones (blue)
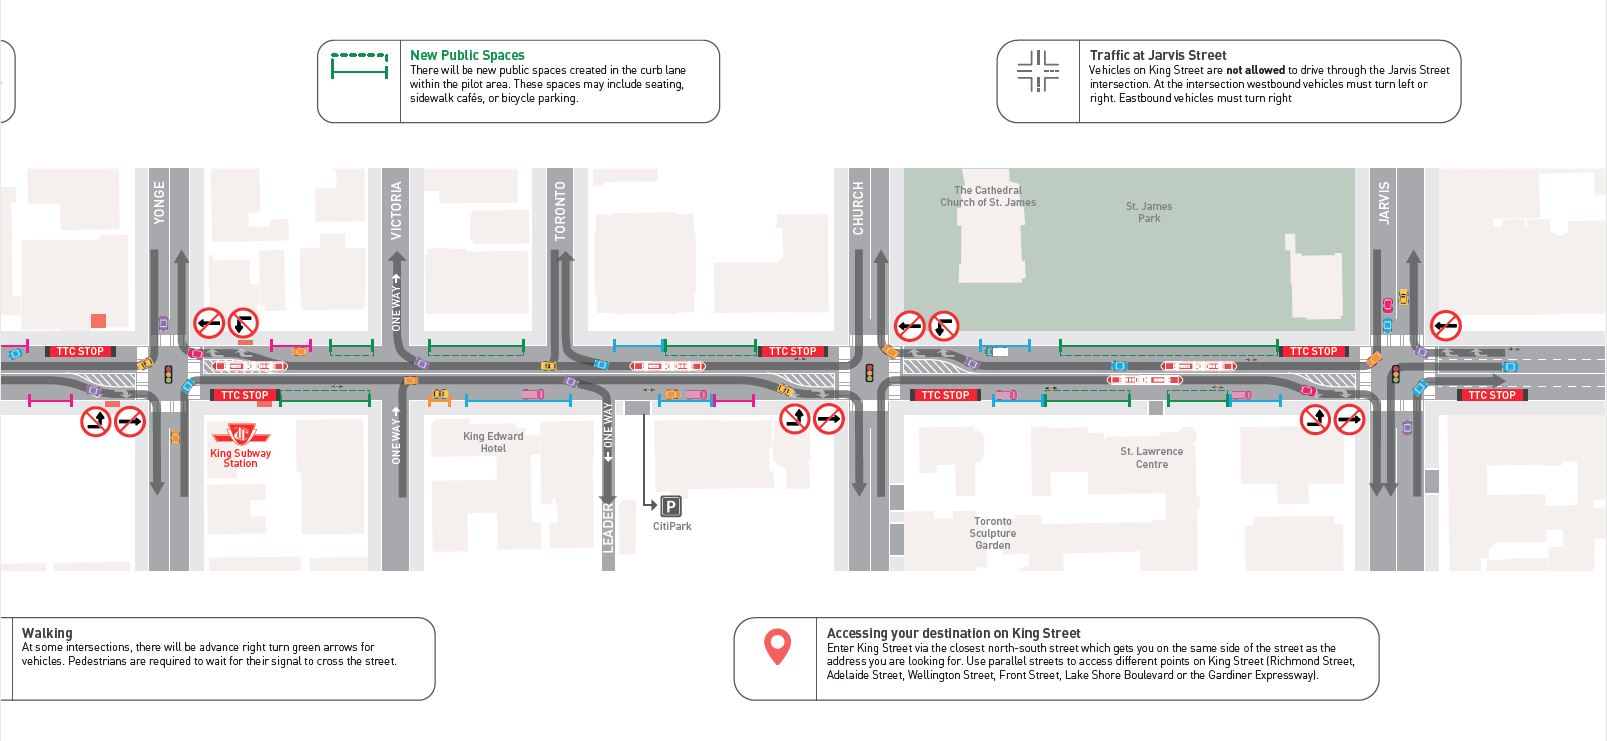
  • public spaces such as seating, cafés or bicycle parking (green)

The most challenging points for traffic will be at the entries to the pilot area eastbound at Bathurst and westbound at Jarvis where through traffic will be forced to turn right or left. Bathurst is already the site of congestion eastbound, particularly in the morning peak, although the turns will be simpler with little westbound conflicting traffic.

Pedestrians will also be subject to new rules with dedicated right turn phases to allow cars to make their turns off of King at some locations. This will be a new experience for downtown where pedestrians travel in waves that give little quarter to competing traffic.

Although there are designated cab stands, considerable portions of the street will be given over to pedestrian areas that cabs could not access, notably west of Spadina in what is now the busiest part of the club district. By contrast, the north side of King in the Theatre District from Simcoe west to Widmer is designated as a zone for pick ups and drop offs.

Generally speaking, the curb lane is not maintained as a continuous route for traffic.

Enforcement will be key to making this work, and there is a very real chance, given past experience with City and Police priorities, that actively managing the pilot area will be a short-lived affair. Mayor Tory has talked about “Traffic Wardens” in the new year, and these will have to be out in force.

Bathurst to Brant

Through traffic will be banned both at Bathurst and at Portland.

The eastbound stop at Bathurst will be shifted farside so that stopped streetcars do not block traffic that is forced to turn north from the streetcar lane. This should work provided that the streetcars are not bunched and blocked from crossing to the carstop because it is already occupied. The westbound stop will remain in its current location.

Portland is another break for through traffic on King, and through east-west moves will not be allowed here. As at Bathurst, the eastbound carstop will be shifted farside.

Spadina to Widmer

Both Spadina Avenue and Peter Street are locations where through traffic is not allowed. Carstops here will be moved farside in both directions. The elimination of through traffic at Spadina should make turns by streetcars, when they are necessary, a lot simpler because there will be less competing traffic. The large volume of pedestrians here is another matter.

Note that on both sides of King, there are areas earmarked for improvements that will block through traffic in the curb lane.

John to University

This is the main Theatre District with four major venues:

  • TIFF at the northwest corner at John Street
  • The Princess of Wales just east of John Street on the north side
  • The Royal Alexandra east of Duncan Street on the north side
  • Roy Thomson Hall on the southwest corner at Simcoe Street

The north side curb lane is dedicated mostly for drop offs and pick ups, and this is an area already heavily used by tour buses coming to the theatres. They are not intended to park in the drop off areas. On the south side, there are extended areas reserved for pedestrian improvements that will prevent travel in this lane.

The carstops at John are both shifted to the farside of the intersection. This will place the westbound stop right in front of the TIFF Lightbox building, and this stop will almost certainly be taken out of service when the annual film festival is running (assuming there even is a King car). Left turns will not be allowed at John Street in either direction.

At Simcoe, the left turn is now a considerable delay for King cars when the theatres are busy, and this turn will be prohibited.

University Avenue is another break in the segments along King, and its carstops will be moved farside in both directions. Left turns from King, now a considerable source of delay eastbound, will be banned.

York to Victoria

There is no longer a carstop eastbound at York, although the relocated University stop eastbound will be a stone’s throw from the old York stop’s location.

At both Bay and at Yonge, the carstops will be shifted to the farside of the intersection. Use of the curb lane space as a streetcar loading zone will considerably expand the space available to transit riders at these locations where today (except for Bay eastbound) the nearside stops are constrained by narrow sidewalks and subway entrances.

Through traffic will be allowed at Bay, but not at Yonge where all traffic must turn.

The area between York and Bay which is now an extended cab stand on both sides of the street, and part of it will remain for this purpose, but a good chunk in each direction is dedicated to a pick up zone. This will provide space for commercial vehicles loading goods, as well as for taxi drop offs. The net result of the change is a reduction in taxi stand spaces on this section of King, although they are more elsewhere.

Victoria to Jarvis

Church Street will be another of the locations where non-transit vehicles are forced to turn, and the carstops will be moved farside in both directions. This will have an effect on short turns and diversions nominally headed to “Church Street” because there will no longer be an eastbound carstop there for them to use.

The curb lane in the area between the St. Lawrence Hall and St. James Cathedral and Park is largely given over to pedestrian improvements. This will have a significant effect for trucks that now use this area as parking during the Saturday market hours.

At Jarvis, as at Bathurst, all incoming traffic will be forced to turn. This presents a potential problem for westbound streetcars during periods when Jarvis southbound become impassible and traffic wishing to turn west to south will have no place to go.

This article will be updated as further information about the pilot’s design becomes available.