
On the Torontoist, I wrote an article reviewing experience with the King Street Transit Pilot and some of the preliminary claims and reactions to it. This piece is the first of the technical follow-ups to that article with more detailed data about the behaviour of transit service on King.
Note that this analysis only covers the operation of transit vehicles, not of general traffic. For information on other data collected by the City of Toronto, please refer to the “data” page on the project’s site.
This article deals with travel times on various parts of the King route both inside and outside of the Bathurst-Jarvis pilot area. Following articles will address capacity and service reliability.
For a review of operations up to the end of November 2017, please see:
- Analysis of Route 504 King: November 2017 (Part 1: Preliminary King Street Pilot Review)
- Analysis of Routes 501 Queen and 6 Bay: November 2017 (Part 2: Preliminary King Street Pilot Review)
Averages versus Individual Data
In reporting the change in travel times, the City of Toronto cites averages, maxima and minima for the “before” and “after” conditions. For example, in the chart below, eastbound trips in the PM peak before the pilot ranged in length from 13.0 to 25.0 minutes with an average of 18.9.
However, the “before” numbers omit some of the worse cases for travel times:
- The period of the Toronto International Film Festival from September 7-17, 2017. During early days of TIFF, service was diverted via Spadina, Queen and Church adding greatly to travel times. Even after King Street nominally reopened, service was interrupted from time to time with unannounced diversions.
- The period of track construction at Queen and McCaul Streets from October 16-27, 2017. This period saw 501 Queen streetcars shift south to King adding turning movements at Church eastbound and Spadina westbound that took place generally without any transit priority. Some traffic spillover from Queen to adjacent streets occurred, but this was not measured.
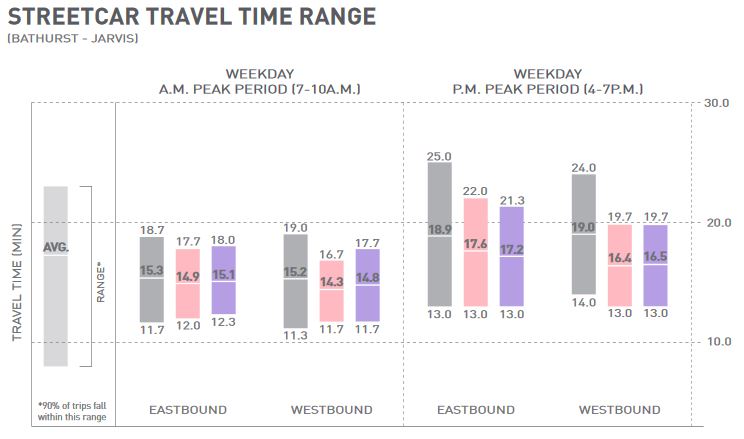
Gray: Pre-pilot Pink: November Mauve: December
Although omission of these two periods puts the best possible light on the “before” conditions and avoids criticism that the project is making a worst/best case comparison, it is a fact of life that service and travel times on King are routinely affected by various projects including construction and special events. A valid test for the pilot will be the street’s operation during a Queen Street shutdown for an event at City Hall or at Much Music. How will transit service and other traffic behave when part of the downtown network is taken “offline”? This remains to be seen.
The averages are the most commonly cited data in the press and in political comments. However, these averages hide a great deal.
- Travel times vary considerably from hour to hour, and from day to day.
- A three-hour average over the peak period includes many trips that occur under less-than-peak conditions, and this pulls down the averages.
- Averaging data for several weeks smooths out the effect of daily variation.
- Averaging over the entire pilot area merges data from areas where the pilot’s effect is small with those where it is large.
- Averaging over only the peak periods misses the benefits, if any, of the pilot for off-peak operations.
Chart Format
In an attempt to boil a great deal of data down to a manageable, understandable format, I have played with various presentations. Some of them are very impressive and colourful, and might make interesting art for a subway station. However, understanding the more complex charts requires good familiarity with the data – in effect I am seeing what I expect to see because I already know what is there, but this is not much use to general readers. In the end, I opted for the “kiss” principle with simple charts in the following format.

This shows the travel times for westbound vehicles crossing Jarvis Street between 5:00 and 6:00 pm from September through December, 2017. Horizontal lines give the daily values, while vertical lines bound periods where conditions changed.
- The orange line is the 85th percentile below which most times fell, but it must be remembered that 15% of trips lie above this.
- The blue line is the 50th percentile where half of the trips are above and half below.
- These two lines are close together because the data values are clustered over a short range in most cases, and so one gets from the 50th to the 85th percentile with a small increase in travel times.
- The vertical red lines show the bounds of TIFF. For September 7-8, the travel times are tracked over the planned diversion via Queen Street and so they are much longer than trips via King.
- The vertical yellow lines bound the period when Queen was closed at McCaul.
- The green vertical line shows the beginning of the King Street Pilot. (Although it is green, this band may show up as black depending on your display.)
- Where there is a gap of the value drops to zero (no examples on this chart), there were no vehicles making the trip on the day and hour in question due to a long delay or diversion.
Although I have all-day data, in order to keep the volume of charts down to a reasonable level, I focus here on five one-hour periods over the day:
- 8:00 to 9:00 am: This is the peak of the am rush.
- 1:00 to 2:00 pm: This is the midday peak downtown, and it also corresponds with the “going in” period for matinee performance in the theatre district.
- 5:00 to 6:00 pm: This is the peak of the pm rush.
- 8:00 to 9:00 pm: Late enough to be clear of the rush period, but into the start of the entertainment district’s busy time in the evening.
- 10:00 to 11:00 pm: A busy period for the entertainment district, and also the typical letting-out time in the theatre district.
Here are the charts for the westbound and eastbound travel across the pilot area.
Westbound:
- 504_20170912_WB_Jarvis_Bathurst_MonthLinkStats
- AM Peak:
- The large peak on September 7-8 corresponds to the TIFF diversion that substantially increased trip times.
- There is a small increase during the Queen/McCaul construction.
- There was a delay east of University beginning just before 8 am on October 30 that produced a spike in travel times. (Details below)
- The pilot running times are very slightly higher than the pre-pilot period possibly because the stop at Jarvis is now farside and counts in the time.
- Midday:
- The TIFF and Queen/McCaul periods both contribute to longer running times, and there is a small improvement after the pilot begins, unlike the AM peak.
- PM Peak:
- The TIFF and Queen/McCaul effects are even more pronounced for the PM peak. This is a particularly good example of how the pilot results have “shaved off” peaks in running times, although this was less successful in December. The spike on November 2 corresponds to a delay downtown during a period that was quite congested overall. (Details below)
- Early Evening:
- Travel times show a slight improvement, although more data will be needed to determine whether the rise in December values persists into 2018.
- Late Evening:
- Travel times show a distinctive repeating character that corresponds to busy nights in the entertainment district. The effect is compounded by the Queen/McCaul construction. Note that values after the pilot begins are much less “spiky”.
Eastbound:
- 504_20170912_EB_Bathurst_Jarvis_MonthLinkStats
- AM Peak:
- Travel times in the AM peak were only slightly reduced. This is unsurprising given the low level of congestion downtown at this time. The spike on October 19 was caused by a delay west of Spadina. (Details below)
- Midday:
- As in the morning peak, there was a slight drop in travel times with the pilot. The Queen/McCaul project’s effect is clear, and two of the three peaks are Wednesday which include the extra traffic from theatre matinees.
- PM Peak:
- Travel times during the TIFF diversion days, September 7 and 8, were extremely long with Bathurst to Jarvis times over one hour. (Details below)
- The travel time spikes in October and November almost all occur on Thursdays. Possibly due to events elsewhere that affect the downtown network. On November 30, the spike was caused by traffic backing up across north-south intersections preventing streetcars from getting through. (Details below)
- Early Evening:
- Travel times settle down in the evening compared to the peak, but unplanned delays at TIFF took their toll.
- Late Evening:
- Almost all of the peaks during the late evening occur on Fridays when the entertainment district is busy, but the problem largely vanished once the pilot began.
- The zero value on November 20 corresponds to a diversion via Shaw, Queen and Spadina around a delay west of Bathurst. Because the cars were off route crossing Bathurst, they were not included for travel time calculations across the pilot area.
Details of Specific Dates
The charts below map the position of TTC vehicles over a three hour window as they move back and forth across the route. The slope of the lines indicates the speed with steeper lines corresponding to faster travel. Horizontal lines are stopped cars.
Thursday, September 7 & Friday, September 8
These were the two weekdays of the TIFF diversion, and its effect was stronger on eastbound than on westbound service. Although there was a delay west of Strachan just before 5 pm on September 7, the main problem is the extended travel times between Spadina and Church via Queen. This shows up on the September 8 chart when there is no other delay.


Thursday, October 19
There was an extended delay west of Spadina that contributed some long trips to the 8-9 am spike seen above. Because Queen was closed at McCaul, service was not diverted, although it is unclear why a Shaw, Queen, Spadina route was not used.

Monday, October 30
A delay east of University caused the spike in westbound travel times during the 8-9 am period. Shortly after the delay began, service was diverted via Queen. Cars that had been trapped were turned back from Spadina.

Thursday, November 2
The pervasive problem on November 2 was traffic congestion across much of the route, not just downtown but notably westbound through Parkdale to The Queensway.

Thursday, November 30
The chart below shows the problems of cars taking a long time to clear intersections during the 5-6 pm rush hour. The situation is worse eastbound because southbound auto traffic tends to back into the intersection and affects the eastbound (southerly) lanes more than the westbound.

Section by Section Data
Jarvis to Yonge
Westbound
- 504_20170912_WB_Jarvis_Yonge_MonthLinkStats
- There is little change in travel times (which were already short) here because congestion, when it occurs, tends to be close to Yonge. The primary benefit of starting the pilot area at Jarvis is to get the street “switched over” to transit mode before hitting the busiest section.
Eastbound
- 504_20170912_EB_Yonge_Jarvis_MonthLinkStats
- As with the westbound travel, there is little difference before and after the pilot.
- Because the busy stop at Yonge is now farside, dwell time there counts into the journey east to Jarvis. The Jarvis stop is also farside, but is not as busy and primarily drops off riders.
- During TIFF, travel times are higher because “Yonge to Jarvis” starts at Queen & Yonge and travels via Church. (The westbound TIFF diversion does not start until York Street.)
Yonge to University
Westbound
- 504_20170912_WB_Yonge_University_MonthLinkStats
- Westbound travel times were generally shorter and more reliable after the pilot began.
- During TIFF, travel times are higher because “Yonge to University” runs via York Street to Queen.
- There is little congestion in the financial district in the evening, and so the travel times are unchanged with the pilot.
Eastbound
- 504_20170912_EB_University_Yonge_MonthLinkStats
- As with westbound travel, the eastbound times were slightly more reliable after the pilot began with the main effect being during the PM peak.
- During TIFF, the King car operated via Queen which is a slower route.
University to John
Westbound
- 504_20170912_WB_University_John_MonthLinkStats
- The main effect after the pilot begins is to shave off the peaks of travel times during the PM peak and evenings on nights that are busy in the entertainment district.
Eastbound
- 504_20170912_EB_John_University_MonthLinkStats
- Travel times show the Thursday spikes seen in the overall Bathurst-Jarvis chart. This area contributes to the late week spikes even with the pilot in place.
John to Spadina
Westbound
- 504_20170912_WB_John_Spadina_MonthLinkStats
- Travel times did not change much after the pilot began, but the peaks seen before the pilot have been shaved off.
- Very high times during the Queen/McCaul project were caused by the backlog of streetcars turning west to north at Spadina with little or not assistance or transit priority. This is a chronic problem for diversions at where signals do not assist streetcars with their turns.
Eastbound
- 504_20170912_EB_Spadina_John_MonthLinkStats
- Travel times eastbound are about the same before and after the pilot as this area and direction do not see much congestion.
Spadina to Bathurst
Westbound
- 504_20170912_EB_Bathurst_Spadina_MonthLinkStats
- Travel times improved slightly in this area after the pilot began.
- This segment is a contributor to the late-week spikes in times
Eastbound
- 504_20170912_WB_Spadina_Bathurst_MonthLinkStats
- Travel times in the evening are slightly faster, but more importantly reliable after the pilot began.
- The spike on November 23 was caused by a delay west of Spadina. Most service diverted around this, but the cars that were held went into Charlotte Loop, and so registered long Bathurst-to-Spadina running times in the stats.
The importance of all this detail is that transit priority improvements like the King Street Pilot have many components that behave differently by time, day of week, location and direction. Understanding the benefits of the changes as well as the potential effects of scaling back the pilot requires this level of analysis. A supposed “fix” for one location and time applied across the pilot area could have unwanted consequences.

At the risk of jumping the gun on a planned future post, I recall reading an argument somewhere (the Twitter?) that the comments about shorter travel times weren’t just about actual in-vehicle travel time, but also about time spent waiting for a streetcar, which also matches the way that TTC measures service enhancements (i.e., waiting time is, er, weighted more substantially than in-vehicle time).
The time-space diagrams are really helpful. With all the talk about overcrowding, I had thought that part of the delay would be the added time to try and stuff one more rider into the sardine can (or for one rider to try and jostle through the sardine can before getting to the exit), but that doesn’t appear to be a major factor in the Nov. 30 plot. A lot of the eastbound delay does look like southbound traffic blocking the intersection (the streetcar can get to the intersection easily but is blocked from getting through), but eastbound between John and University looks different — it looks like right turns at University are not getting through and are spilling back into the streetcar lane (the streetcar can’t even get to the intersection).
Steve: I plan a more detailed review of travel times at the micro level to pick up intersection delays and stop service times.
LikeLike
1. Have the City & TTC put proper transit priority into effect in the Jarvis to Bathurst stretch yet?
Steve: I don’t think so, but have inquired.
2. Though I can see the value of far-side stops as they make right-turns much smoother for vehicles there are clearly problems when there is very frequent service and the ‘following car’ gets stuck on the wrong (near) side of an intersection while Car #1 loads/unloads. Not sure there is a good answer to this except better spacing and speedy loading.
LikeLike