
On the Torontoist, I wrote an article reviewing experience with the King Street Transit Pilot and some of the preliminary claims and reactions to it. This piece is the first of the technical follow-ups to that article with more detailed data about the behaviour of transit service on King.
Note that this analysis only covers the operation of transit vehicles, not of general traffic. For information on other data collected by the City of Toronto, please refer to the “data” page on the project’s site.
This article deals with travel times on various parts of the King route both inside and outside of the Bathurst-Jarvis pilot area. Following articles will address capacity and service reliability.
For a review of operations up to the end of November 2017, please see:
- Analysis of Route 504 King: November 2017 (Part 1: Preliminary King Street Pilot Review)
- Analysis of Routes 501 Queen and 6 Bay: November 2017 (Part 2: Preliminary King Street Pilot Review)
Averages versus Individual Data
In reporting the change in travel times, the City of Toronto cites averages, maxima and minima for the “before” and “after” conditions. For example, in the chart below, eastbound trips in the PM peak before the pilot ranged in length from 13.0 to 25.0 minutes with an average of 18.9.
However, the “before” numbers omit some of the worse cases for travel times:
- The period of the Toronto International Film Festival from September 7-17, 2017. During early days of TIFF, service was diverted via Spadina, Queen and Church adding greatly to travel times. Even after King Street nominally reopened, service was interrupted from time to time with unannounced diversions.
- The period of track construction at Queen and McCaul Streets from October 16-27, 2017. This period saw 501 Queen streetcars shift south to King adding turning movements at Church eastbound and Spadina westbound that took place generally without any transit priority. Some traffic spillover from Queen to adjacent streets occurred, but this was not measured.
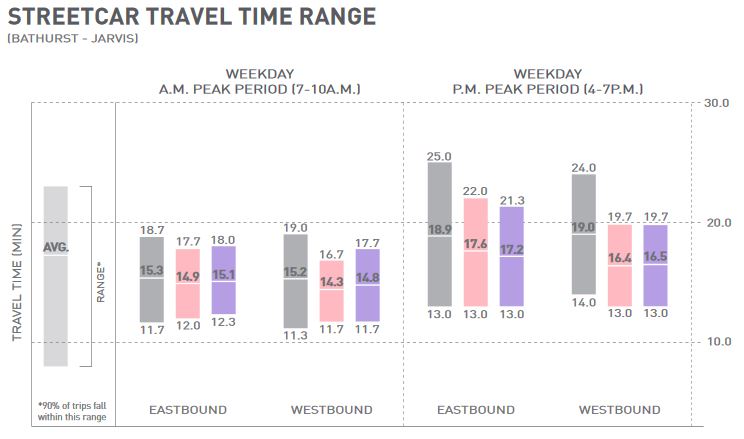
Gray: Pre-pilot Pink: November Mauve: December
Although omission of these two periods puts the best possible light on the “before” conditions and avoids criticism that the project is making a worst/best case comparison, it is a fact of life that service and travel times on King are routinely affected by various projects including construction and special events. A valid test for the pilot will be the street’s operation during a Queen Street shutdown for an event at City Hall or at Much Music. How will transit service and other traffic behave when part of the downtown network is taken “offline”? This remains to be seen.
The averages are the most commonly cited data in the press and in political comments. However, these averages hide a great deal.
- Travel times vary considerably from hour to hour, and from day to day.
- A three-hour average over the peak period includes many trips that occur under less-than-peak conditions, and this pulls down the averages.
- Averaging data for several weeks smooths out the effect of daily variation.
- Averaging over the entire pilot area merges data from areas where the pilot’s effect is small with those where it is large.
- Averaging over only the peak periods misses the benefits, if any, of the pilot for off-peak operations.
