
An important issue for the King Street Transit Priority pilot is the rising demand on that corridor. Previous TTC stats showed a total of 65,000 riders using the 504 King and 514 Cherry lines combined, but this has now been updated to 71,000 even before the pilot began. Further growth comes from riders attracted to the improved service, and the line is now crowded beyond capacity at some times and locations.
The TTC has announced “improvements” from time to time on the King route, but this masks declines in service capacity.
The service design for the am peak period uses a base service about every 4 minutes overlaid by peak “trippers” that bring the headway down to about 2 minutes. However, the number of trippers has fallen over the years and in practice, the “wave” of very frequent service now lasts only about half an hour. This comes eastbound on King at Dufferin 6:50 and 7:20 am, westbound at Broadview between 7:45 and 8:15 am, and eastbound again between 8:55 and 9:25 am.
There are now seven trippers where once there were sixteen, and for some time streetcars on the trippers were replaced by buses at a lower capacity. Recently, peak vehicles were swapped between 504 King and 505 Dundas so that the trippers could revert to streetcar operation.
When buses began operating on 504 King, the TTC claimed that this was a service improvement. This was true for a time when buses allowed the service to build back to its previous high point, but over time the number of bus trippers fell.
Using the TTC’s vehicle tracking data, one can plot the actual capacity operated at various points and times on King Street. These are actual, not scheduled, capacities, and they reflect the day-to-day fluctuations in service and vehicle types. For the purpose of the charts here, the Service Standards planning capacities are used. These are not the crush capacity of vehicles, but a target level in Board-approved TTC standards for an average level of crowding that should not overwhelm the service with loading delays and severely uncomfortable conditions. Whether the TTC actually achieves this is another matter, but the numbers give an indication of the relative levels of service operated over time.
The Service Standards for peak period vehicle capacity are:
- Bus: 51
- Standard streetcar (CLRV): 74
- Two-section streetcar (ALRV): 108
- New five-section streetcar (Flexity): 130
[Service Standards at p. 10]
Here is an example of one chart showing capacity eastbound at Bathurst & King between 7:00 and 8:00 am from January 2016 to December 2017 (note that February 2016 data are missing).
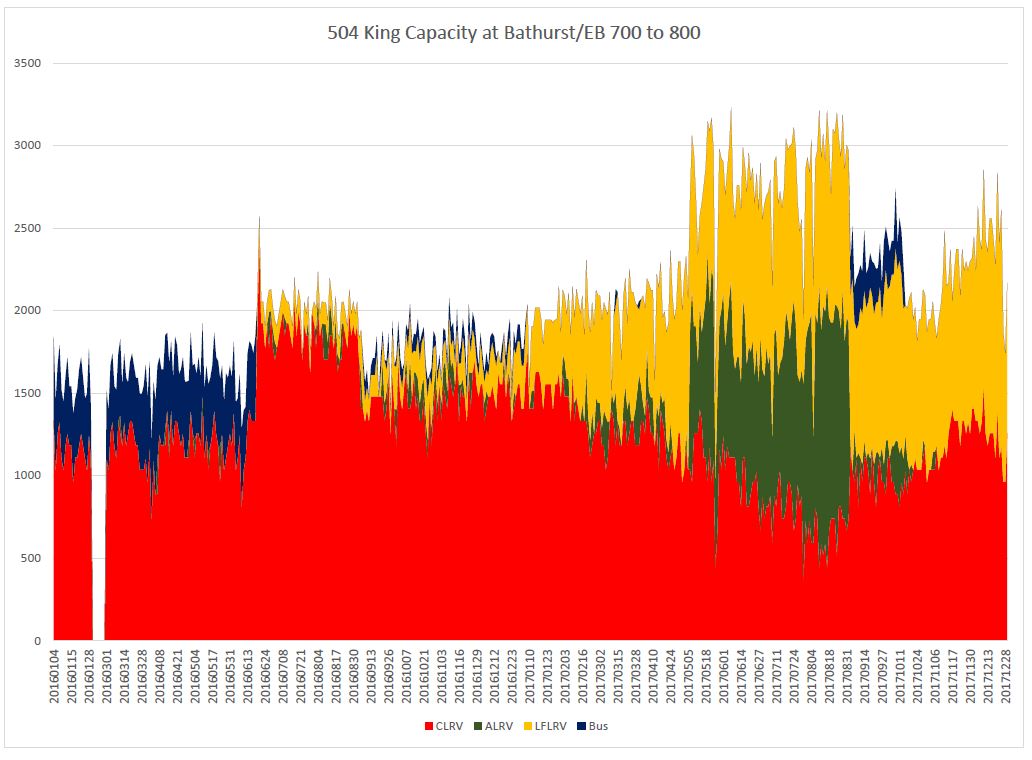
The capacity provided here was at its height in the spring and summer of 2017 when ALRVs normally used on 501 Queen were redeployed to 504 King. In fall 2017, service levels were reduced because of the change in vehicle type.
Noteworthy in this chart is the growth in capacity provided by Flexitys first on 514 Cherry (building up to full low-floor operation by mid 2017) and more recently with the addition of the new cars to 504 King. Although they do not make up half of the vehicles operating on King, they account for half of the capacity in the central section.
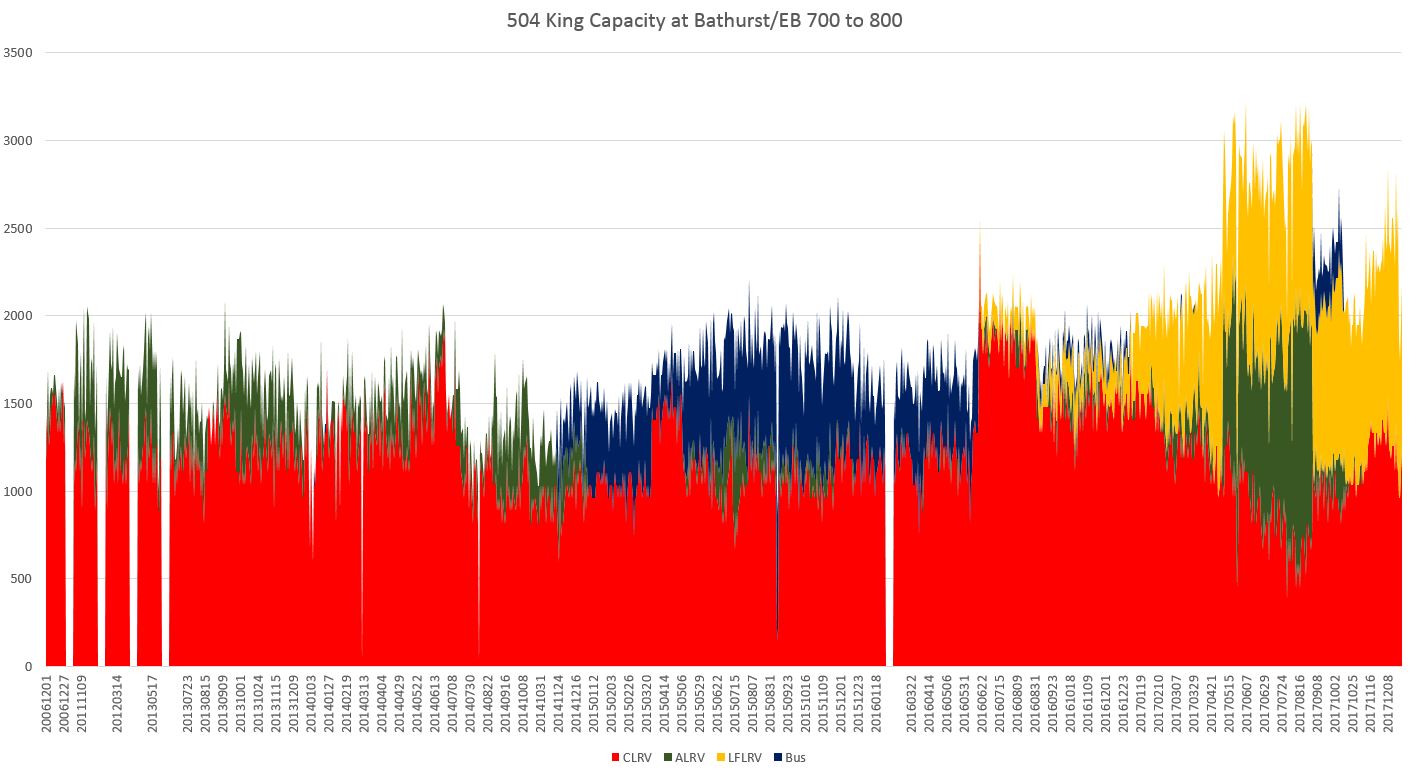
For a longer-range view of capacity, here is the same chart with data (where I have the details) going back to December 2006. This illustrates the long period during which the capacity provided on 504 King was static even as land along the route redeveloped. This is a chronic problem on the streetcar routes because an order for new cars and a larger fleet was delayed so long.
The sets of charts below illustrate capacities at five locations and times. Each set contains four charts covering the peak periods from 6-10 am and 3-7 pm depending on which period is illustrated.
Service eastbound at Jameson does not include the 514 Cherry cars which enter the route at Dufferin. Flexitys appear here only after their recent addition to 504 King. Note how the capacity provided here drops in the hour from 8-9 am compared to those on either side of it.
Service eastbound at Bathurst includes the 514 Cherry cars and the growing contribution of Flexitys on this route is evident from June 2016 onward.
The PM peak service design is different from the AM in that there are few or no trippers (depending on which schedule one considers), and so this location has been less affected by cutbacks in that part of the service. However, service capacity has not changed much over the past two years especially during the peak 5-6 pm hour.
The situation at Bathurst is similar to that at Yonge, although it can be affected by cars short-turning at Spadina. After the 503 service is added in February, the capacity at Yonge will be slightly higher than at Bathurst.
The capacity of service outbound west of Dufferin is, if anything, lower now than it was in past years. This reflects the concentration of service east of Dufferin with the coming of the 514 Cherry route.
In summary, riders who believe that service, as measured by capacity, has been better in the past are in many cases correct. An important part of the King Street Pilot will be to determine how much latent demand can be attracted to the route through the combination of lower travel and wait times, and greater route capacity.
