There are few service changes in the October schedules taking effect on Sunday of Thanksgiving weekend.
Route 501 Queen streetcar service will be extended nominally to Sunnyside Loop, although pending completion of overhead in the loop, cars will circle Roncesvalles Carhouse instead. The last westbound and first eastbound stops will be on the east side of Roncesvalles at Queen. 501L bus service will continue to operate from Dufferin to Long Branch with a small reduction of service in some periods.
Some routes have added trips to serve school trips and other time-of-day specific demands (details in the linked spreadsheet):
9 Bellamy
25 Don Mills
37 Islington
42 Cummer
84 Sheppard West
96 Wilson
New express stops are added on:
905 Eglinton East Express
985 Sheppard East Express
Seasonal changes:
86 Scarborough Saturday late evening service adjusted for earlier Terra Lumina closing time.
172 Cherry Beach weekend service suspended (weekday service will operate until November 18).
175 Bluffer’s Park service suspended.
Miscellaneous:
31B Greenwood to Eastern Ave service end-of-line location shifted west from Minto to Knox and Eastern.
55 Warren Park adjusted to consistently leave Jane Station on the :15 and :45 after the hour.
506 Carlton shifted from Roncesvalles Carhouse to Leslie Barns.
This article continues a review of what the TTC aims for, at least on paper, in service quality, and how their success (or lack of it) in providing good service is reported for public and political consumption. The framework for this commentary is the CEO’s Report, using the August 2022 version as a reference point.
I deliberately broke this discussion into two parts. The first looked at the various figures related to system performance are presented and how they reveal or hide critical information.
The TTC Board is notoriously unwilling to get into the weeds on system statistics, operations and finances. Superficial analyses in the CEO report give them nice pictures and charts to look at, but that is not the same as a discussion of key issues and future risk. This is vital in any planning for recovery from a pandemic that will continue to affect the TTC in 2023 and beyond. There is a separate detailed quarterly report that reviews finances and the state of major capital projects, but it does not address many issues notably the cost and capability for growth as ridership returns to the system.
While it may suit those who run the TTC and the City to keep this discussion under wraps, that cannot be done for long as the 2023 budgets will be upon us immediately after the coming municipal election. There is a lot of great talk about the importance of transit, but this does not translate into real understanding and support beyond a few very large construction projects. (That statement applies equally to Metrolinx and GO, but my focus here is on the TTC.)
Key points:
Although fare revenue recovery is reported, this is not matched against cost growth. Fares have been frozen through the pandemic. Even at recovery to 100 percent of pre-pandemic ridership, the proportion of costs borne by fares will have fallen and the need for subsidy will be higher. “Full service” will cost more in 2023 than it did in 2020, even without the added cost of improving beyond historic levels.
Ridership recovery takes place at a different rate on different routes and modes, not to mention time-of-day.
Underutilized fleets provide a reserve for service improvements, provided there are drivers for the vehicles, up to the point where the need for spare buses and streetcars limits service growth. After that point, growth hits a knee in the cost curve as new capital assets must be acquired.
Asset reliability is reported as the proportion of scheduled service actually operated, but with no sense of how much reserve exists in the fleet.
Fleet reliability is reported in a way that prevents direct comparison between segments, notably various types of buses. Although there is a target for reliability, the degree to which this is exceeded (in effect the headroom for better utilization) is not reported.
Service reliability and quality are reported on broad averages across routes and days, with no indication of the variation across the system. Purported “on time” metrics do not reveal actual rider experience.
There is no report of:
the amount of scheduled service that does not operate because no driver is available;
the utilization and effectiveness of Run-As-Directed buses;
the amount of bunching and gaps as a proportion of service operated;
routes with demand, service levels, crowding and headway reliability issues.
This review does not look at the WheelTrans system and accessibility in general because it has a raft of issues of its own on matters such as adequacy of service, dispatching, the online booking interface, qualification for service and the TTC’s attempt to shift riders at least partly onto the “conventional” system through the “Family of Services” program. An important issue for WheelTrans overall is that it is entirely funded by the City of Toronto with no assistance from other governments. This makes it particularly vulnerable to penny-pinching efforts by those who guard our “precious tax dollars”.
Some of the material in these articles will be familiar to readers, but my purpose here is to consolidate many thoughts, some old, some new, in one piece. My hope is to inform discussion about transit’s recovery in Toronto and in particular to provide context for the inevitable political debate about what we should attempt, and the managerial issues of knowing whether we have succeeded.
Updated Aug. 30/22 at 1:25pm: Sundry typos and grammatical faux pas corrected. No substantive change to the text.
Since early 2020, the TTC and transit systems everywhere have wrestled with the ridership and revenue losses of the pandemic era. The goal of both management and politicians has been to just “keep the lights on” and provide some level of transit service. Toronto, with the aid of Ontario and Canadian governments, has worked particularly hard to continue an attractive service, at least on paper.
Service quality is a real bugbear for me, and the widening gap between the advertised service and what is actually provided should be a major concern. Next year, 2023, Toronto will likely see the end of special Covid-related subsidies, and a growth in demand back to pre-pandemic levels, although the timing of these events could prove challenging. Meanwhile, City Council “net zero” emission plans call for a major shift of travel onto transit. This will not happen with a business as usual approach to transit.
The focus must shift from muddling through the pandemic to actively improving the transit system, and to doing that with more than a few subway lines whose first riders are almost a decade away.
Key to running more and better transit is a solid understanding of how the system performs together with a planning rationale for growth. This brings me to two documents: the TTC’s Service Standards and the monthly statistics included in the CEO’s Report.
In this first of two articles, I will review the Service Standards and discuss some general principles about reporting system behaviour. In the second, I will turn to the CEO’s Report.
There are two essential problems:
The actual machinery of the Service Standards is not well understood, and the current document was endorsed by a previous TTC Board almost without debate. Superficially, the standards appear to call for good service, but in practice they hide as much as they show in reporting on quality. The Board did ask for follow-up information on improving standards (more service, less crowding), but management never delivered this feedback.
To the degree that management reports system performance, this is done at a summary level where the day-to-day reality of transit service and rider experience are buried in averages that give no indication of how often, when or where the standards are not achieved.
The spreadsheet detailing all of the changes has been added at the end of this post.
The number of the Mimico GO shuttle has been corrected to 176.
Transfer arrangements at Queen & Dufferin for the 501 bus and streetcar services have been clarified.
Transfer arrangements at Queen & Roncesvalles for the 501 and 504 bus services have been added.
Updated September 5, 2022:
The spreadsheet listing all of the changes has been corrected for route 504 King. The original version included a description of the route carried over from the August version. This has been changed to reflect the September arrangements.
The TTC will make many changes to its scheduled service on September 4, 2022 with restorations of previous service levels on many routes. This will not get the system back to 100% of pre-pandemic levels.
An important distinction is between three values:
The amount of service scheduled before Spring 2020
The amount of service budgeted for 2022
The amount of service scheduled for 2022
The TTC plans to be back to 97% of budgeted service for bus, 84% for streetcar and 92% for subway. The overall numbers are compared below.
Hours/Week
Regular
Construction
Total
January 2020 Scheduled
185,825
7,068
192,893
September 2022 Budgeted
186,379
6,398
192,777
September 2022 Scheduled
177,930
4,965
182,895
In the original 2022 service budget, the TTC planned to be back to roughly the same level of service as in January 2020 by September 2022. However, slower ridership recovery coupled with staffing constraints produced a lower scheduled service expressed as hours/week.
There are further caveats:
The distribution of hours by time of day might not be the same in 2022 as in 2020 because of changing demand patterns.
Changes in running times to deal with congestion or service reliability can mean that the same service hours are stretched over wider headways. Not all vehicle hours are created equal.
All that said, there are many changes in service levels, and with the bus network being back to 97%, the schedules for September 2022 are often based on old versions before service cuts were implemented. Another change for this month is the reintroduction of school trips on many routes.
In a recent article, I reviewed route-level ridership data cited in the 2023 Annual Service Plan as well as the 2019-2021 numbers posted on the TTC’s Planning web page.
During debate at the July 14 TTC Board meeting, an issue came up about the unexpectedly poor performance during the pandemic era of 25 Don Mills. This got me thinking about how the “results” could be influenced by when counts were done and particularly on routes that have both express and local branches under different route numbers.
To explore this, I recast the 2019-2021 stats in tables with and without the express 9xx routes consolidated into their local equivalents.
First, here are the stats with the local and express routes separate. The gallery below contains the first set of routes, but the complete list is in the following pdf. The data here are the same as presented in the previous article, but reformatted for easier browsing.
The three express/local routes on these sample pages show the differing effects.
Route
2019
2020
2021
% Recov 2020
% Recov 2021
Victoria Park
24 local
22,751
12,233
14,077
54%
62%
924 express
6,472
3,663
57%
24/924 local+express
29,233
12,233
17,740
42%
61%
Don Mills
25 local
27,988
16,481
18,719
59%
67%
925 express
16,624
9,074
55%
25/925 local+express
44,612
16,481
27,793
37%
62%
Dufferin
29 local
27,487
23,021
22,087
84%
80%
929 express
15,722
13,238
84%
29/929 local+express
43,209
23,021
35.325
53%
82%
In all three cases, the express service did not operate in 2020, and so all of the riding, such as it was, occurred on the local route number. This inflated the apparent ridership retention of the local route over the actual level on the corridor considering the two routes as one operation.
The effect was so strong on Dufferin that its local recovery rate went down slightly in 2021 because growing demand on the corridor was not enough to offset the shift of riders back to the express service.
The moral of the story here is that looking at stats in isolation can lead to incorrect conclusions if the underlying network and service plan are not taken into account. This applies to simplistic rankings such as “top 20” and “bottom 20” that can exclude routes with almost identical performance. A better metric would be the collection of all routes above or below a certain recovery rate.
Politicians who fund and, nominally, direct transit systems love easy-to-understand metrics that often hide or even distort what is going on. I will turn to TTC measurement indices and standards in a future article.
There will be a small number of changes on July 31 for the schedule period running through to the Labour Day weekend.
Line 2 Service Improvement
Service on Line 2 Bloor-Danforth will be improved during all operating periods, notably off-peak and weekends. This will not fully restore pre-pandemic levels on the route, but should reduce crowding that has become a problem over past weeks.
King & Sumach Track Repairs
The intersection of King and Sumach (the point where the Distillery line branches off) will be rebuilt in an attempt to reduce noise and vibration.
During this work, all 504 King service will operate to Broadview Station via Parliament and Queen Streets. The 503 Kingston Road route will also use this diversion.
A shuttle bus will operate to provide access to the Distllery, and it will also provide coverage for the 506 Carlton line during construction at Church Street (see below).
Church & Carlton Track Repairs
The intersection of Carlton and Church will be rebuilt as part of the regular maintenance program. This work will not include the addition of missing curves in the southeast quadrant.
506 Carlton service will divert around construction via Parliament, Dundas and Bay both ways. A replacement bus service will operate from Spadina Station to the Distillery District. The map below shows a proposed alignment for this service. This is subject to change depending on possible modifications to turn restrictions due to construction at College & Yonge.
Running times on 32 Eglinton West will be adjusted to provide for delays due to the Line 5 Crosstown Extension construction, as well as to restore covid-era service cuts.
A planned reconstruction of the terminal at Kipling Station will require consolidation of loading areas and move of some routes to stops outside of the station. This project has been deferred to 2023, but a schedule change to support this work was already in the pipeline for the coming period. The 40 Junction and 49 Bloor West routes will be interlined.
Route 172 Cherry Beach will shift from “Old” Cherry Street to the “New” street across the future path of the Don River between Commissioners Street and the Ship Channel. Buses will use Old Cherry Street north of Commissioners Street, then jog west to New Cherry Street to cross the new river course.
Route 174 Ontario Place weekend and holiday service was dropped in June due to conflicting activities at the CNE and Ontario Place grounds. This change is now officially in the schedules.
Details of the new service levels are in the spreadsheet linked below.
Reconstruction of Russell Carhouse will begin both to make it fully compatible with the Flexity fleet, to improve the quality of yard paving and convert the overhead system for pantograph operation.
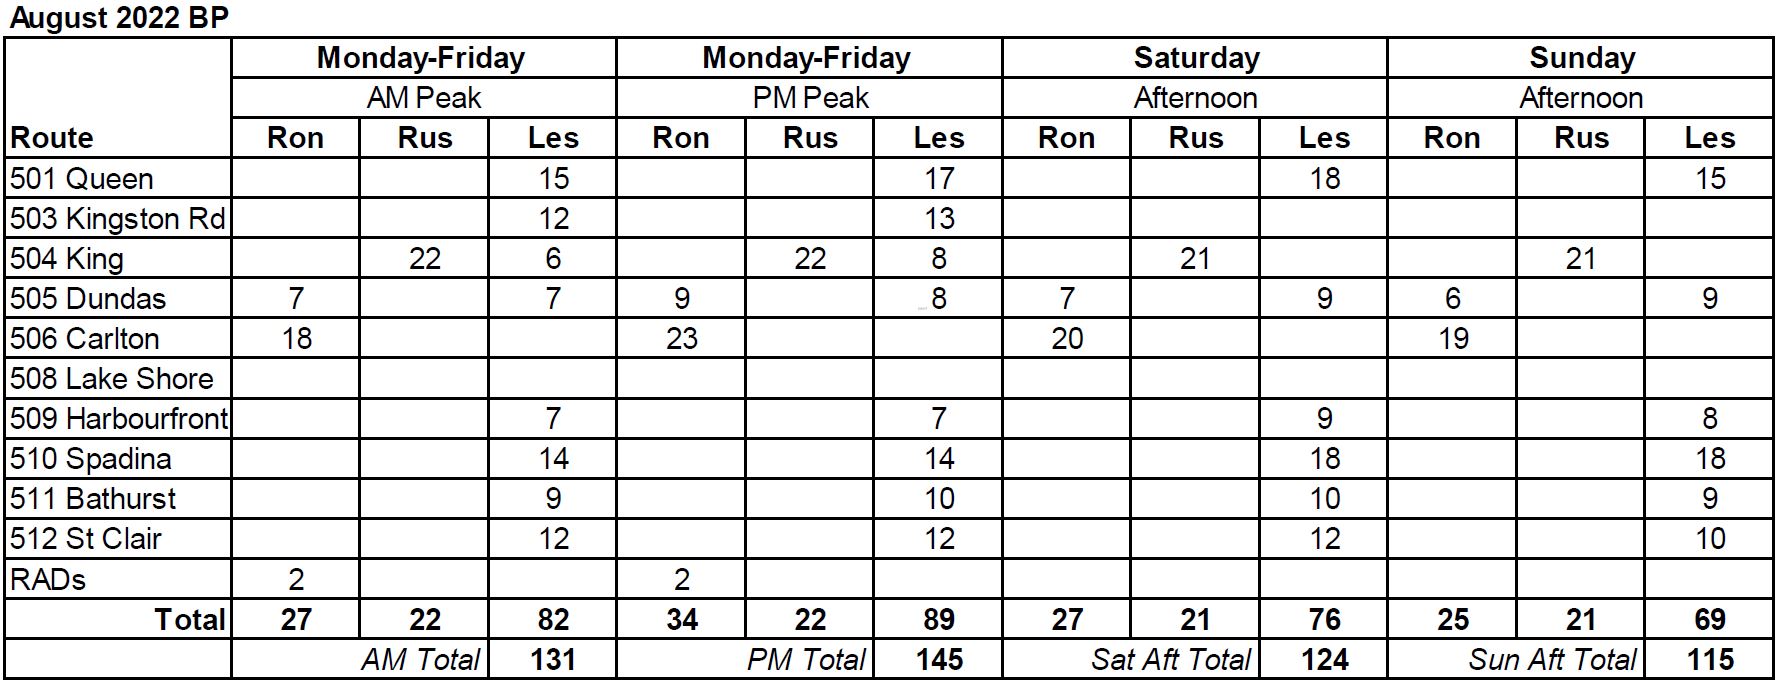
In the first phase of this work, the site’s capacity will be reduced to 28 cars including spares. Only the 504 King service will operate from the yard. Here is the new allocation of routes to the three carhouses.
Note that the maximum number of cars in service is well below the fleet of 204. Bus substitutions on portions of 501 Queen, 504 King and 506 Carlton will continue through the balance of 2022.
As the work at Russell progresses, the capacity of the site will change.
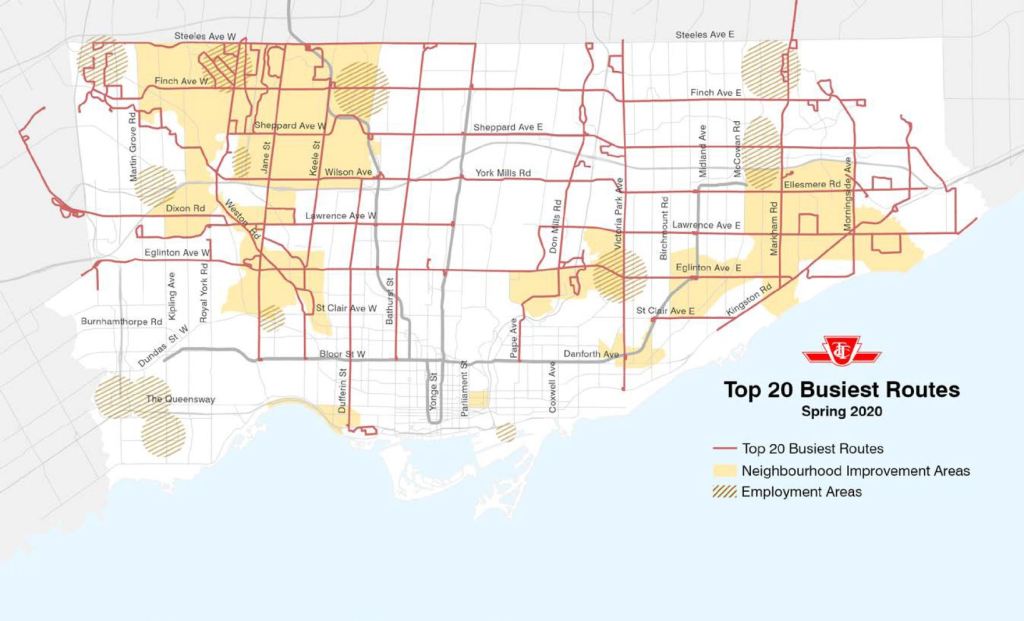
Of particular interest in the restoration of service to the transit network is the fact that recovery has been underway in some locations and times much more strongly than others. This corresponds to the difference in areas where work or study-from-home replaced commuting to an office or school. Maps in the previous article showed the top and bottom 20 routes for ridership relative to pre-pandemic levels in Spring 2020 (the point of lowest ridership) and in Fall 2021. For convenience, they are repeated here.
These ranking are by percentage of pre-pandemic ridership with no reference to absolute numbers. The busiest routes by ridership are shown in the maps below. This presentation inevitably displays the long routes which have a large number of boardings. Short routes like 65 Parliament may have recovered a large proportion of their demand, but the base number is necessarily small because of their smaller service territory.
This shows the danger of looking at absolute numbers out of a context such as riders per route kilometre (in effect, the density of demand), not to mention possible variations in the level of demand and boarding patterns along a long route.
Note: Calculations behind the charts in the original version of this article include a methodology problem. Short turn counts for vehicles crossing two screenlines (such as eastbound on Queen at Coxwell and at Woodbine) were distorted when these events did not occur in the same hour. Other problems included double counting of cars that looped twice at a short turn point (e.g. College Loop), and cars that were entering service via a loop being counted as short turns.
Changes in the text are shown by highlighting of the new version. All charts have been replaced.
My apologies for any confusion, but the charts used here avoid the potential confusion of values shown originally.
One of the many annoyances of trying to use transit service is to discover that your bus or streetcar has been “short turned”, that is to say, will not reach the destination advertised. This might happen before you board so that an arrival prediction turns out to be for a streetcar you can’t use, or as a “surprise” when the operator gets on the PA to announce that Transit Control wants to short turn the car.
This has been a problem for as long as I have been involved in advocacy for better transit service.
TTC Board members and Councillors hear about this problem a lot, and they in turn beat on management to eliminate the practice. This can produce unwanted side effects, notably the padding of schedules so that it is almost impossible, at least in theory, for a car to be late and, therefore, short turns should not be required.
Alas it is not quite that simple. Short turns occur for various reasons including schedule issues, crew change timing, major delays/diversions and “operational problems”, that catch-all phrase covering everything from a stuck door to a plague of locusts. (Some explanations for transit service problems have been with us so long they have taken on an almost Biblical character.)
Meanwhile, the CEO’s Report happily tells us every month that short turns are a thing of the past, that they are so rare that it might not even be worth tracking them as a service metric.
Source: June 2022 CEO’s Report
The big drop in the metric in spring 2019 coincides with a point where a “no short turn” edict was issued by the CEO. This is not really practical as there are many bona fide reasons for short turning vehicles, but the numbers obediently went down and have stayed down.
Regular riders, however, might choose to differ in their day-to-day observations.
Since 2019, we have come through the pandemic era when a great deal of traffic congestion and ridership disappeared. For a time, the type of event that would disrupt service was comparatively rare. However, with “normal” conditions returning, service is no longer insulated by these effects.
In my own travels, I routinely encounter streetcars that are not going to their scheduled destinations. Let me be the first to say that I understand the need for short turns, but am rather amazed that the reported counts stay very close to zero. This simply does not match actual experience. A short turn is a short turn, regardless of why it is required.
The question, then, is how to count these events reasonably easily without standing on street corners clipboard in hand. Vehicle tracking data that I already receive from the TTC’s Vision system (and which drives the many arrival prediction apps) provides a simple mechanism.
In this article I will review several common streetcar short turn locations to see what is actually happening.
If readers have specific bus routes and locations they would like to see, please leave your request in the comments.
Note: The charts in this article include a methodology problem. Short turn counts for vehicles crossing two screenlines (such as eastbound on Queen at Coxwell and at Woodbine) are distorted when these events do not occur in the same hour. This article has been replaced with a revised version, but I am leaving the original here for reference.







 Steve Munro