
This article arose from complaints I saw on Twitter about the poor service on the 63 Ossington bus during November and early December. The common thread is that service is extremely erratic, a common problem on many routes.
In the case of the Ossington bus, most trips are comparatively short because it extends only from Eglinton West Station to Liberty Village, and many trips are to or from the subway at Bloor. This means that wait times can form a substantial part of a journey on the route, sometimes more than half. Moreover, they are unpredictable and riders must allow time for this whether they will need it or not. This is not a formula for attracting demand back to the system from those who have a choice of travel some other way.
The charts here are in a format familiar to readers of this site. To save repeating explanatory material, I urge those who are new to this type of analysis to read Understanding TTC Service Analysis Charts: A Primer. For details of how these charts are created, see Methodology For Analysis of TTC’s Vehicle Tracking Data.
Service on 63 Ossington during November 2022 operated with schedules that had been in place for some time. The weekday schedules had been in effect since March 2022, and the weekend schedules since November 2021.
During peak periods, half of the service short turns at St. Clair via Oakwood Loop, but at all other times, all buses run over the entire route.
During November 2022, there was an enlarged south end loop to avoid construction at King & Shaw, but no additional running time was provided in the schedule to compensate for this.
The route has frequent opportunities to regulate headways with layovers at the terminals and at Ossington Station Loop. Note that recovery times are particularly large during weekday peak periods and midday. This is intended to deal with congestion due to Line 5 Crosstown construction at Eglinton West Station. Recovery times are more commonly only one headway or less.

Headways Southbound from Ossington Station
In the charts below, the headways (interval between buses) are measured at a screenline just south of Bloor Street.
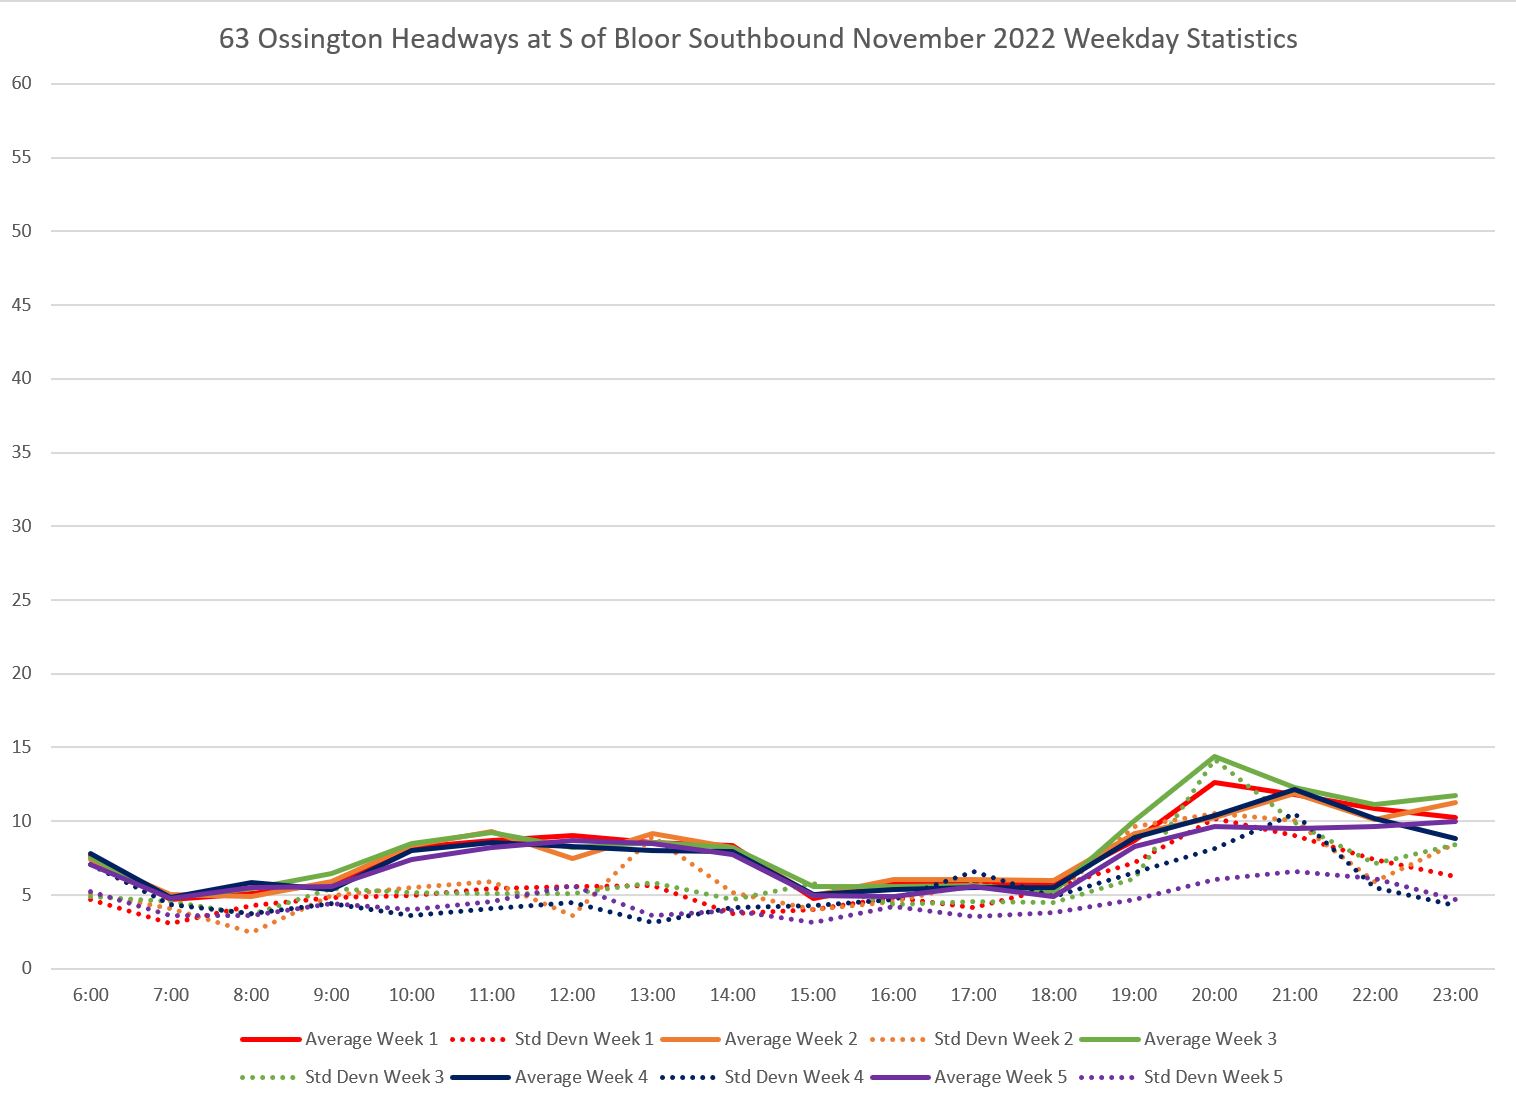
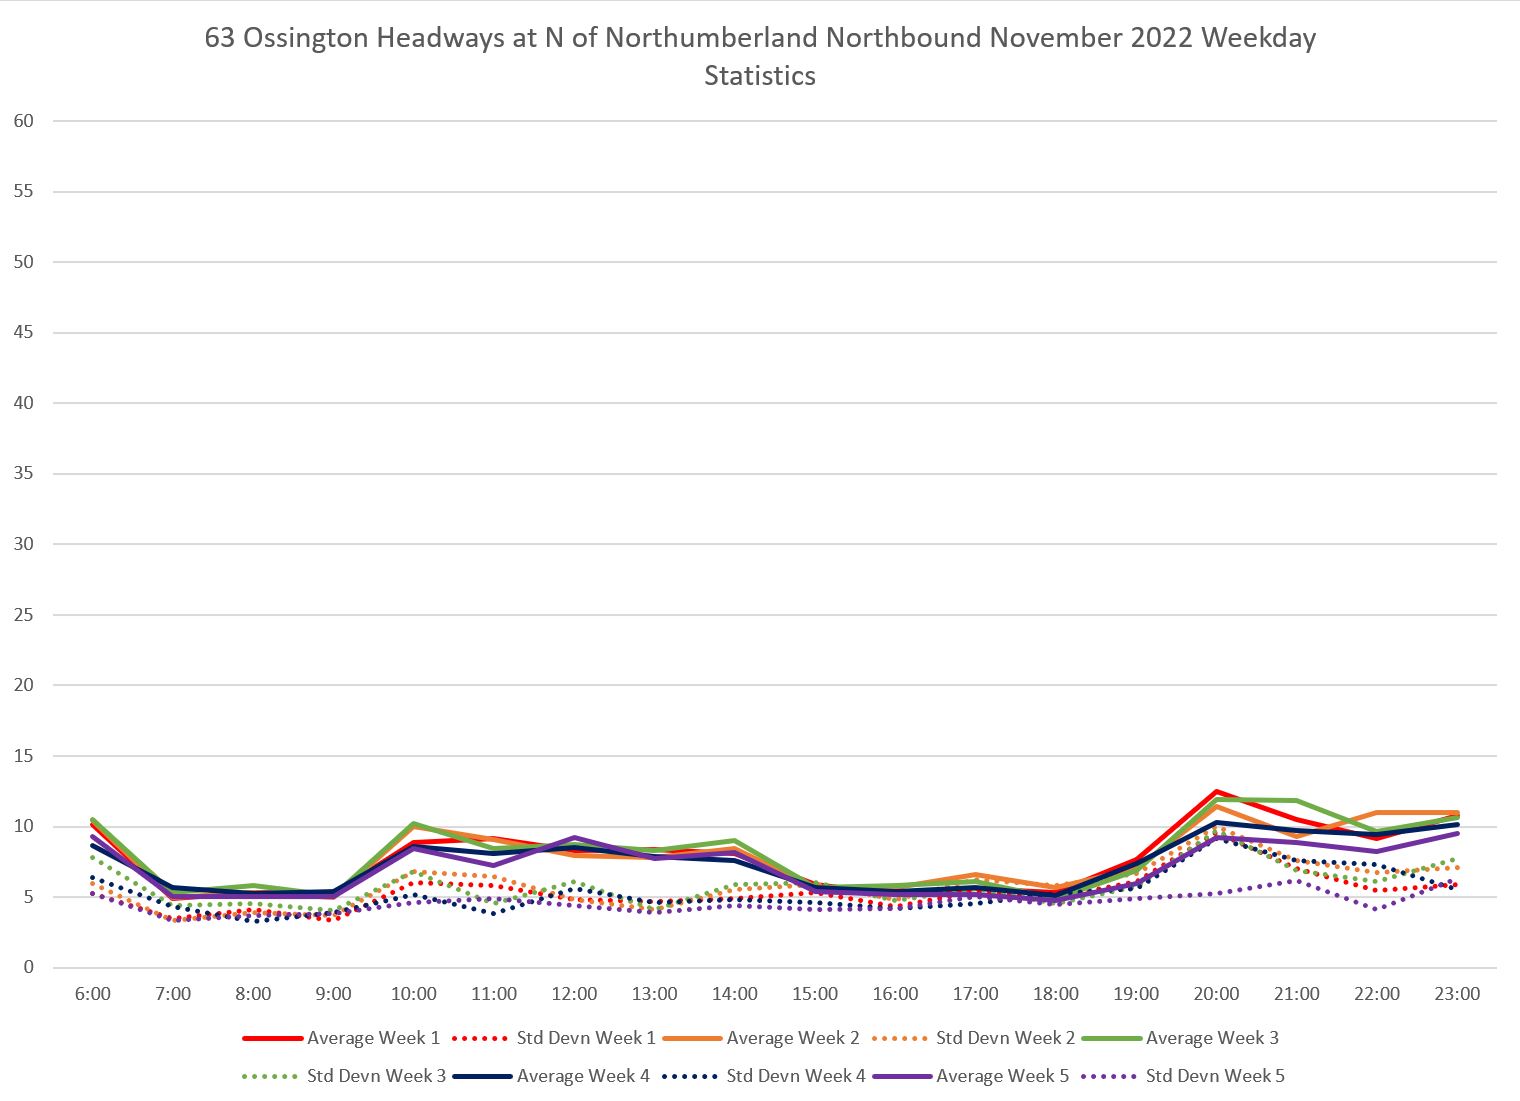
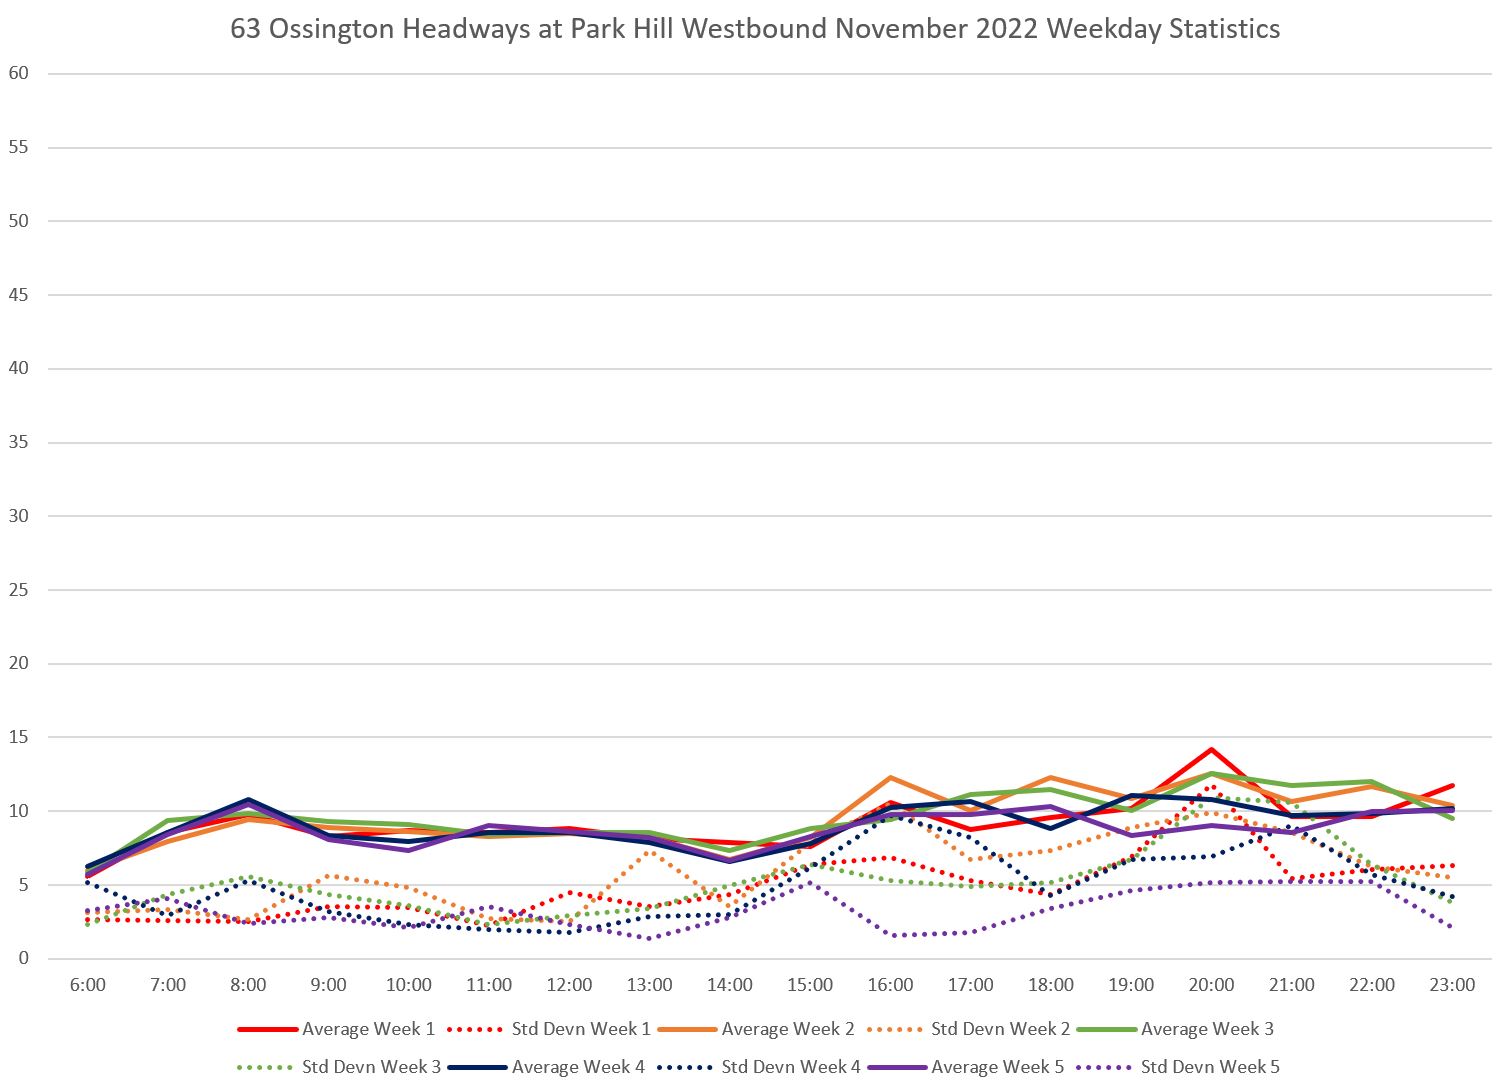
Average Weekday Headway
This chart shows the average headway by hour for each week through the month (solid lines) and the standard deviation of these values (dotted lines).
The SD is a measure of how scattered the values are. Note that it is usually at four minutes or above and lies close to the average. Because the lion’s share of data points will lie within +- one SD of the average, this means that headways typically lie in a span of at least 8 minutes, sometimes more. This also indicates that many buses run in pairs.
The average values are generally close to the scheduled ones, and this indicates that all of the scheduled buses operated, even if they were not regularly spaced. Evenings show some cases where the average is higher than scheduled implying that buses were missing.
The scale is set high at 60 minutes because, as we will see later, some of the actual headways were very long.
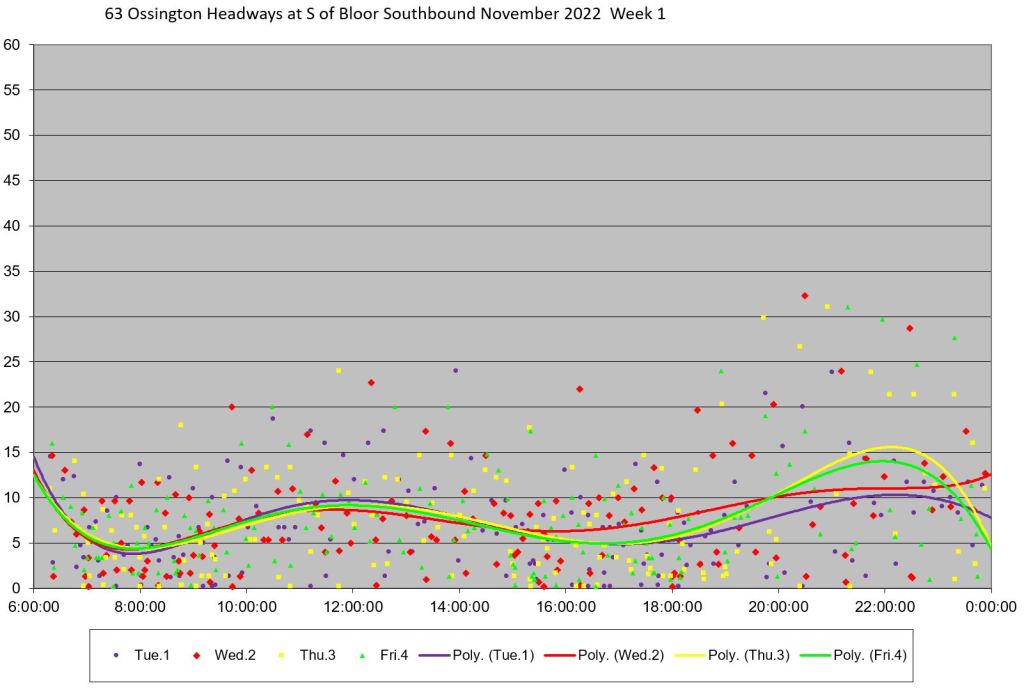
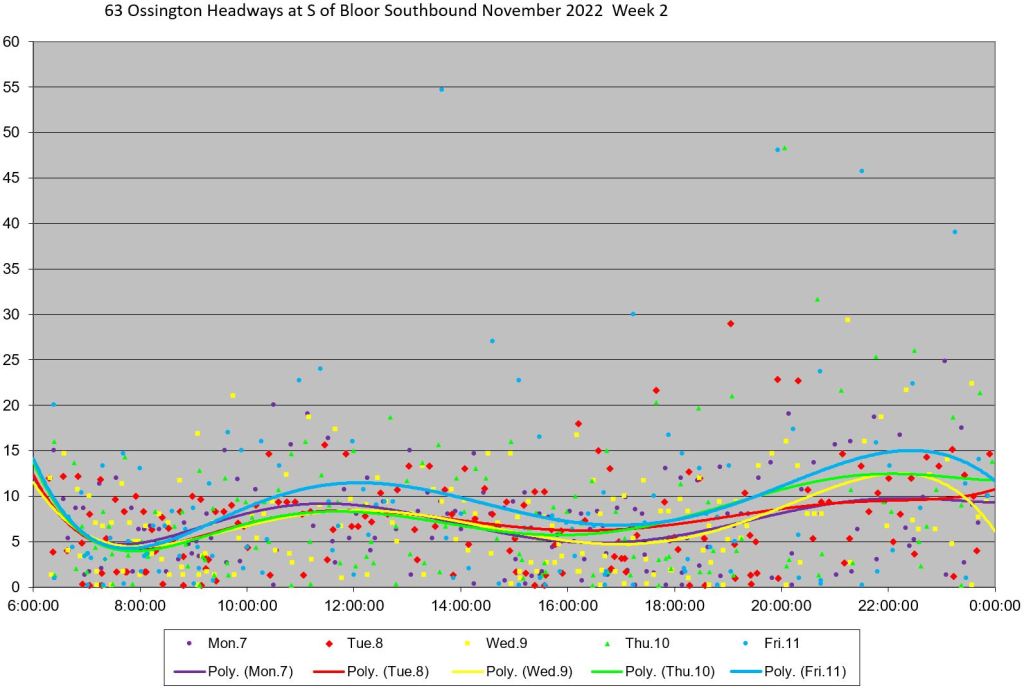
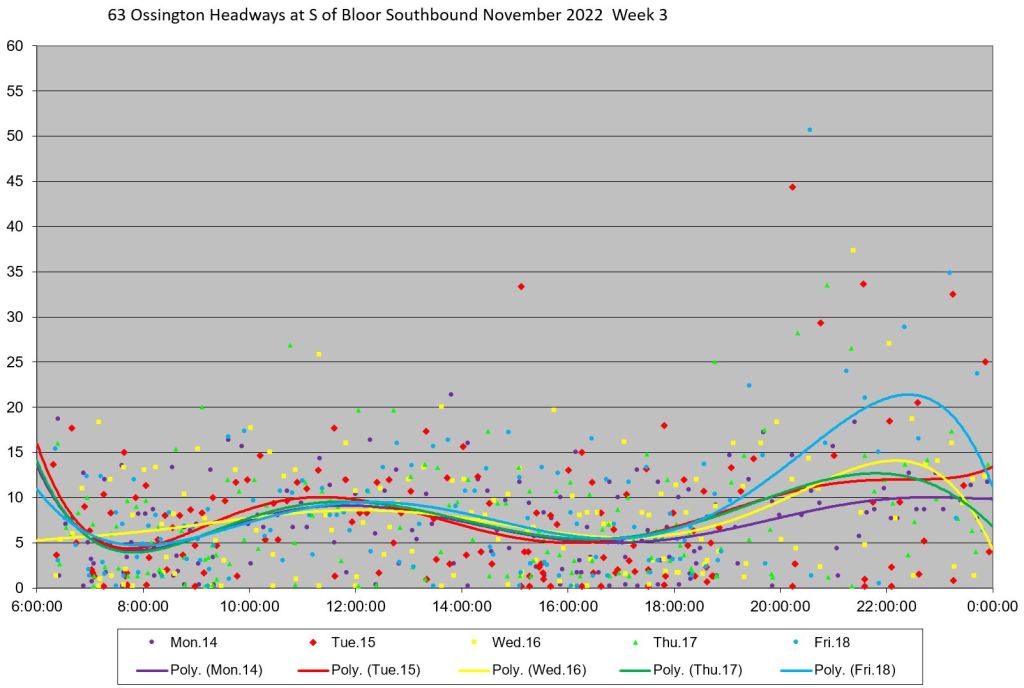
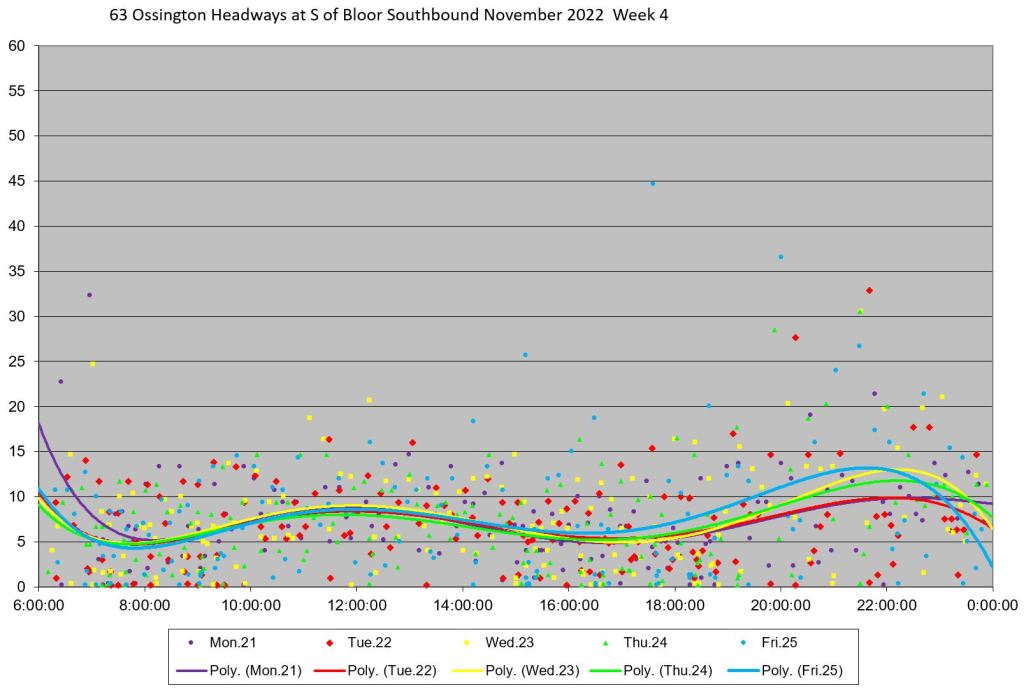
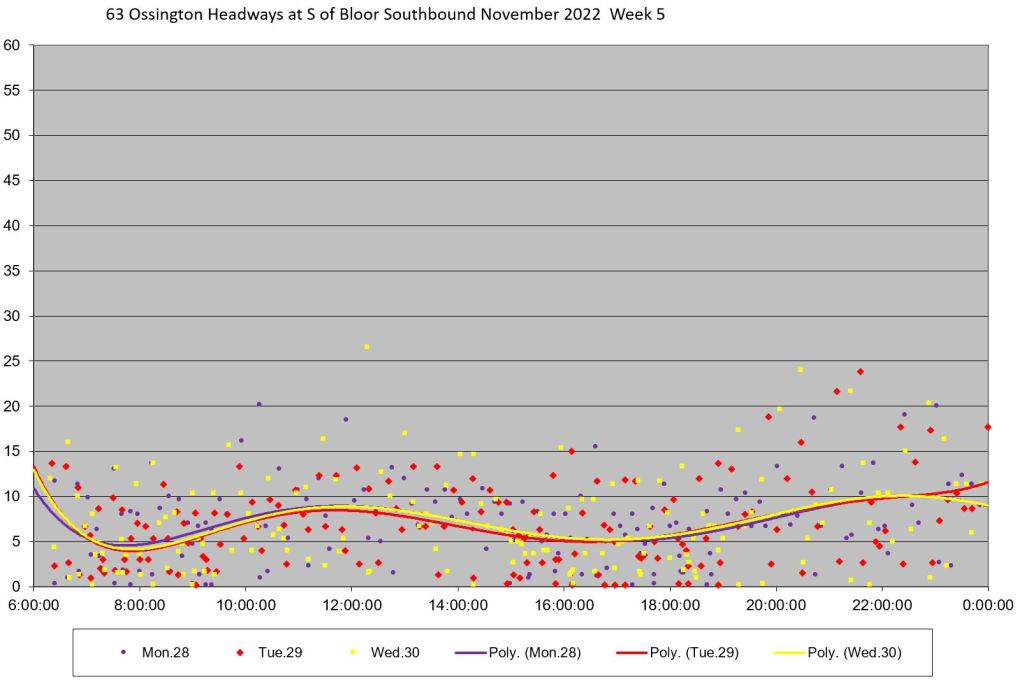
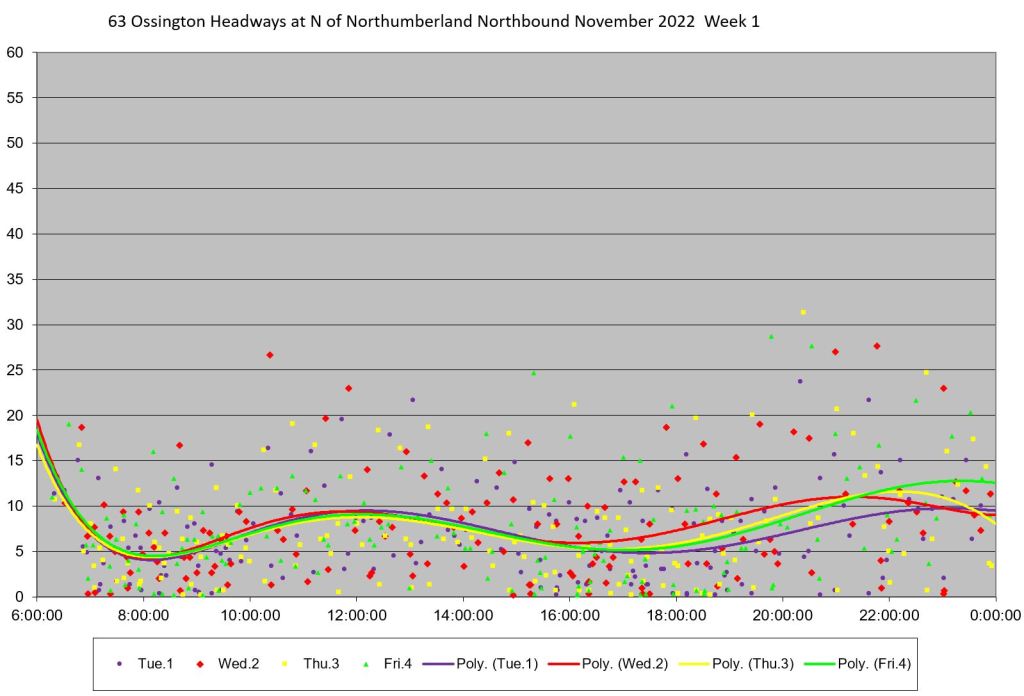
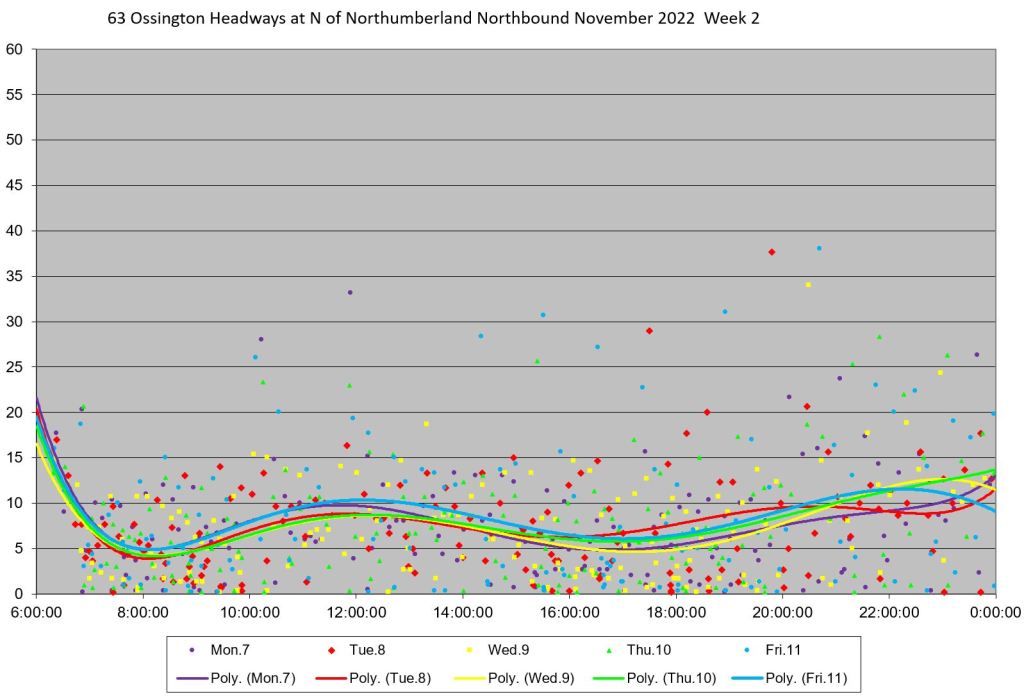
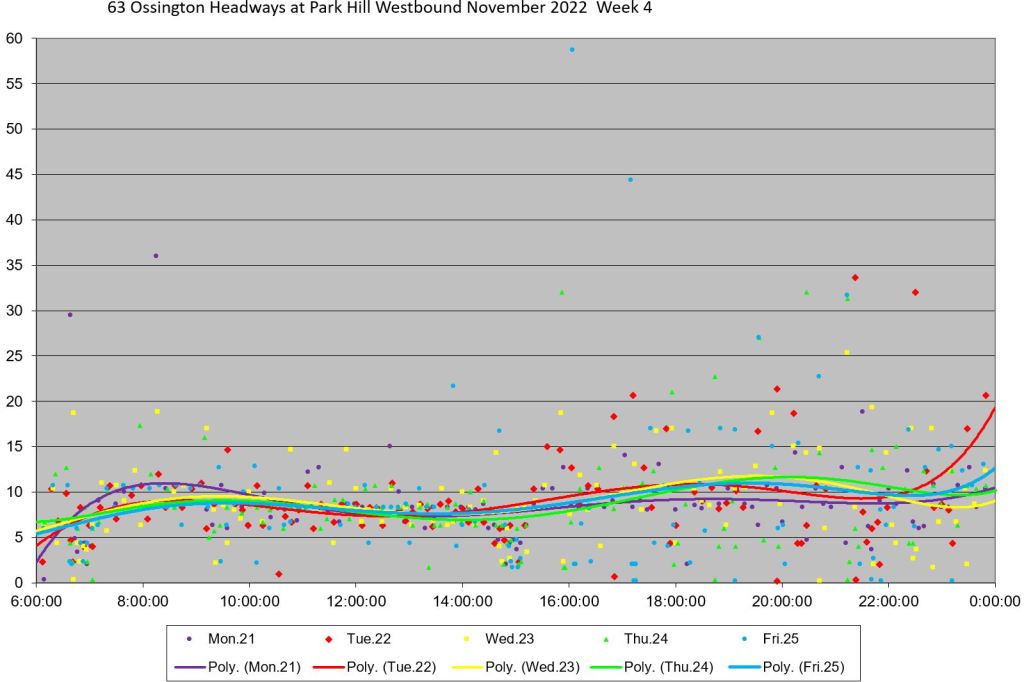
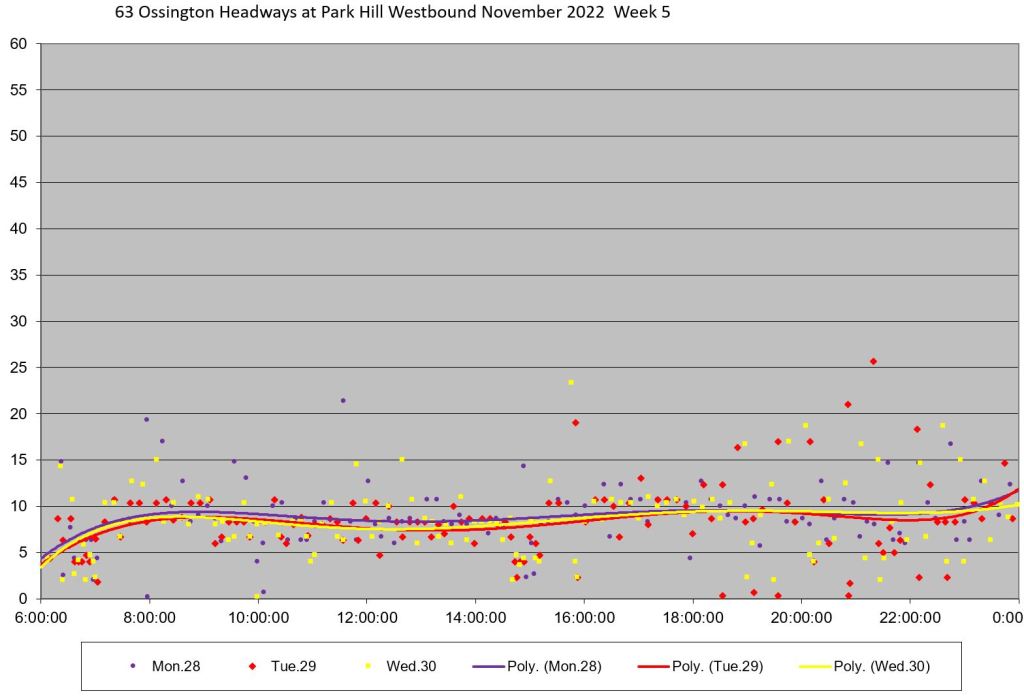
Weekday Details
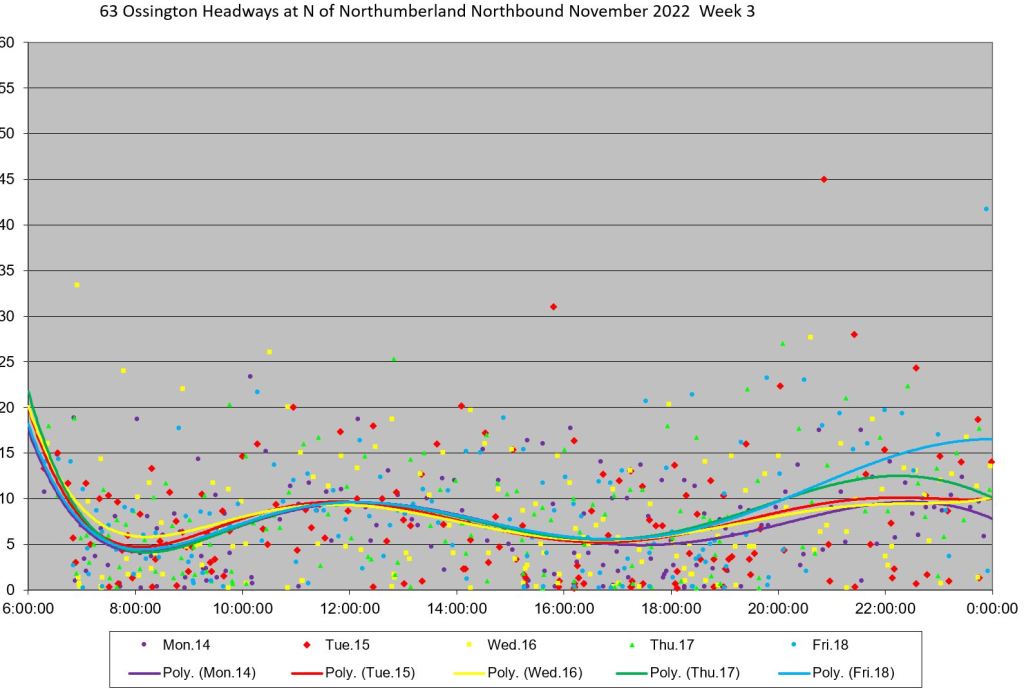
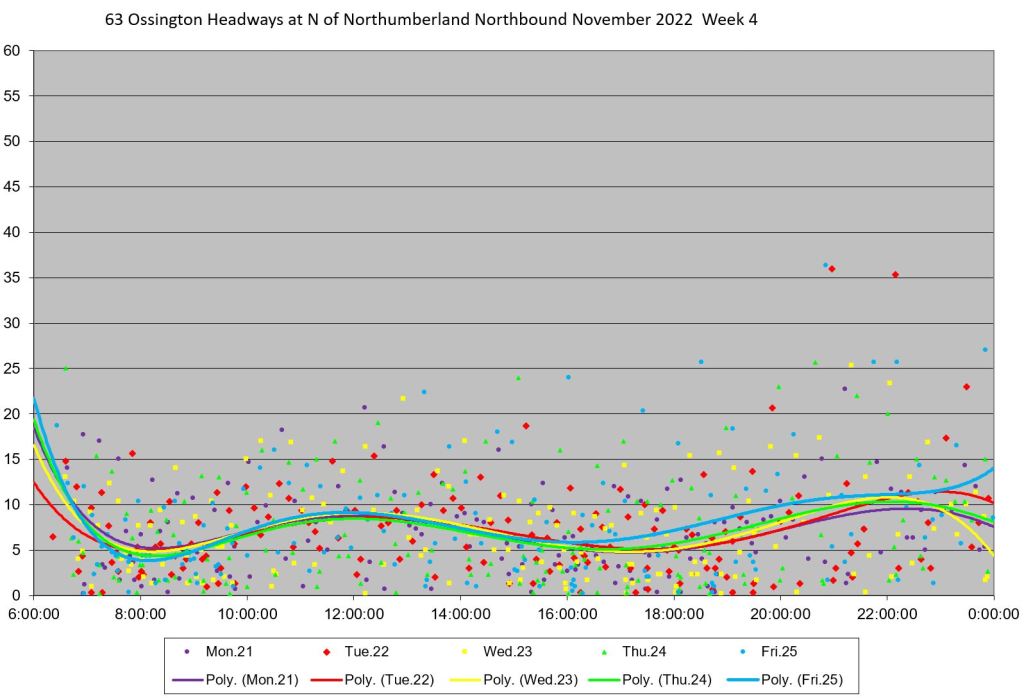
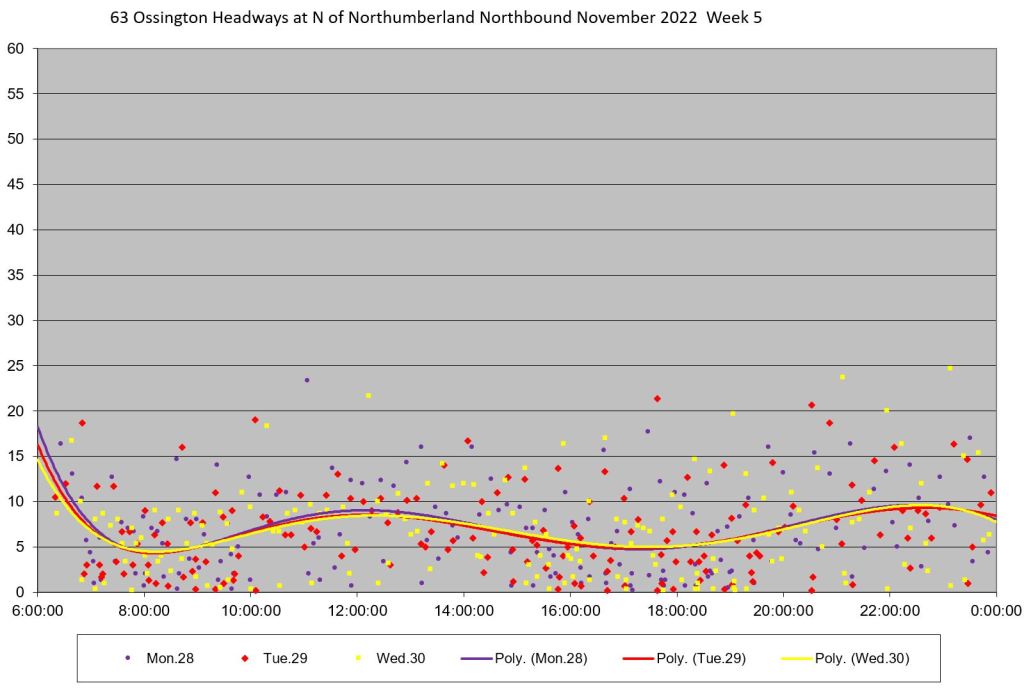
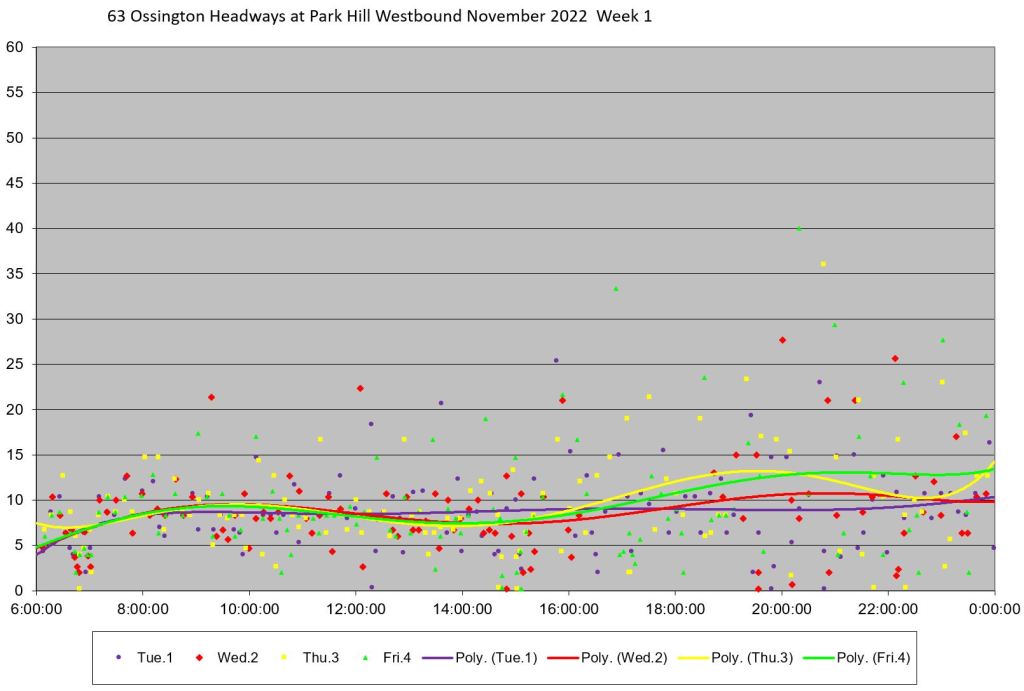
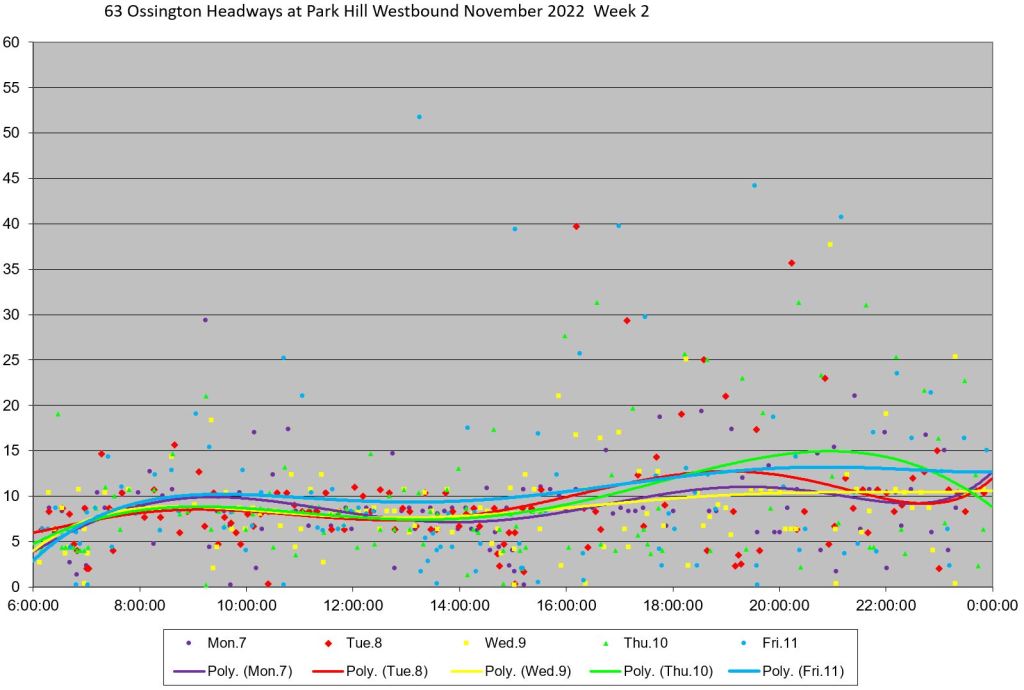
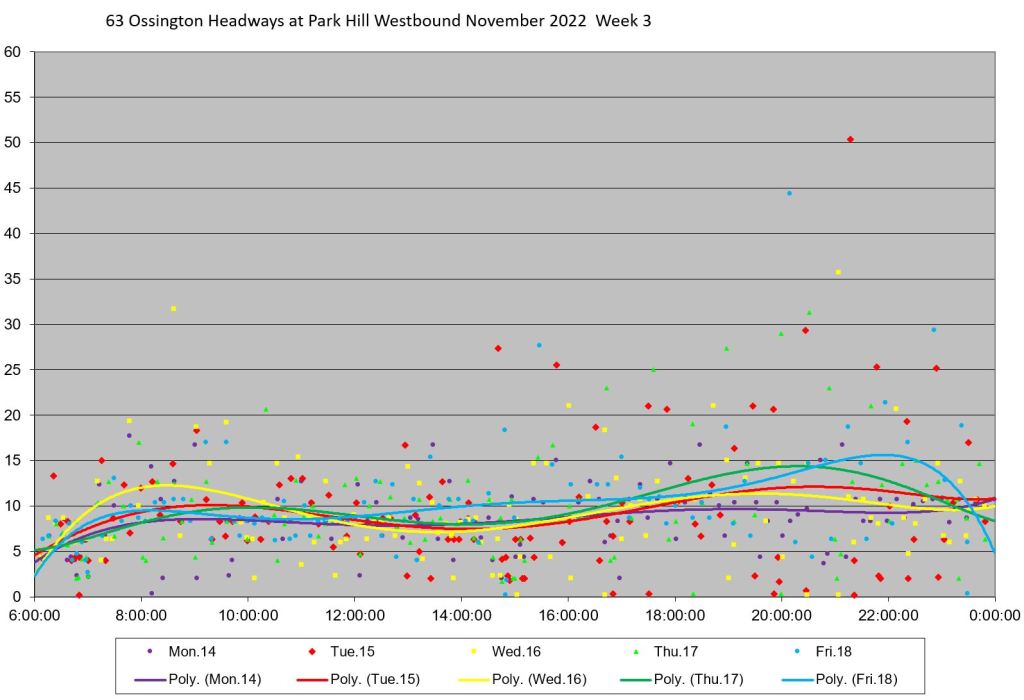
The individual weeks break down as shown in the charts below. Each dot represents one bus colour-coded by the day of the week. Many values, all day long, are near the x-axis, that is, they are almost zero, indicating one bus travelling very close behind another. There are corresponding dots at higher values for the large gap that the pair of buses creates.
Some of the headways, especially in the evenings, are well above the average/scheduled values. The highest value is 55 minutes at midday on November 11. Later in the article, I will review selected days in detail to examine how the route behaved and was managed.
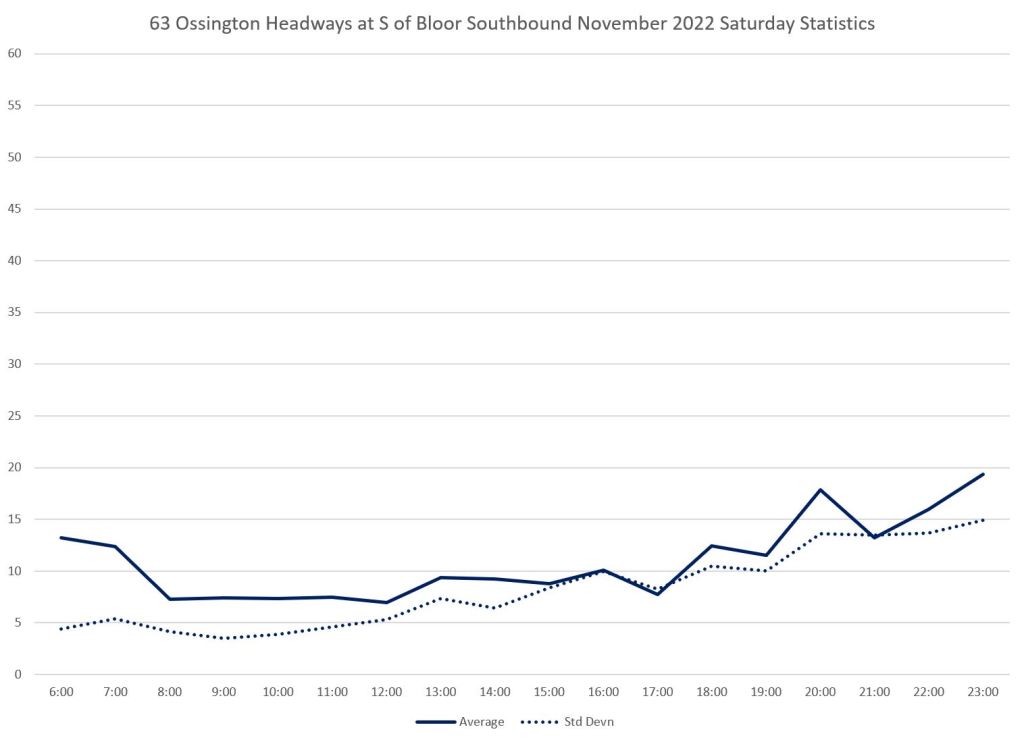
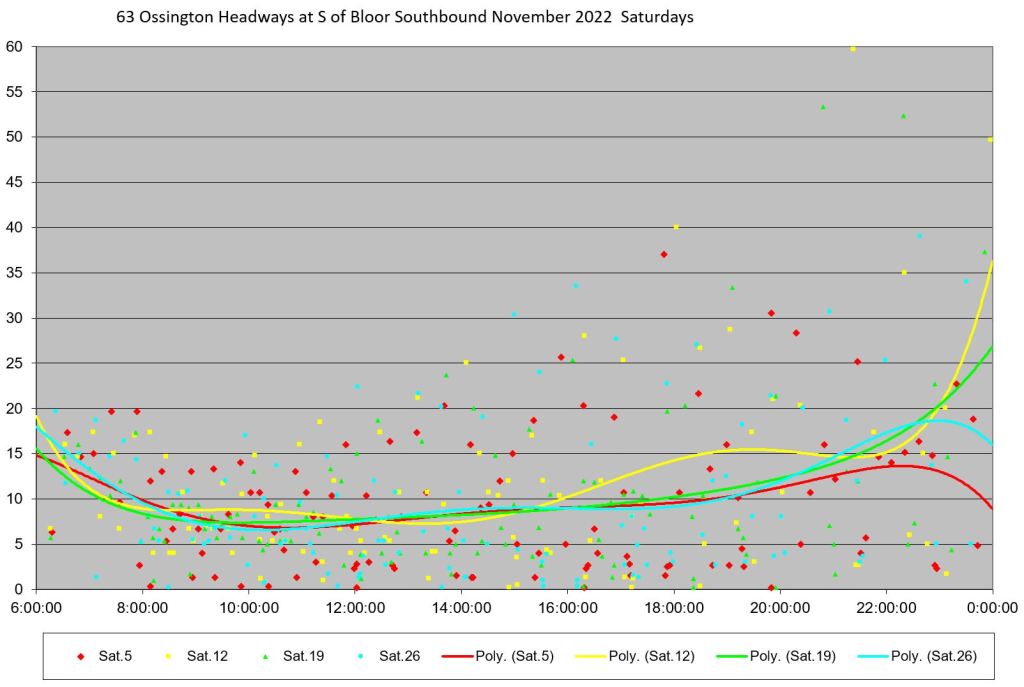
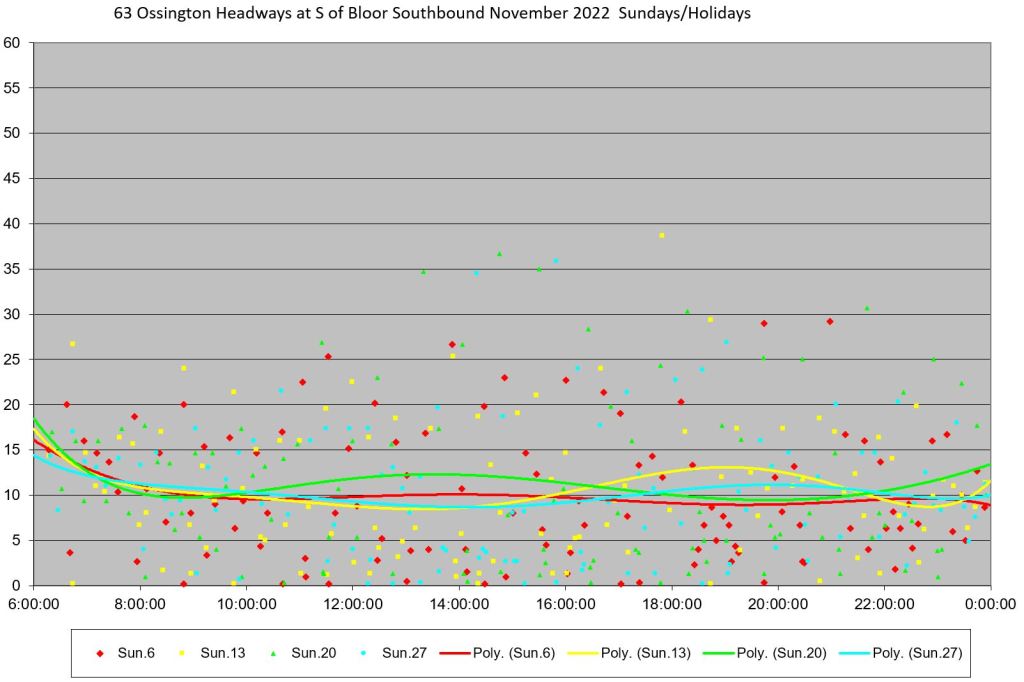
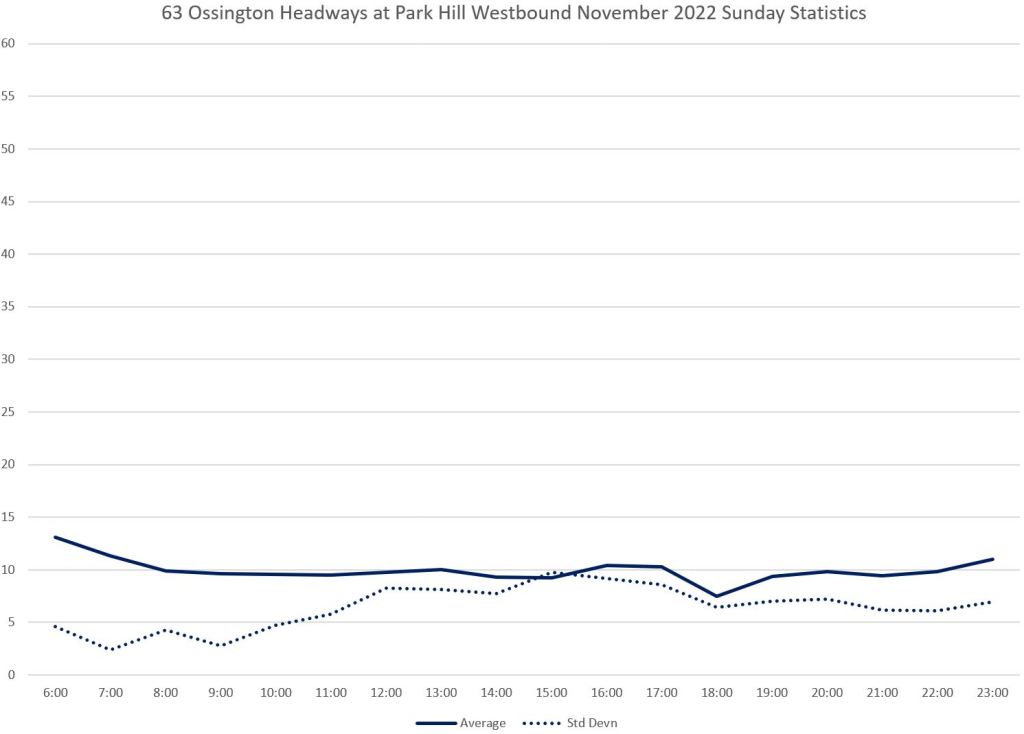
Weekends
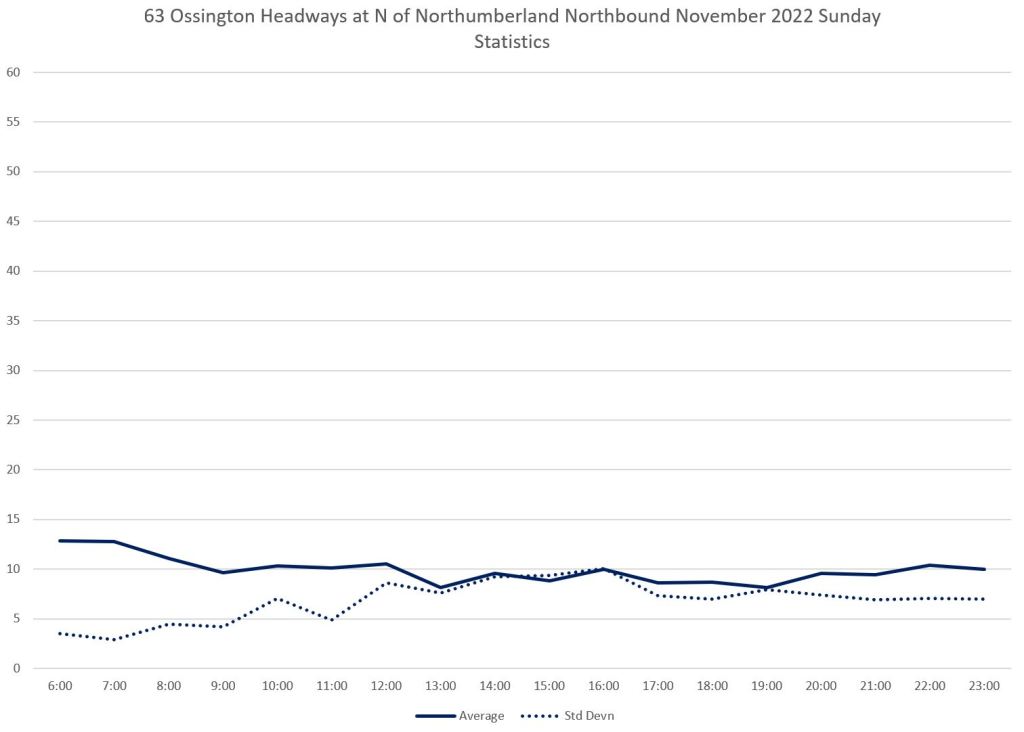
Weekends also have erratic service. Here are the statistics (averages and SD values) and the details for Saturdays and Sundays. In both cases note the high value of the SD which tracks the average headway particularly on Saturdays. Much of the service is running as pairs of buses or worse. Also, the average headway on Saturday evenings is higher than the scheduled one indicating that buses were missing.
As with the weekday service, there are many data points close to the x-axis and corresponding points at values well above the scheduled level of service.
When buses run in pairs, the average headway might be close to the scheduled value, but what most riders experience is the long wait before a pair of buses appears. The average headway from a rider’s viewpoint is much worse than what is advertised.

Headways Northbound From Ossington Station
This section presents the same set of charts as above, but for northbound service from Ossington Station. The screenline is just north of Northumberland, the north side of the loop at the station.
Weekdays
Weekday details
Weekends


Headways Leaving Eglinton West Station
The TTC only considers headways leaving terminals as a metric to be reported, and until recently grouped this information for all routes across all operating periods. These are the locations where, in theory, service should be at its best, although the TTC service standards allow a bus to be “on time” when it is no more than one minute early or as much as five minutes late.
On a route where the scheduled frequency is often below ten minutes, this allows buses to run in pairs and still be considered to be “on time”.
The screenline for these measurements is at Park Hill Road, one block west of Eglinton West Station.
Weekdays
Service leaving Eglinton West Station looks fairly reasonable if one only considers the averages which lie roughly at the scheduled values. However, the high SD values, particularly from mid-afternoon onward, show that the service is quite erratic.
Weekday Details
The detailed charts show the range of actual headways with many cases at 20 minutes or much worse from mid-afternoon through the evening.
Weekends
Weekend service from Eglinton West Station shows the common problem of high SD values (dotted lines) indicating that there is a fair scatter in the headway values. This mirrors the detailed data plotted on the right below.


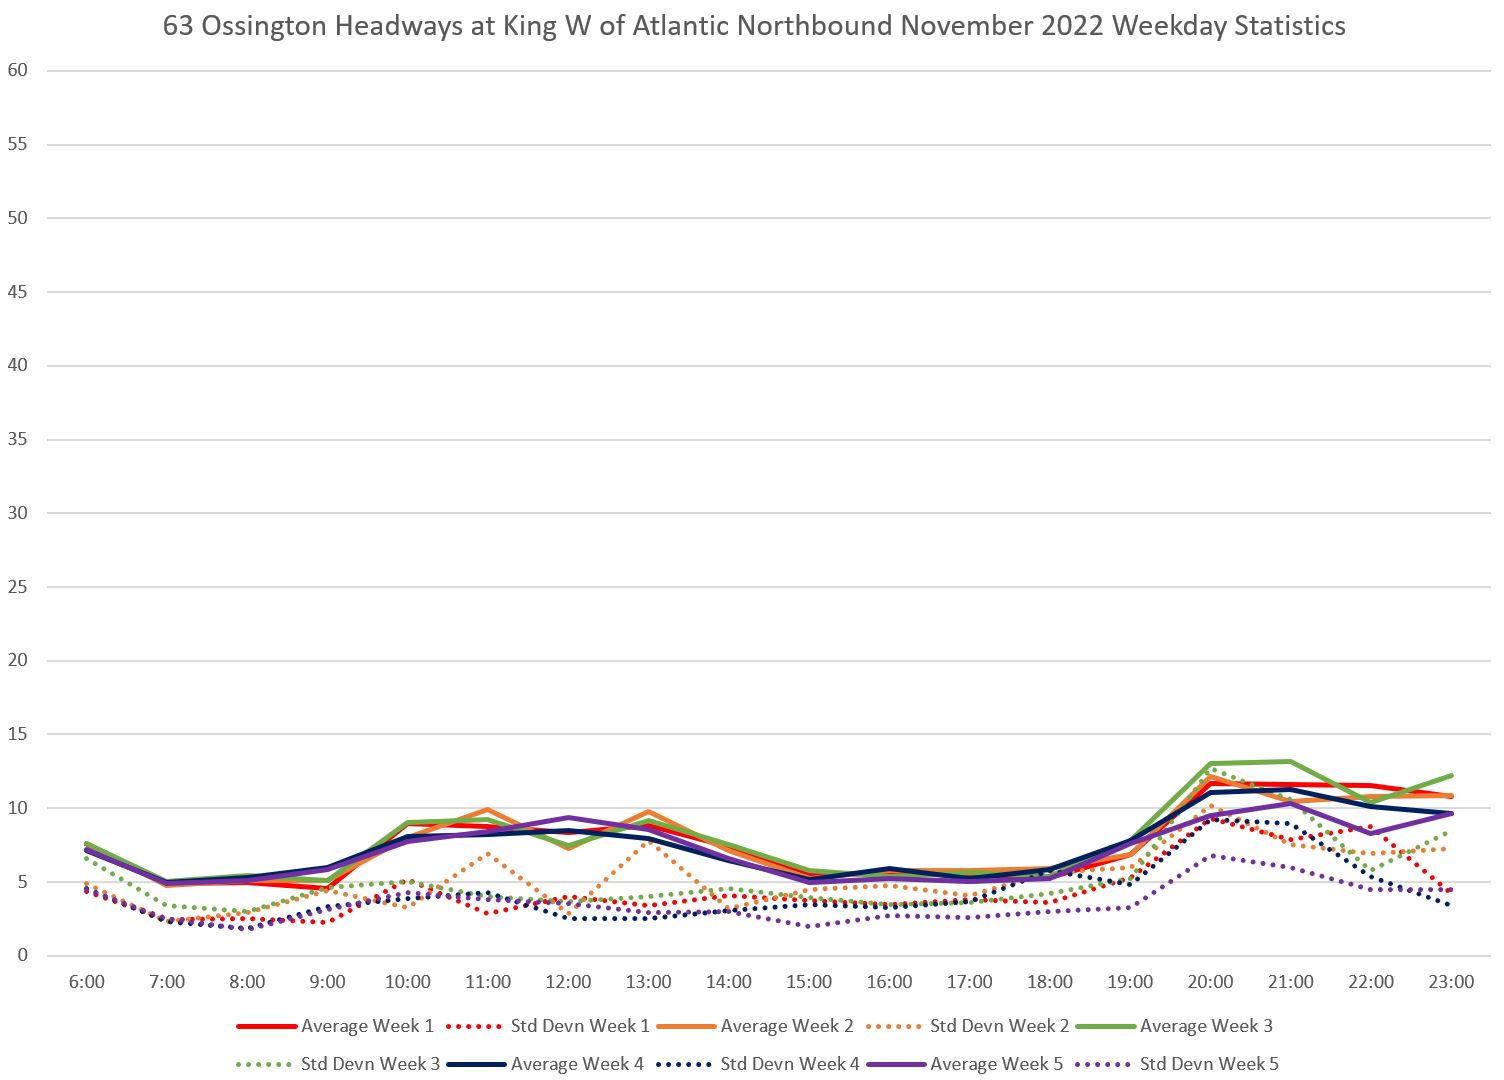
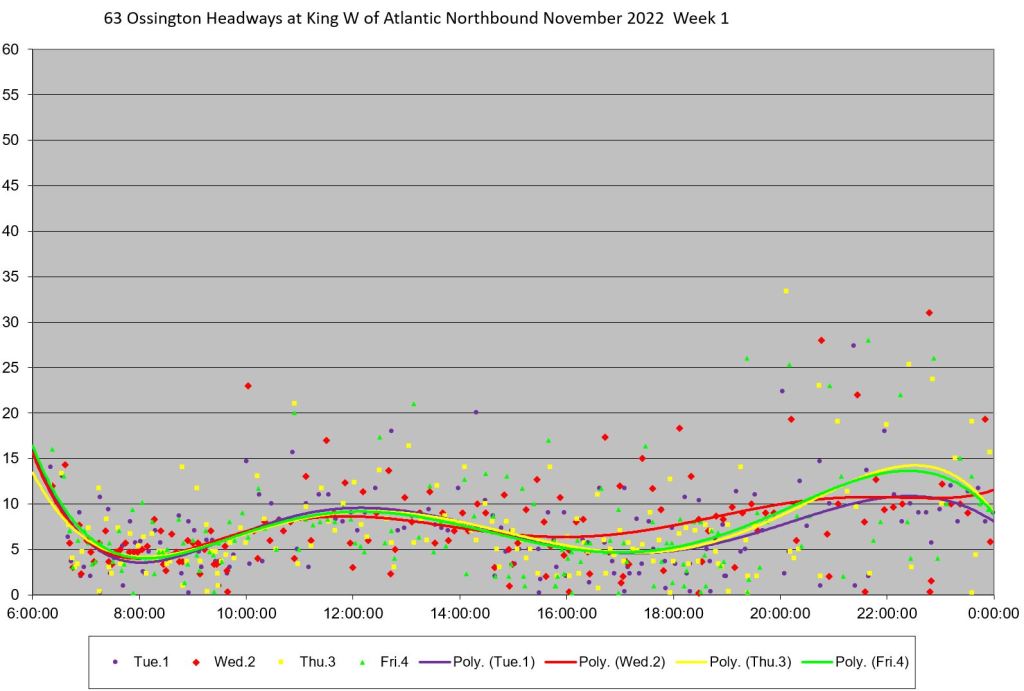
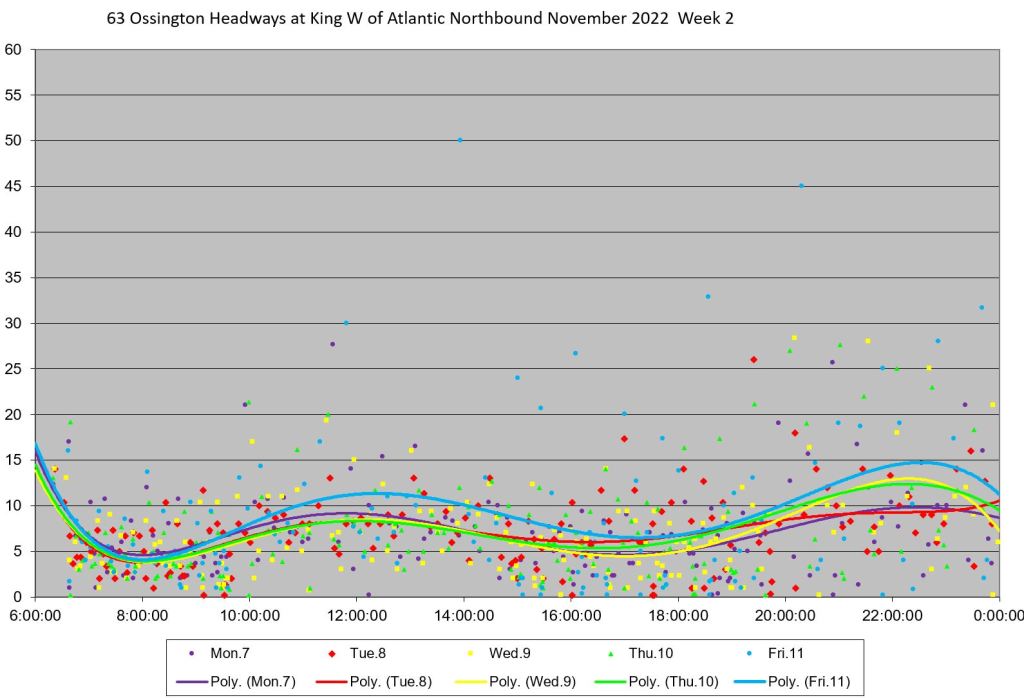
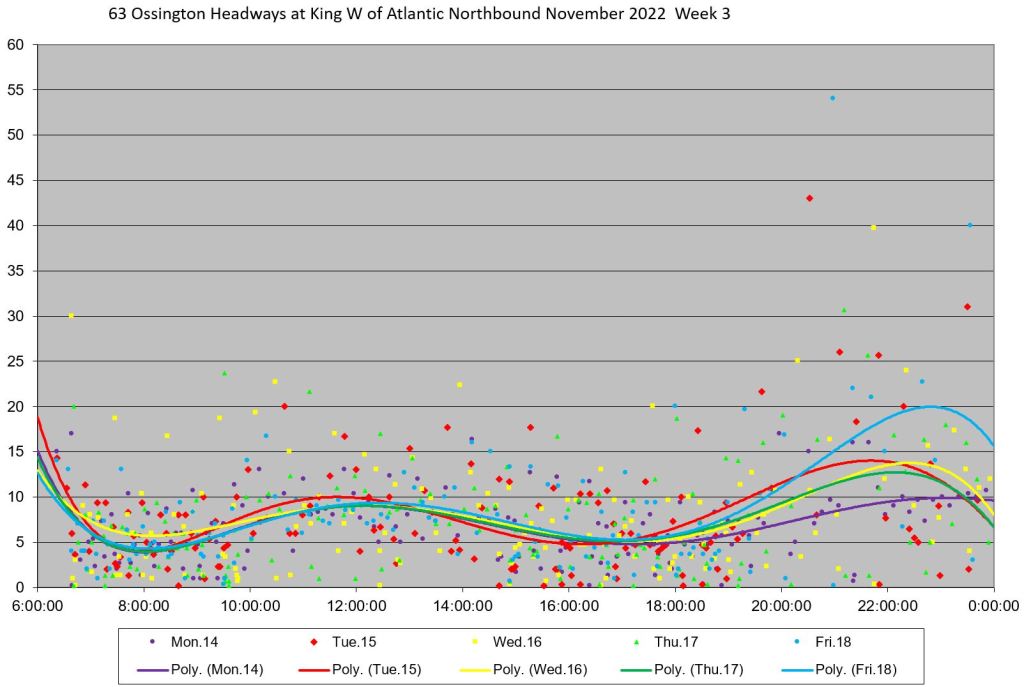
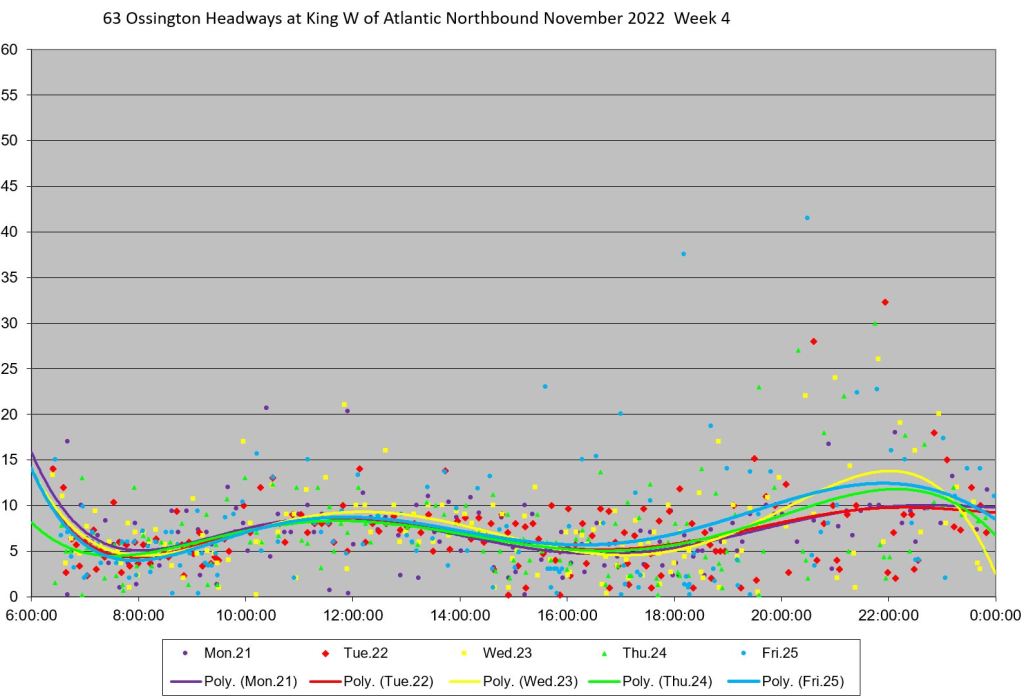
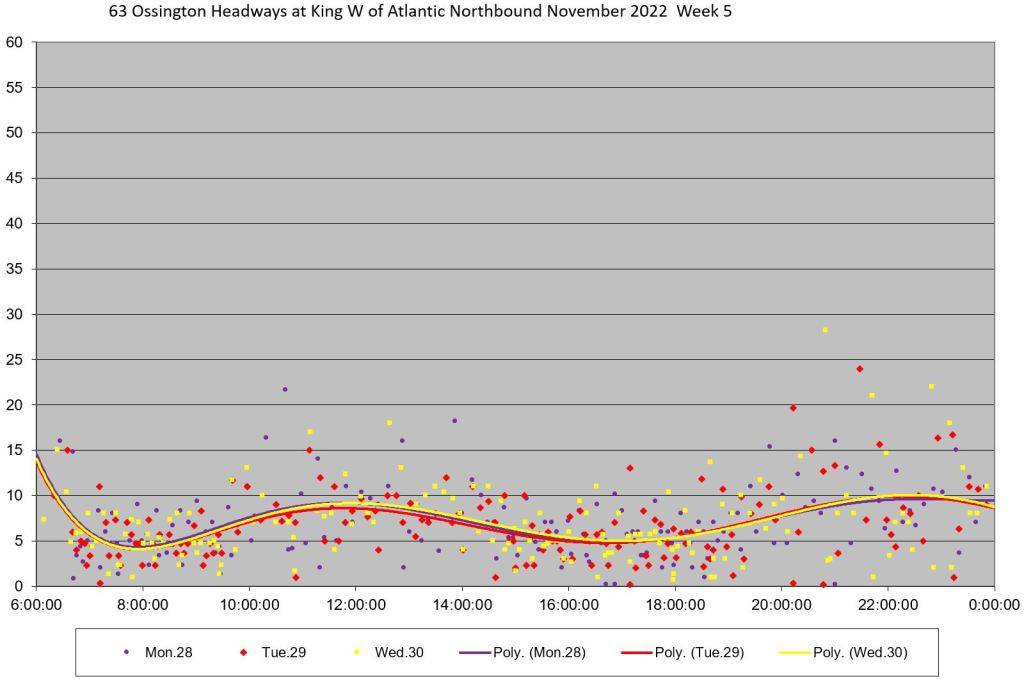
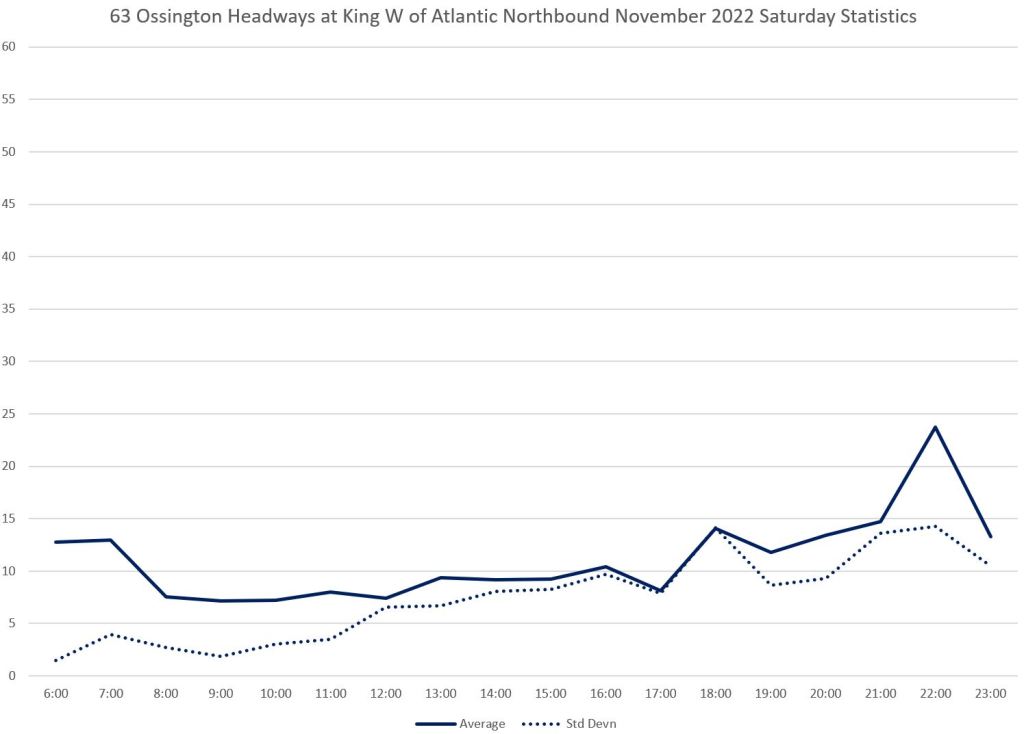
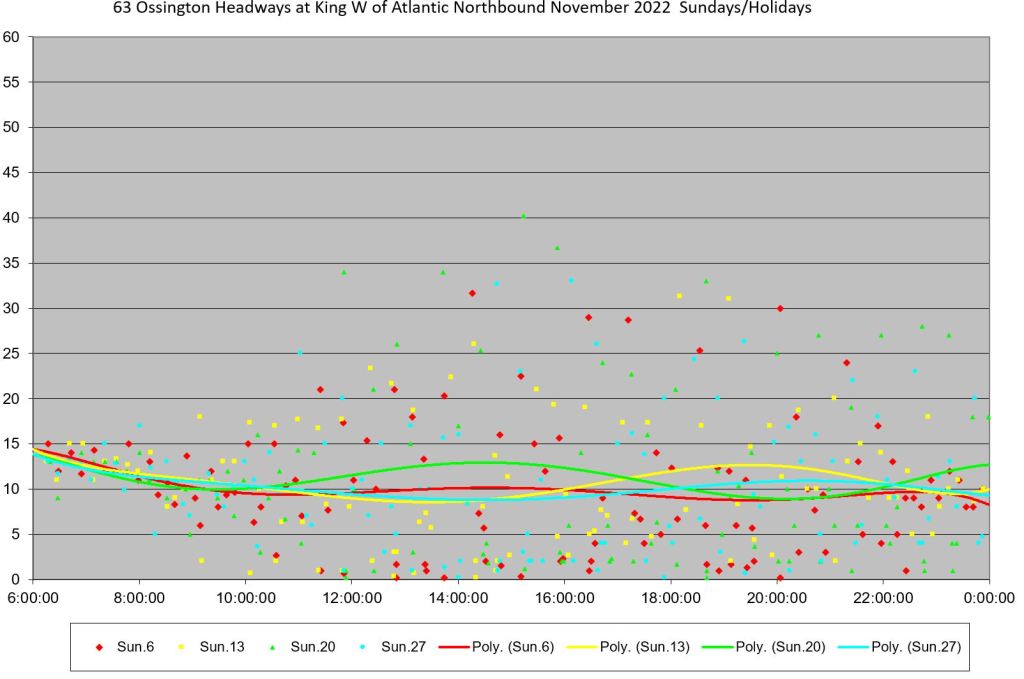
Headways Leaving King Street Northbound
The typical layover location for Ossington buses at the south end of the route is on Atlantic Avenue just south of King Street. Measurement of northbound headways uses a screen line on King just west of Atlantic.
Weekdays
As at Eglinton West, the SD values are fairly close to the averages, and this is a sign of bunching. The SDs are particularly high in the evening, and this corresponds to the bunching and gapping visible in the detailed charts in the next section.
This is service leaving the terminal, and that is usually as good as it gets because vehicles running in a gap get progressively later along the route, and following buses catch up making the bunching even more of a problem.
Weekday Details
The detailed charts show the scatter of headway values at King with values close to zero common showing that buses leave the terminus close together during most times of the day.
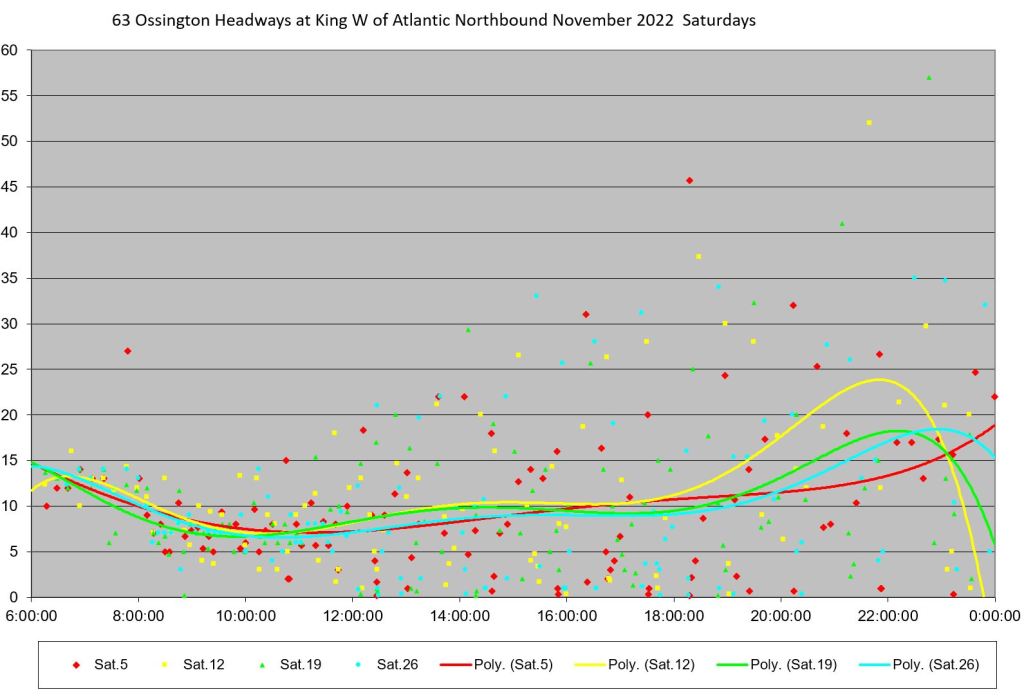
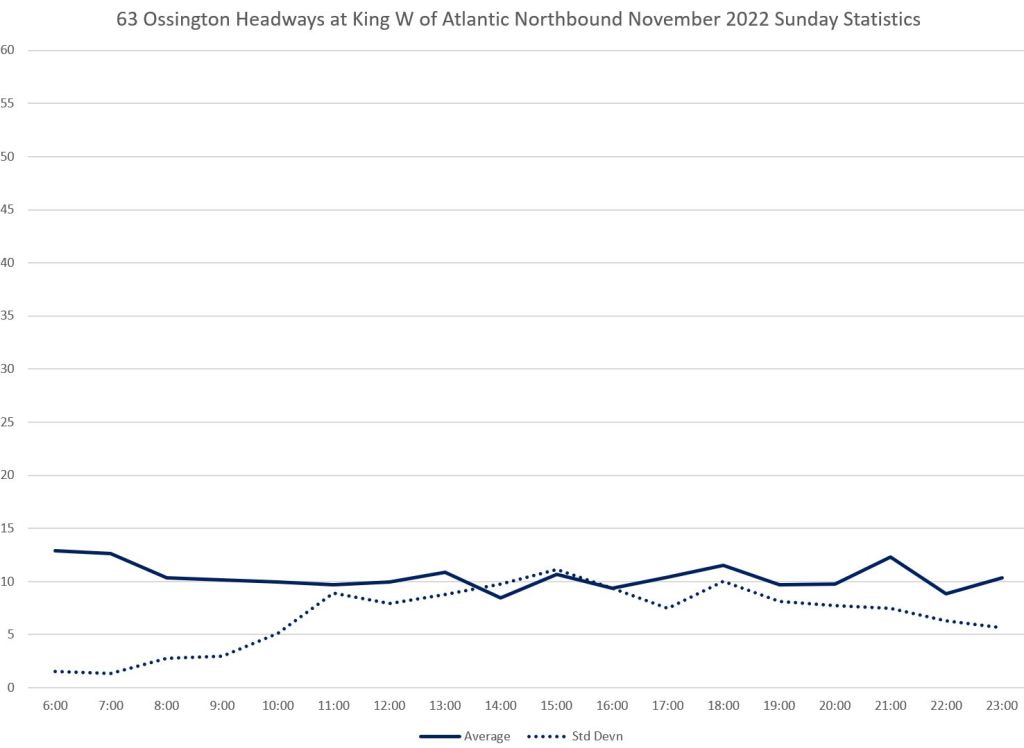
Weekends
Weekend service from King Street mirrors other locations on the route with a great deal of bunching and some very wide headways.
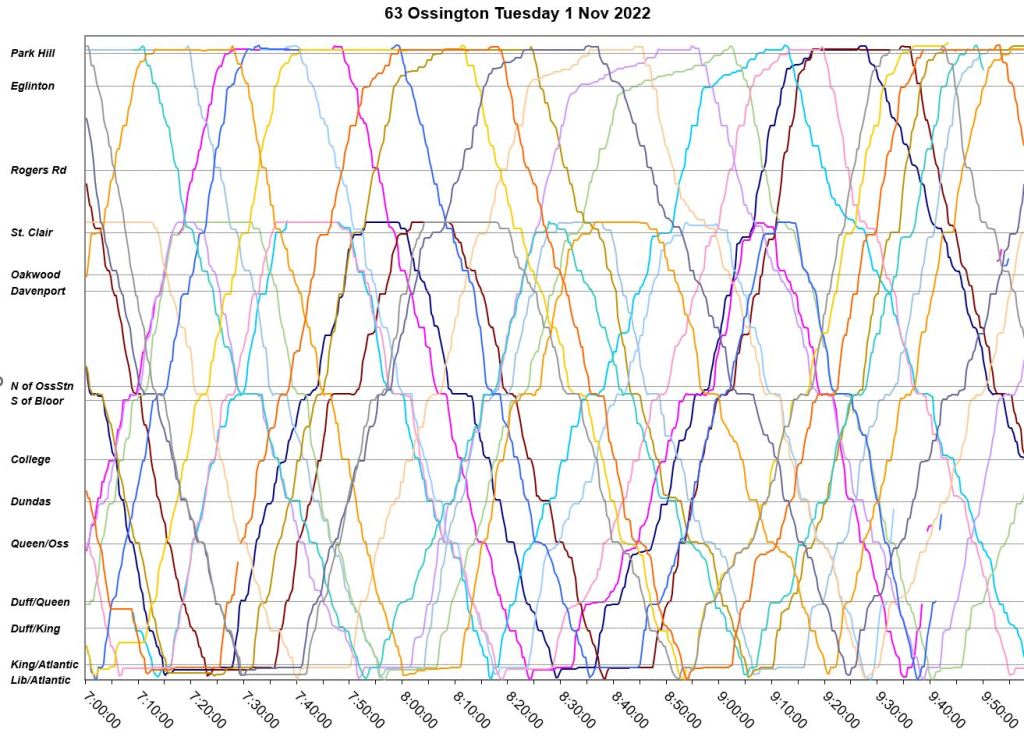
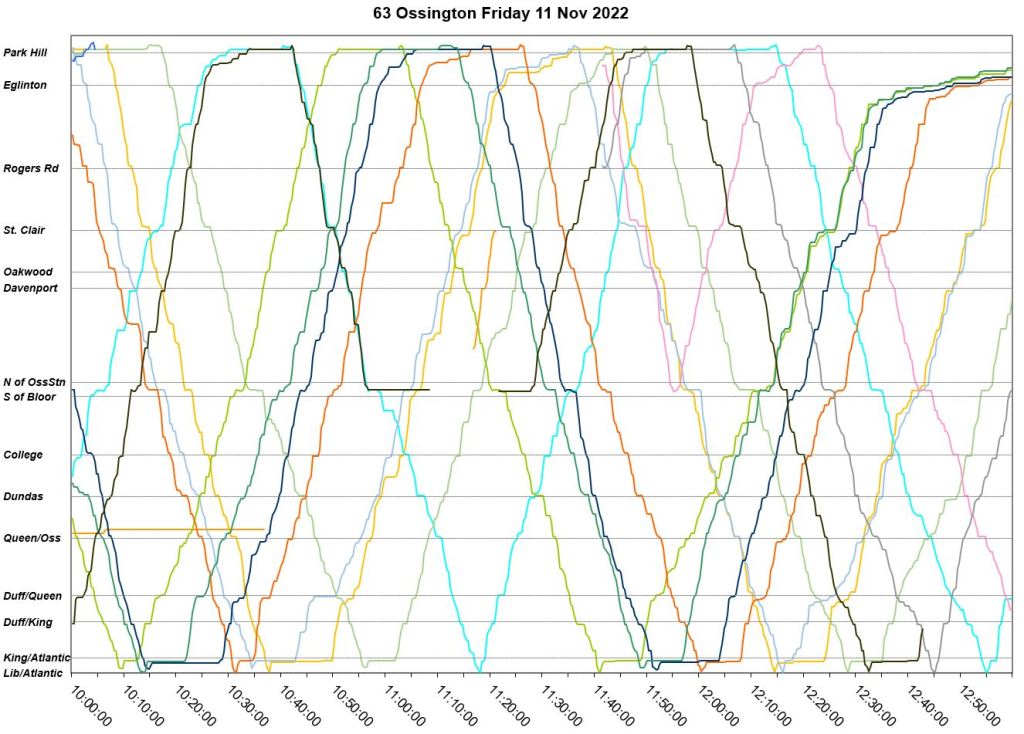
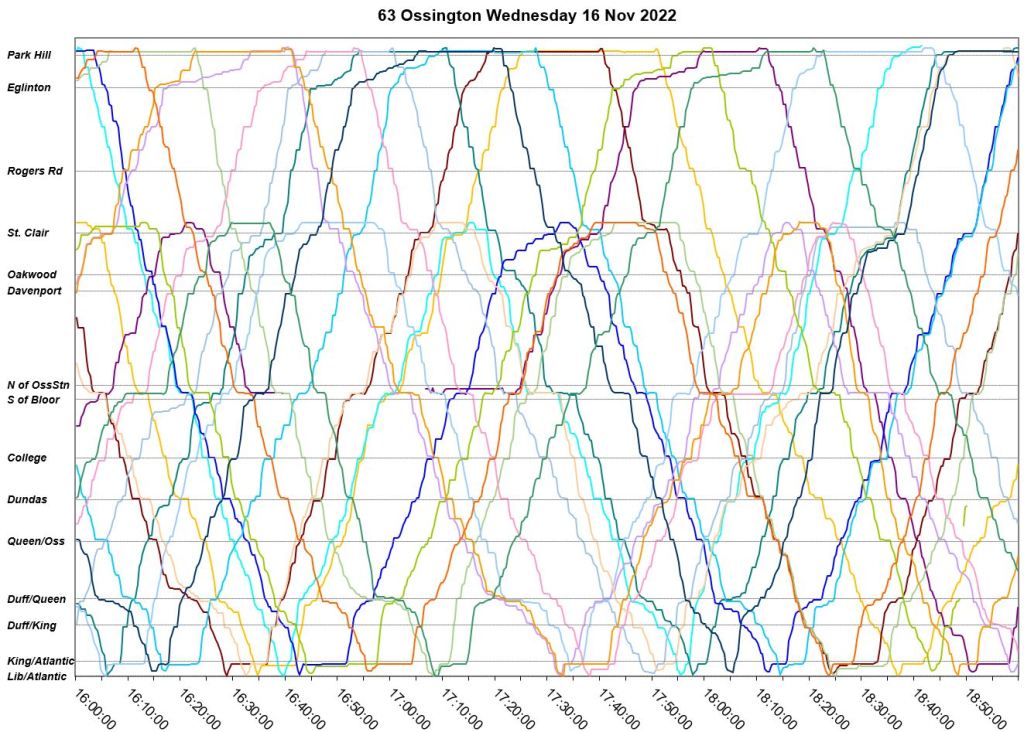
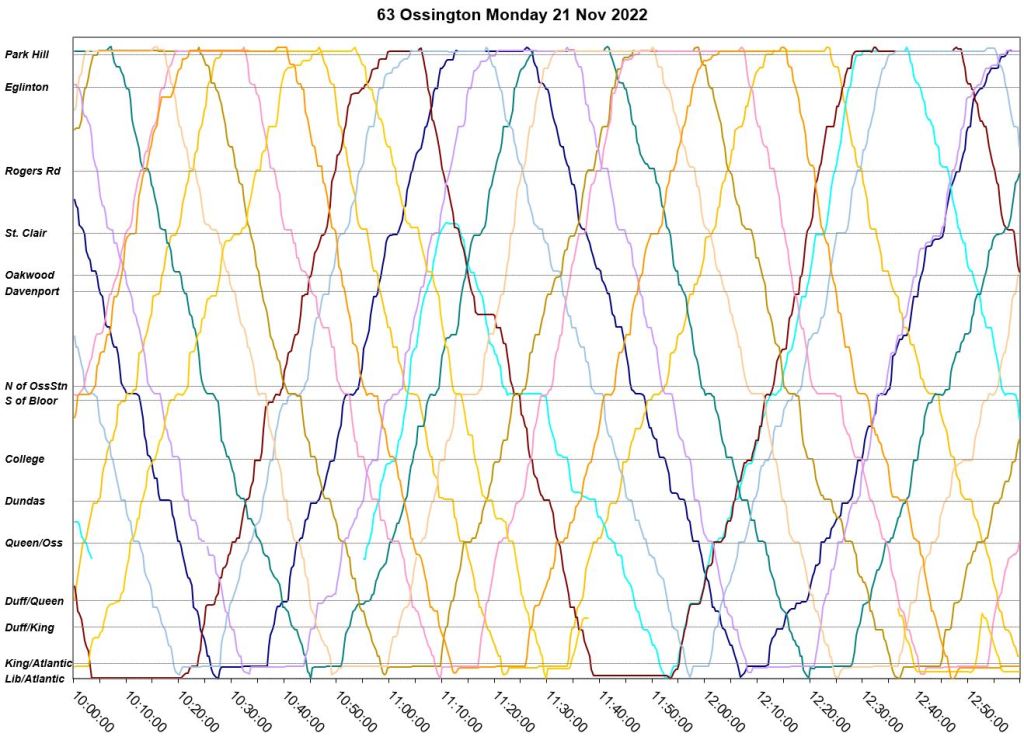
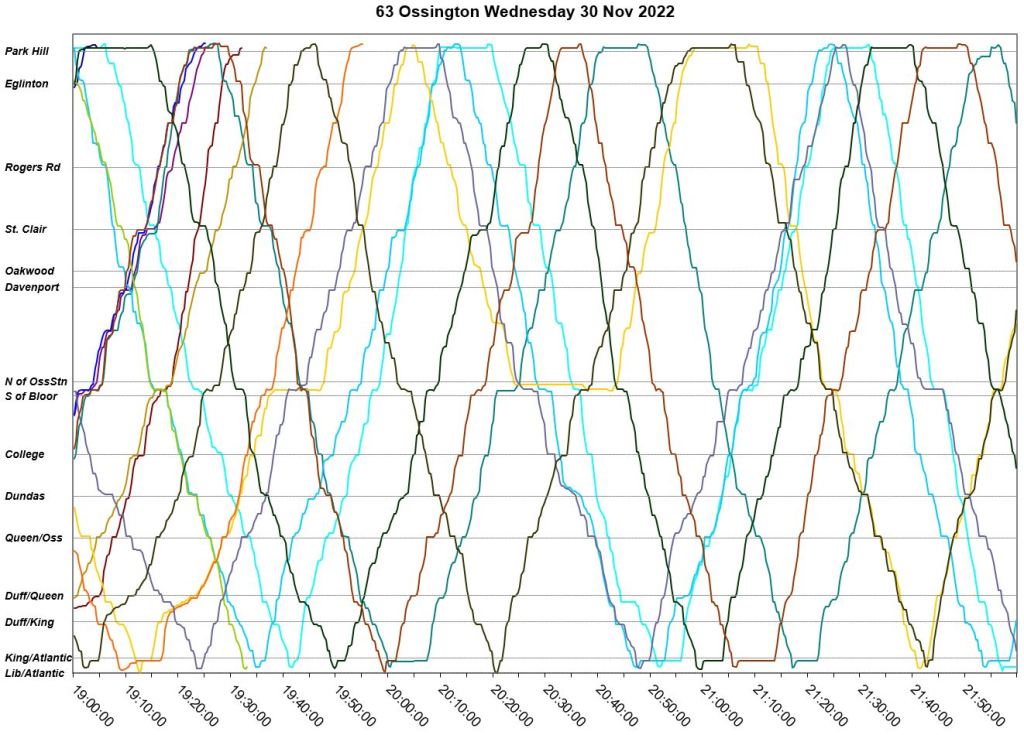
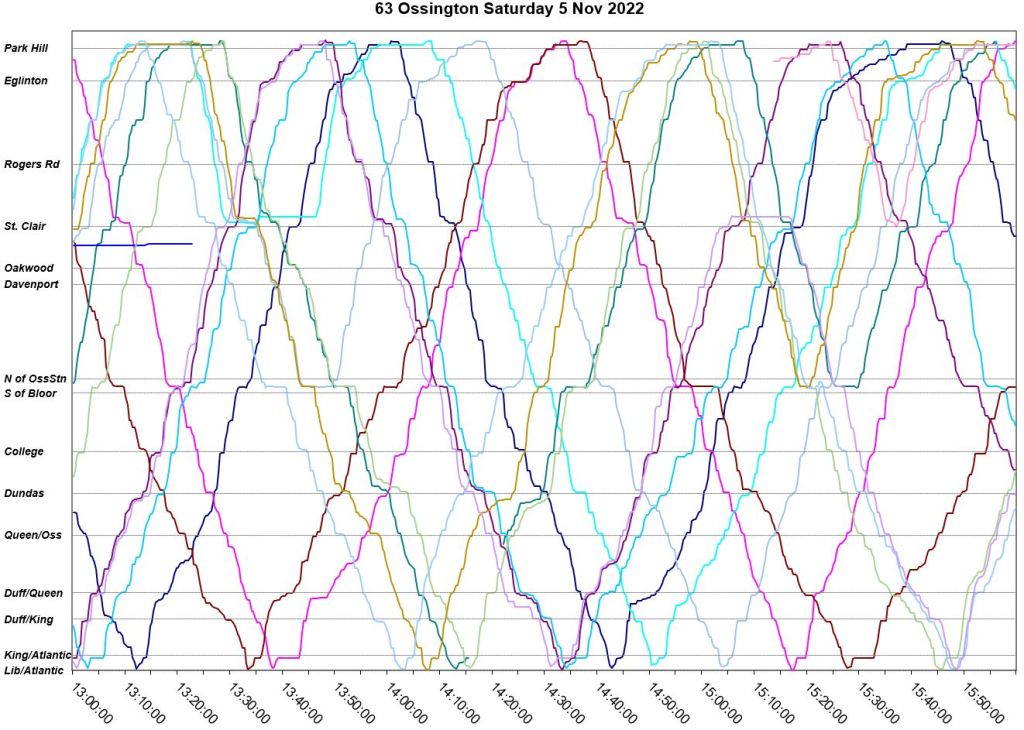
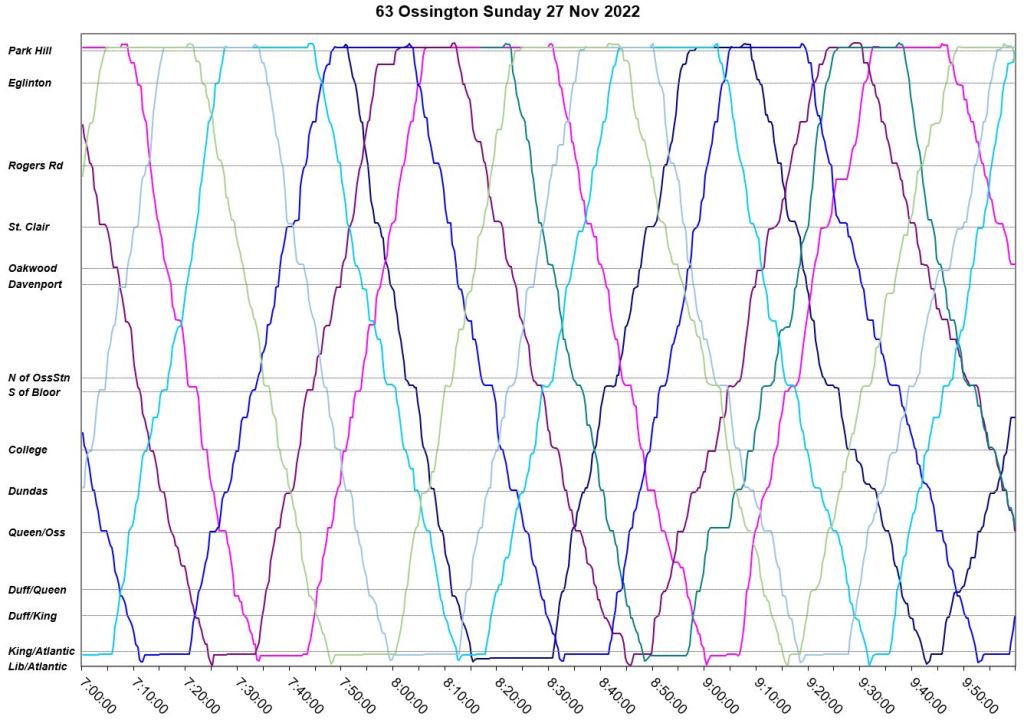
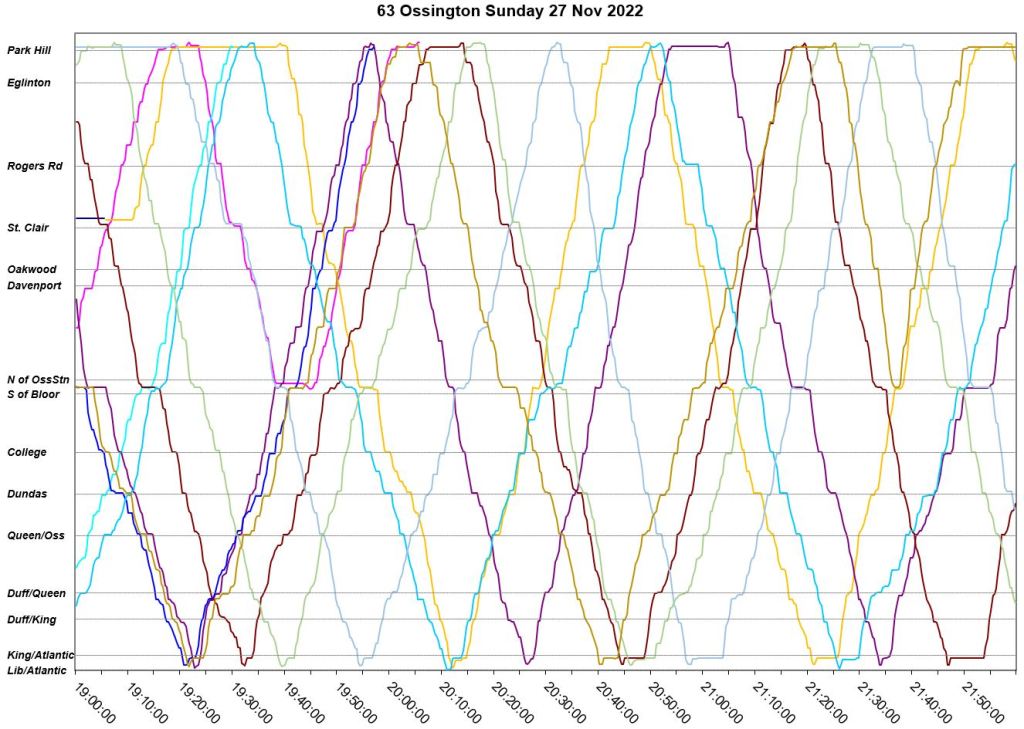
Sample Operating Charts
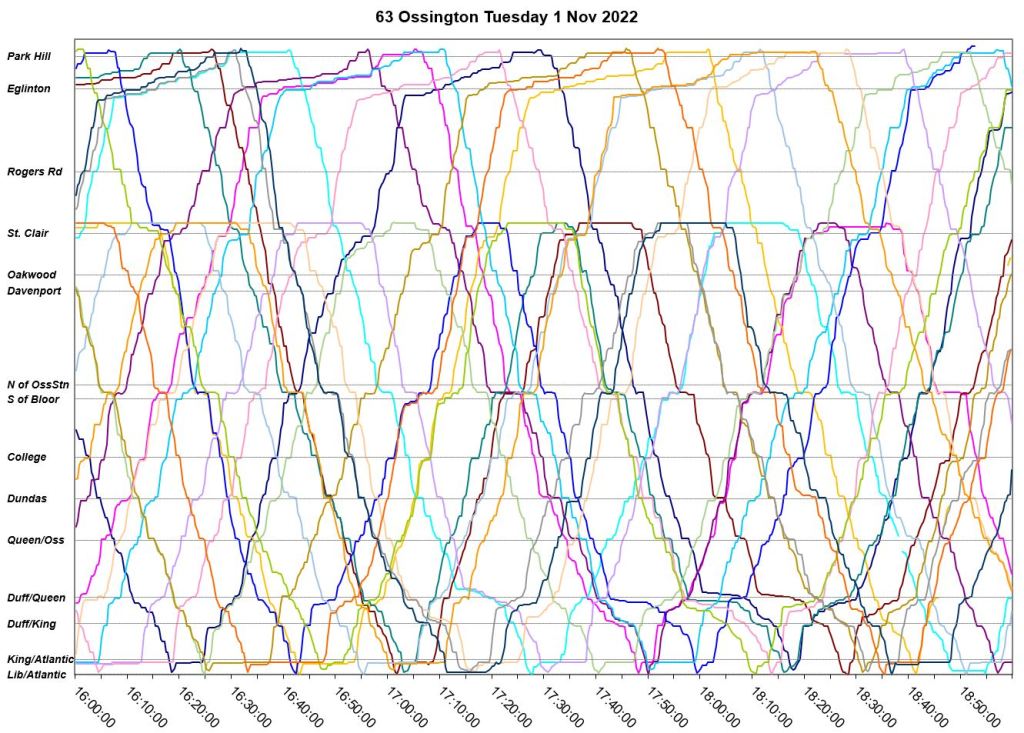
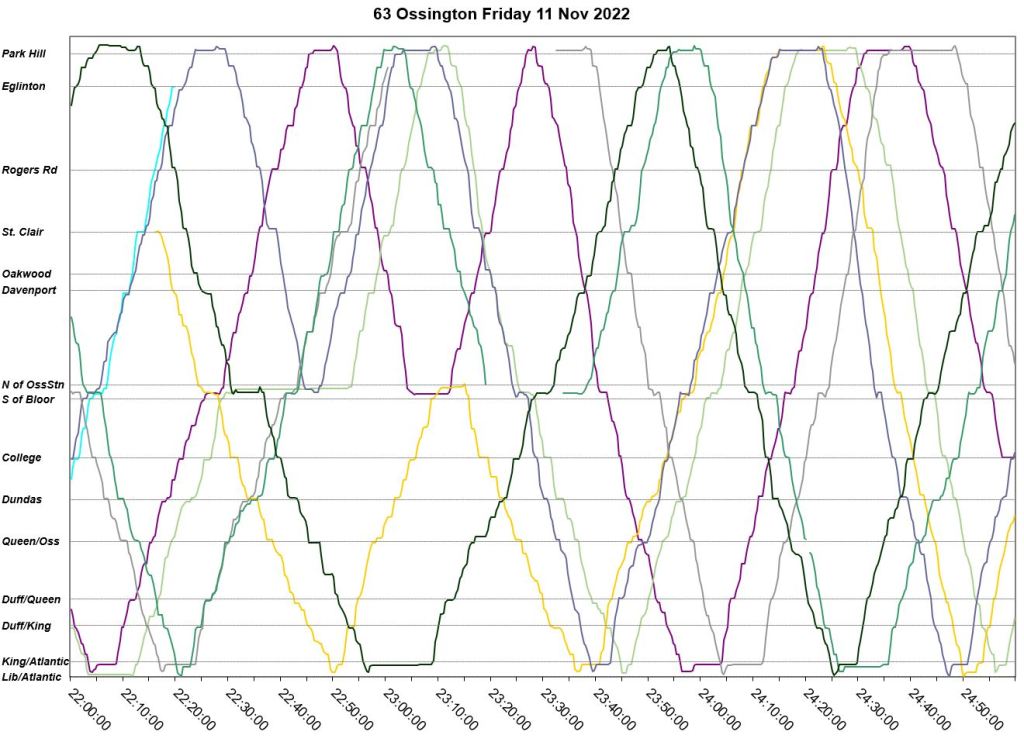
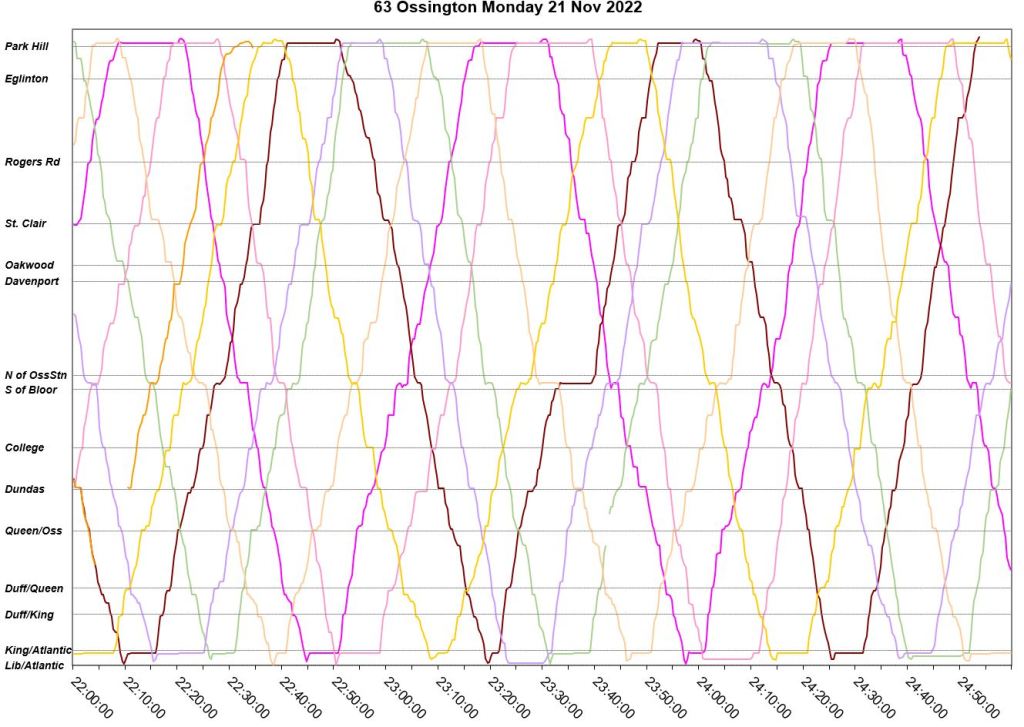
These charts show the movement of individual vehicles back and forth on the route for selected days. The north end of the route, Eglinton West Station, is at the top, and the south end, Atlantic & Liberty, is at the bottom. The south “end” is chosen to be at roughly the midpoint of the large loop, and just before the layover point. Note that the chart legends map northbound locations such as King & Dufferin on the western part of the loop.
Lines move back and forth on diagonals representing the position of buses through the day. Where a line becomes more vertical, the bus is moving faster; where more horizontal, the bus is slower, typically due to congestion. This is most commonly seen with service between Oakwood and Eglinton and Eglinton West Station eastbound, although occasionally elsewhere.
Where a line is horizontal, the bus is stopped. This is most common at the terminals and at Ossington Station.
Where lines are close together, buses are running in pairs or worse. Where they are far apart, this is a gap in service. A common situation has two or more vehicles running close together over an entire trip or more without their spacing being adjusted to even out service.
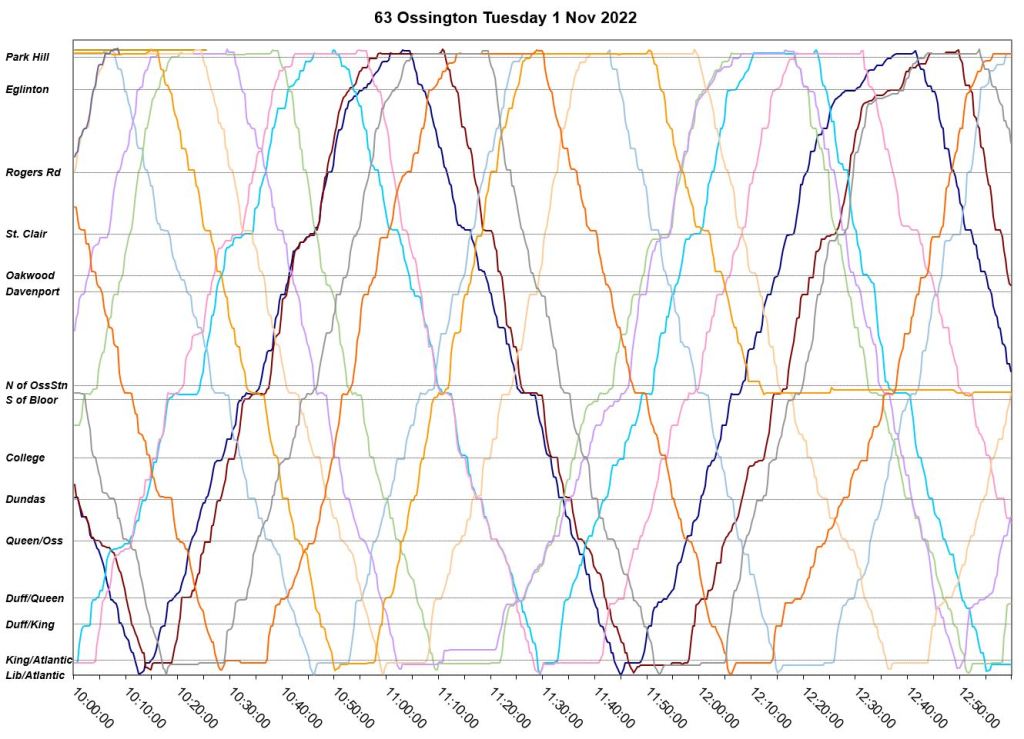
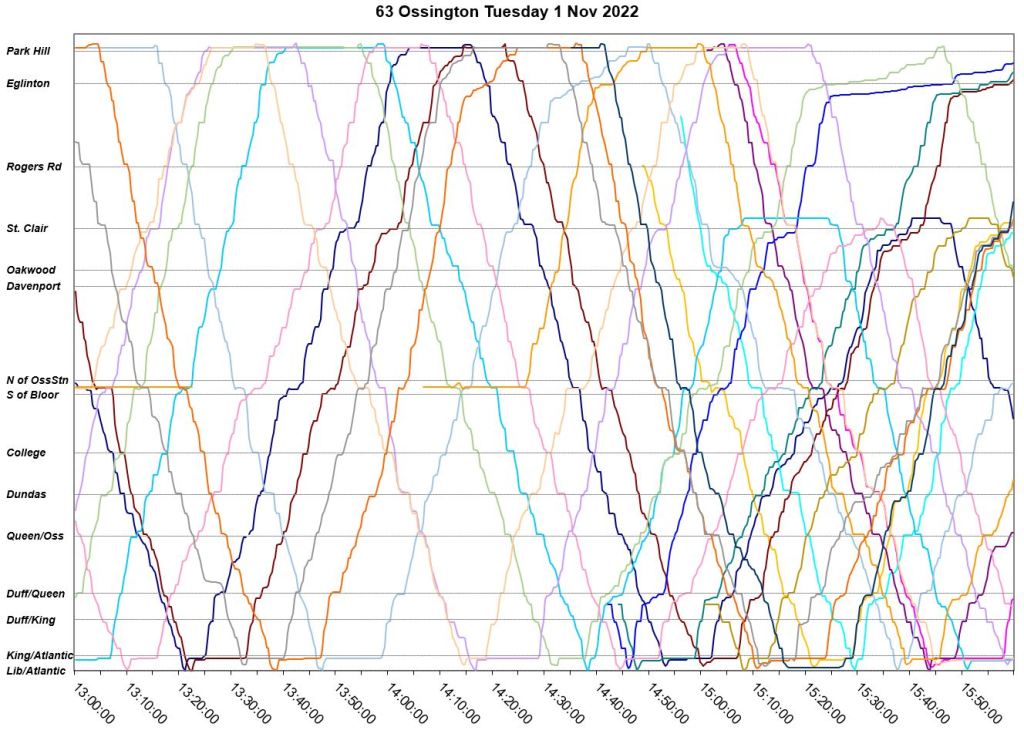
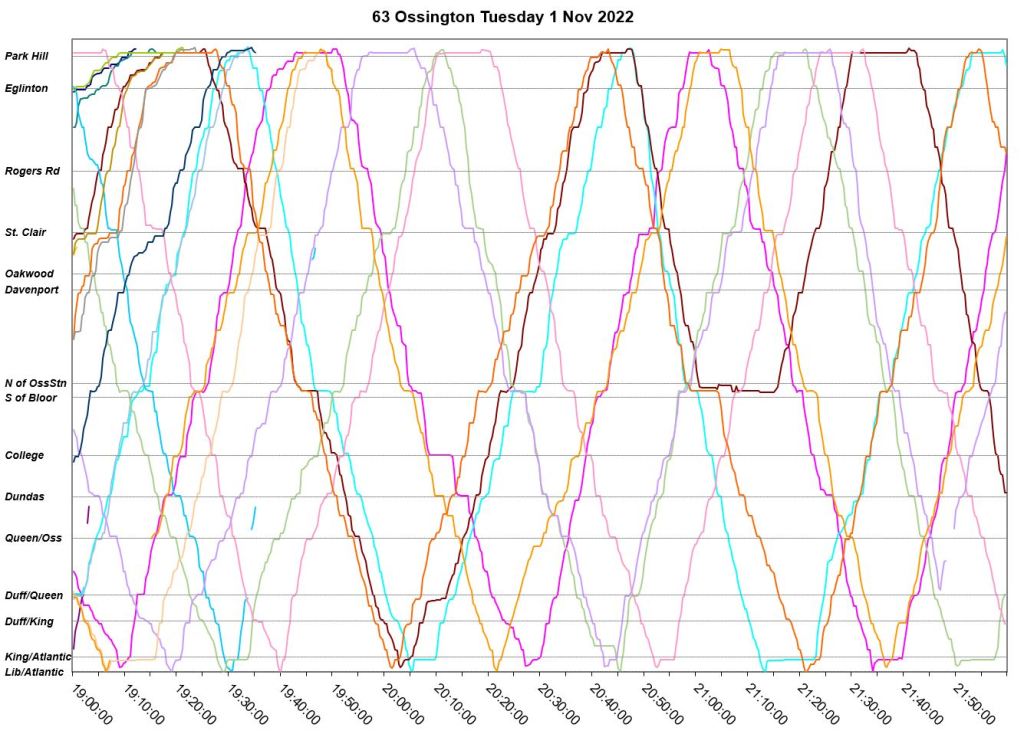
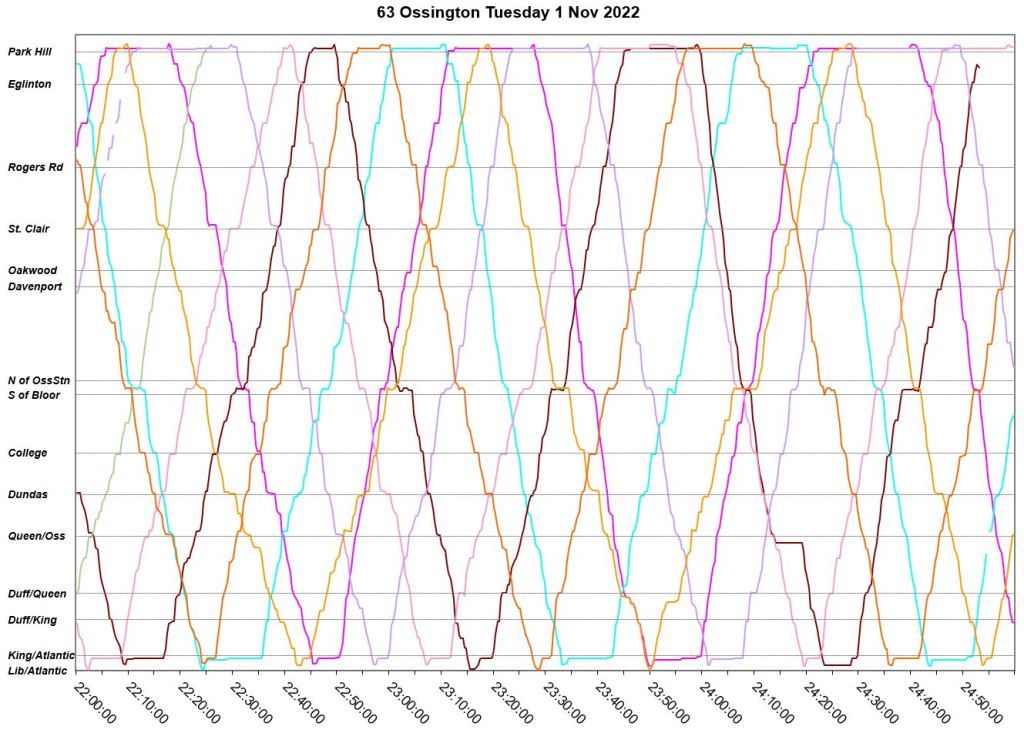
Tuesday, November 1
The patterns seen in the charts below are fairly common for a weekday:
- The short turn service at St. Clair is normal and scheduled. Most buses take a layover here indicating that their schedules are not tight.
- Congestion is evident eastbound on beween Oakwood and Eglinton West Station for part of the am peak, but more severely through the pm peak. There is also congestion eastbound from Ossington on Queen in the latter part of the pm peak.
- Buses run in pairs or triplets commonly through the midday and early evening. This also occurs in the late evening but to a lesser degree.
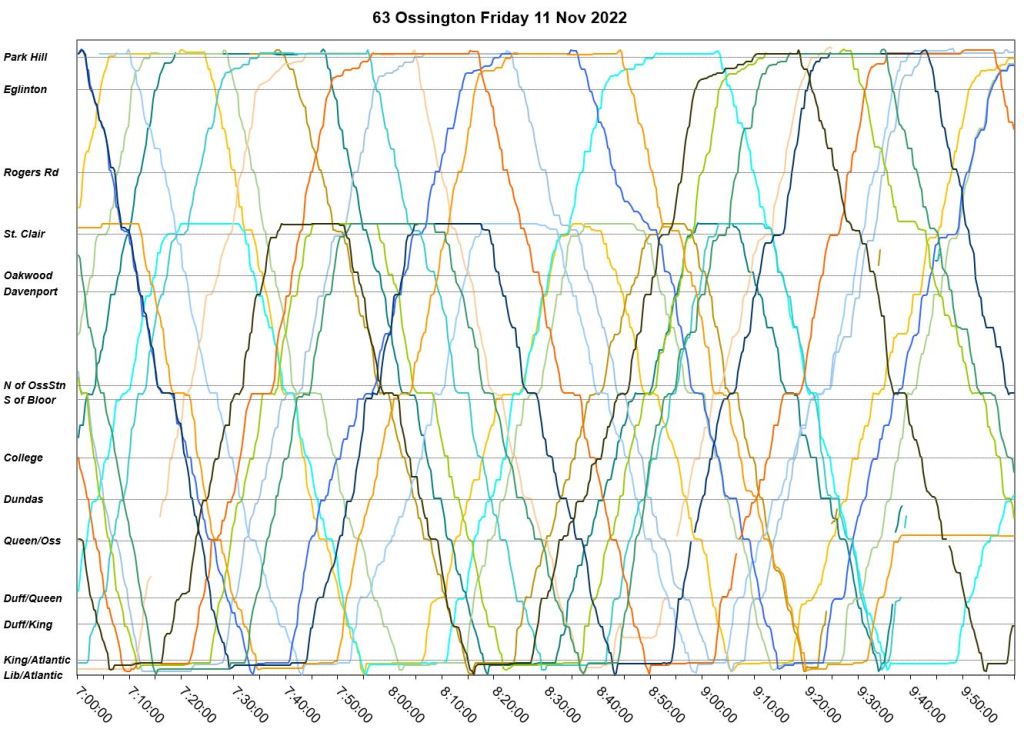
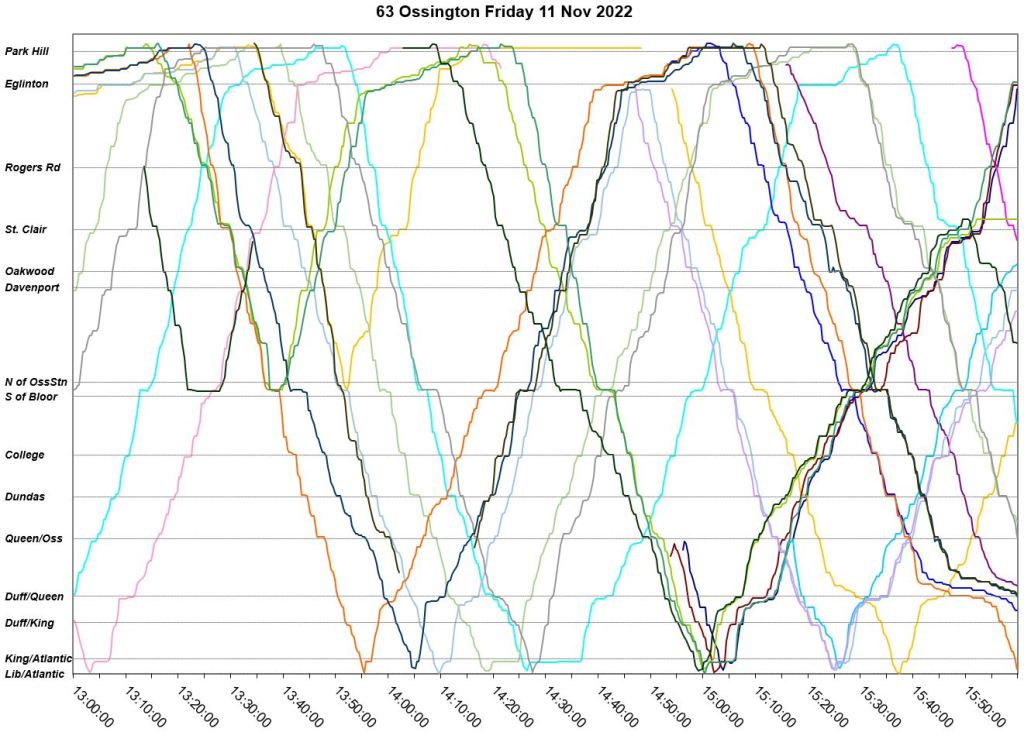
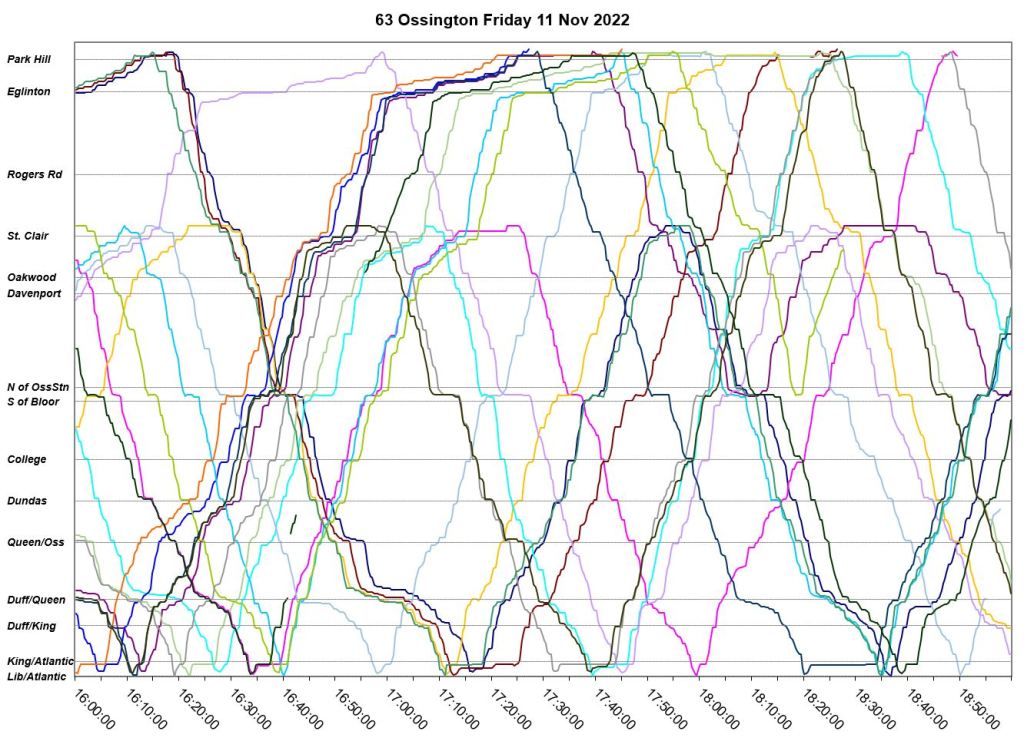
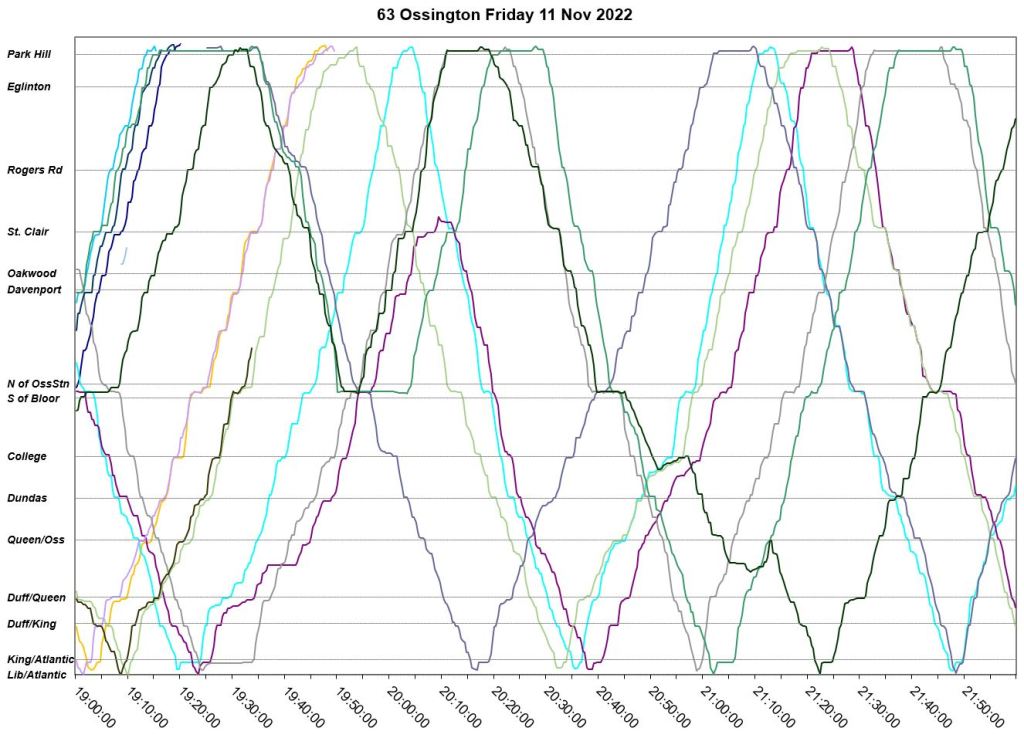
Friday, November 11
This is another weekday, but the service has worse gaps and bunching than on November 1 above.
- There is a wide gap northbound from King between 11:20 and 11:50 am because one bus short turns at Ossington Station southbound. This compounds with congestion at Eglinton around noon to create a nearly hour-long gap southbound between 12:20 and 1:20 pm, and again northbound.
- Through the afternoon and into the early evening, buses run in packs of four or more.
- Service continues to be erratic through the evening, and a large gap on the south end of the route is caused by two short turns at Ossington Station.
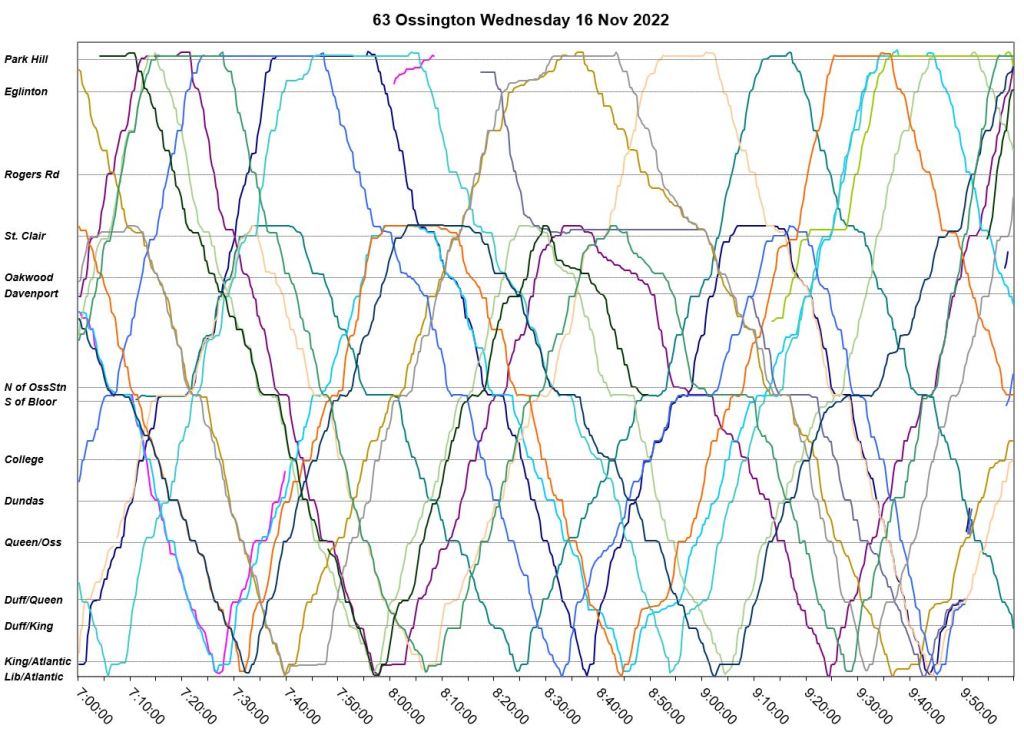
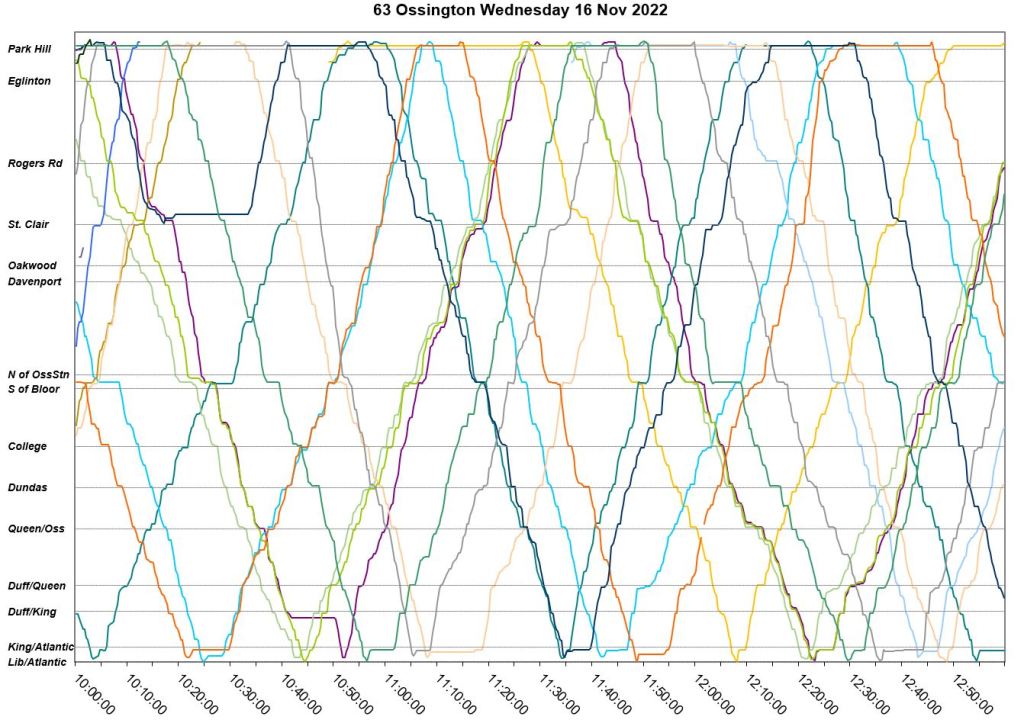
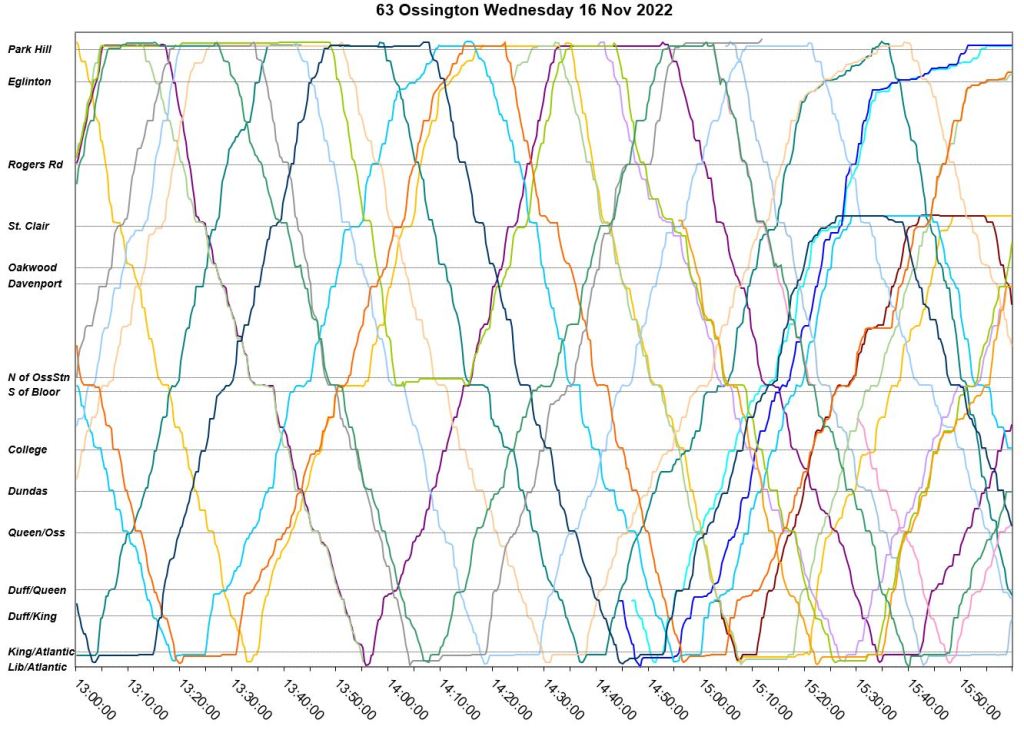
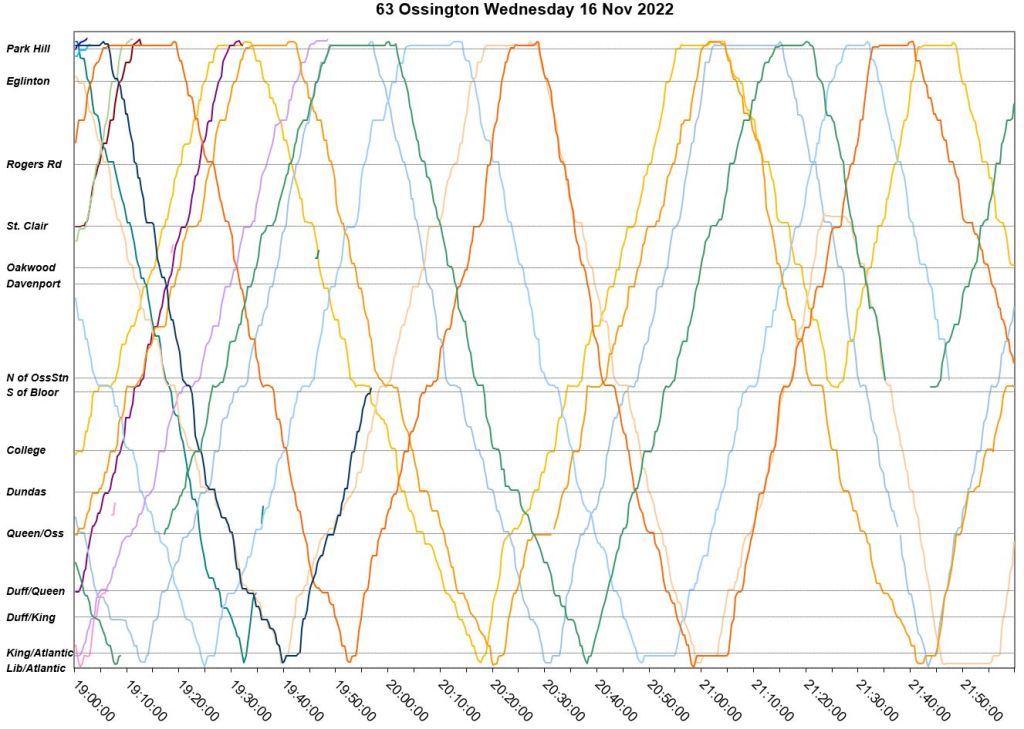
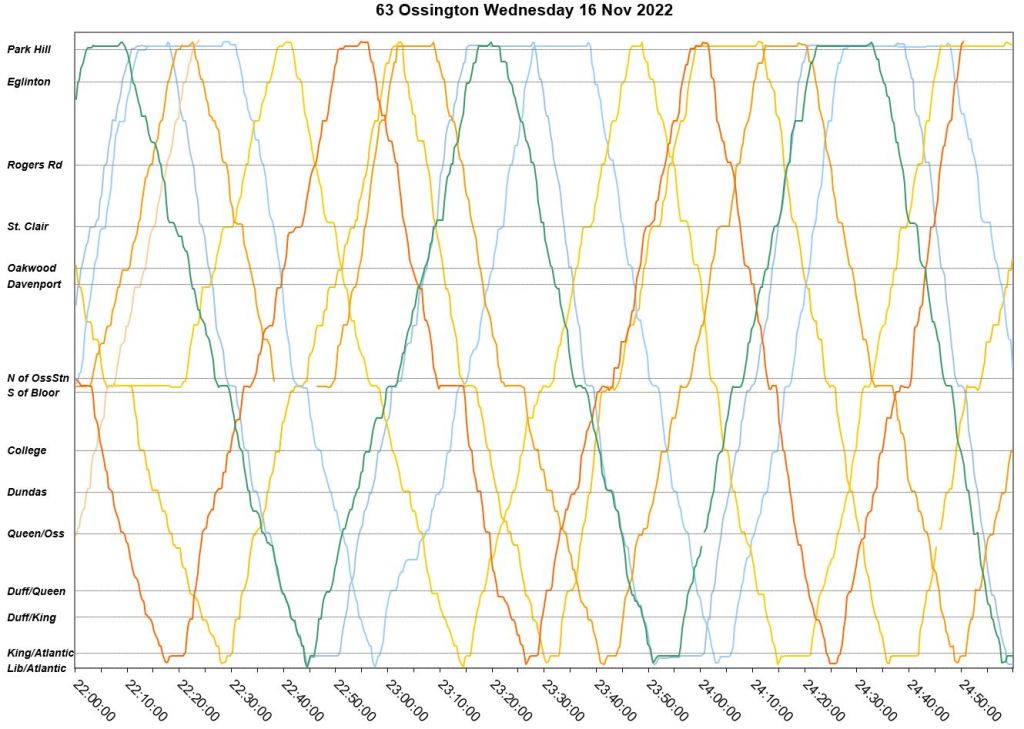
Wednesday, November 16
This weekday is better behaved than November 11 above, and congestion problems are not as severe. However, gaps and vehicle bunching in the evening remain. There are some unscheduled short turns at Ossington Station and at St. Clair.
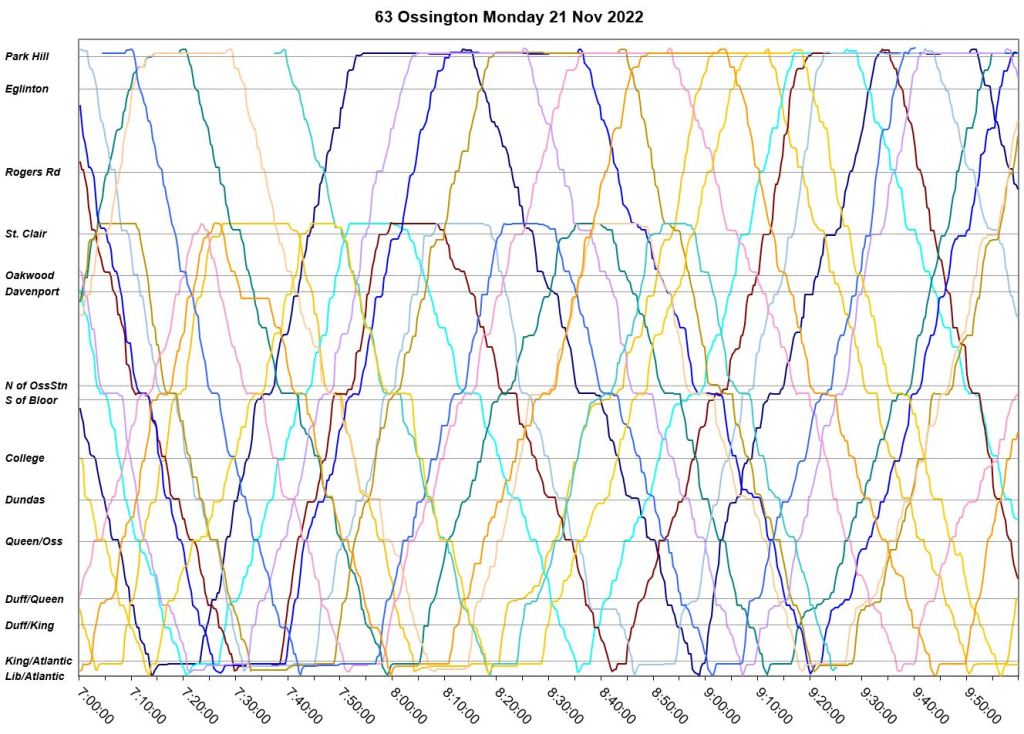
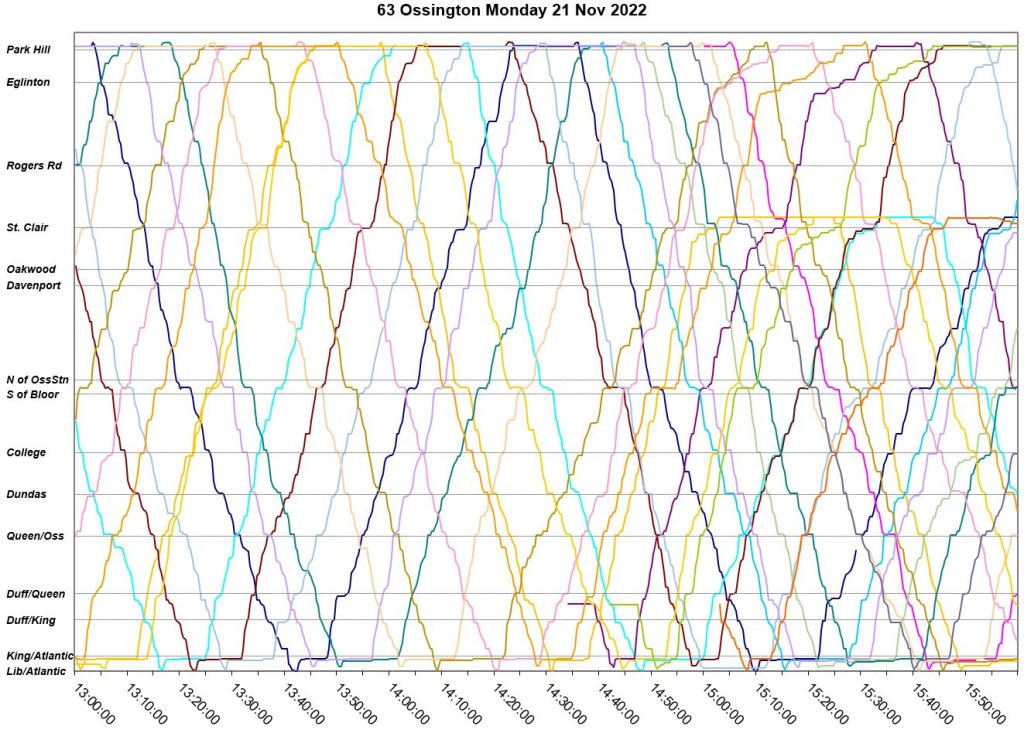
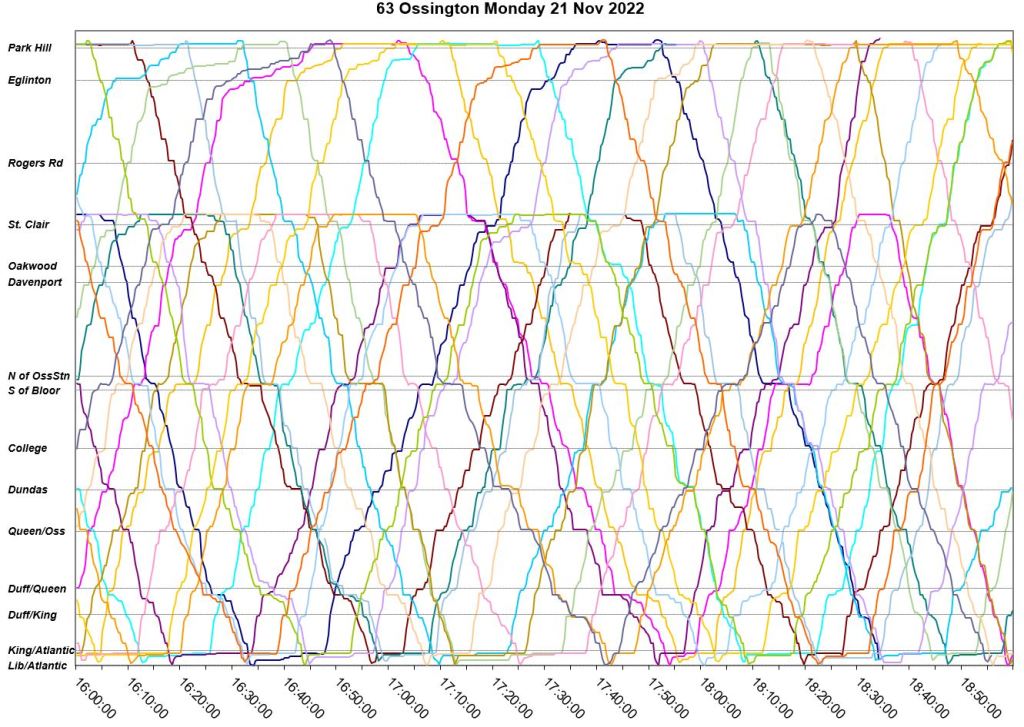
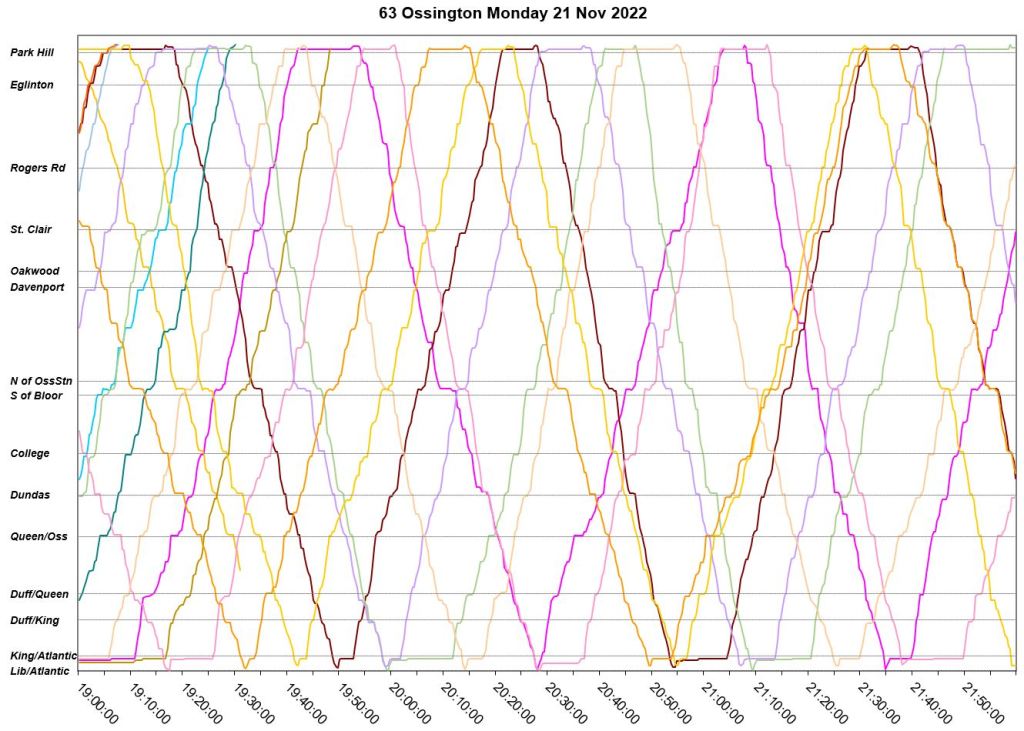
Monday, November 21
November 21 is an example of fairly regular service. There is relatively little congestion at Eglinton and none at the south end of the line. Some bunching does occur in the evening, but not on the scale seen on other days. Note that most trips have time for layovers at Eglinton and at King.
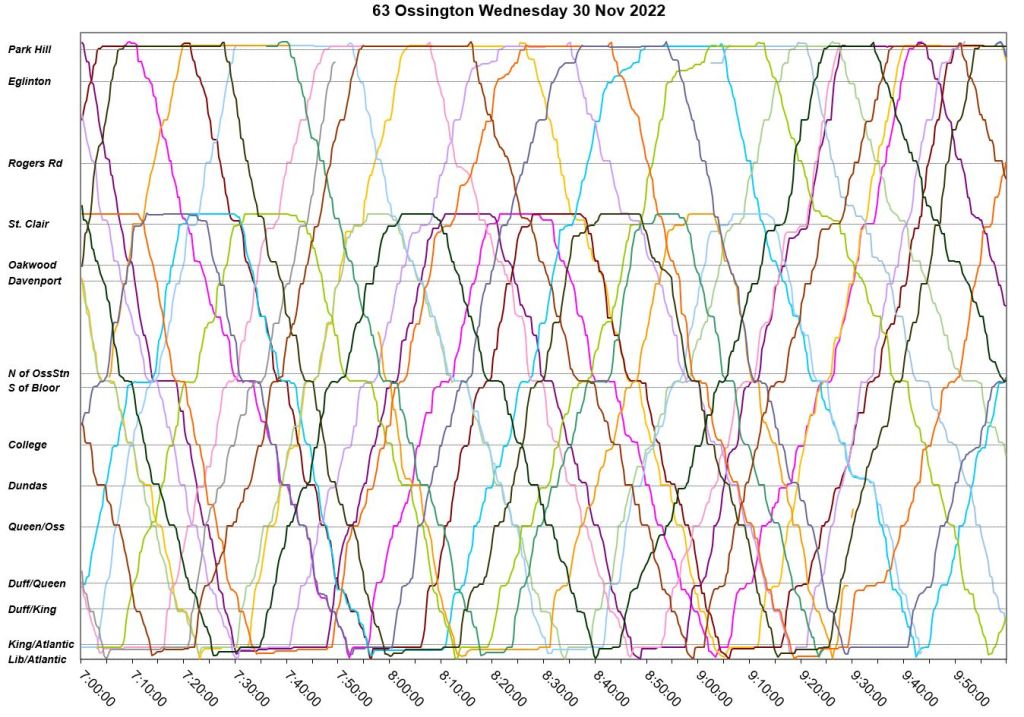
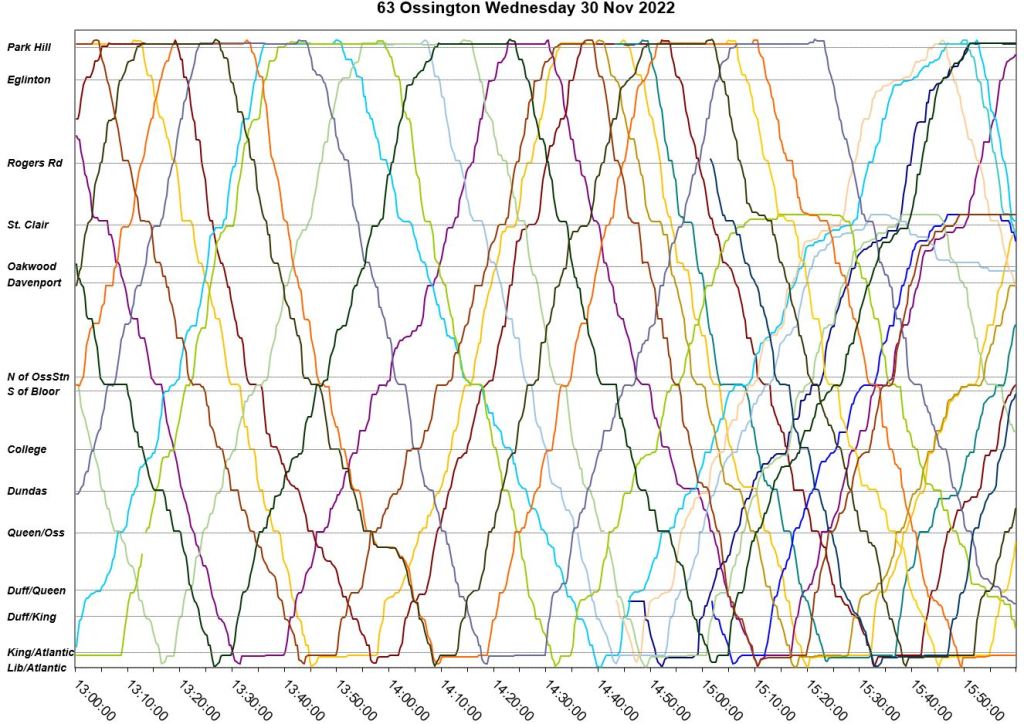
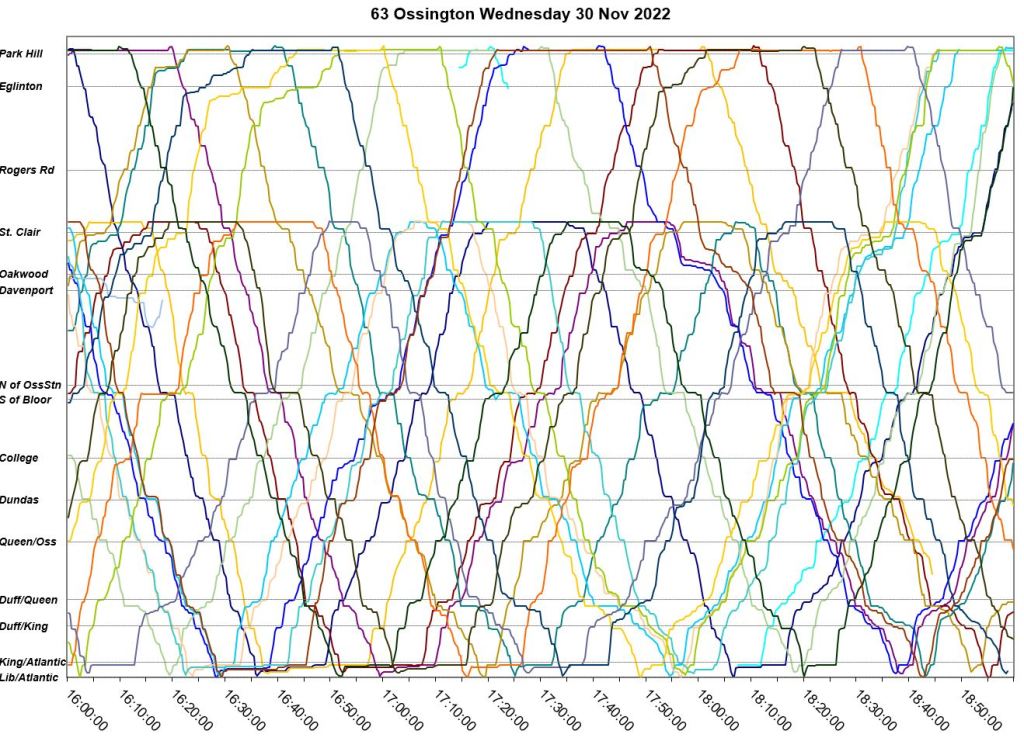
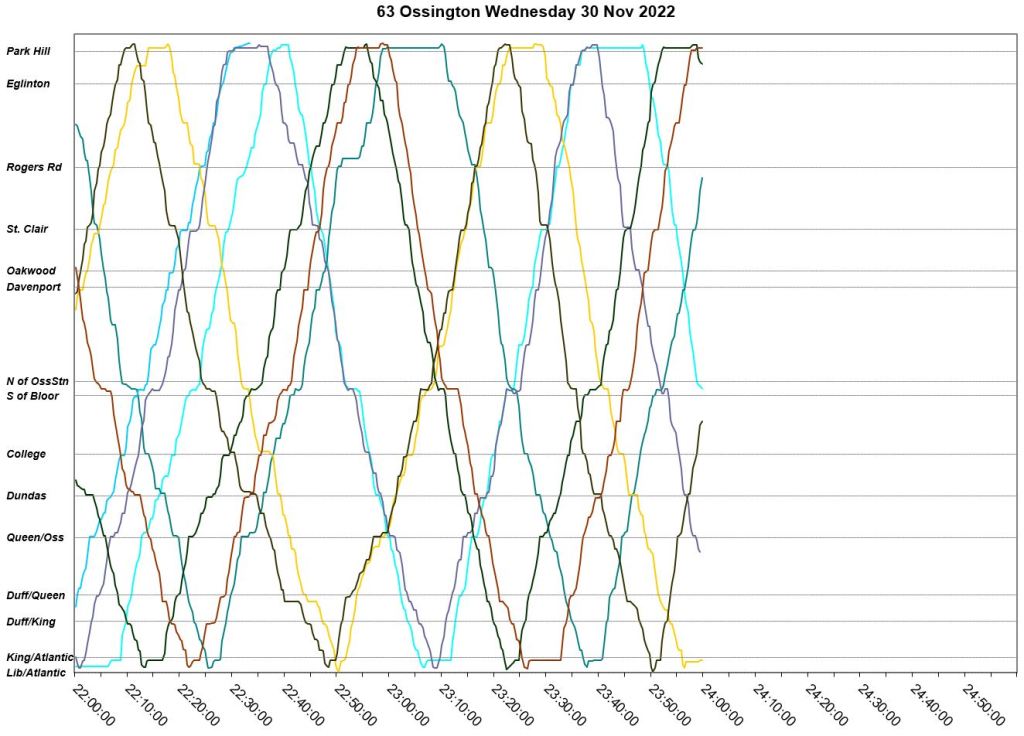
Wednesday, November 30
November 30 has fairly reliable service up to the late morning when the combination of a bus disappearing from service plus a short turn at Ossington Station creates a gap. This is sorted out early in the afternoon.
A cluster of buses forms at about 6 pm and lasts until about 7:30. Evening service contains some bunching and gapping in part because at least one bus is missing.

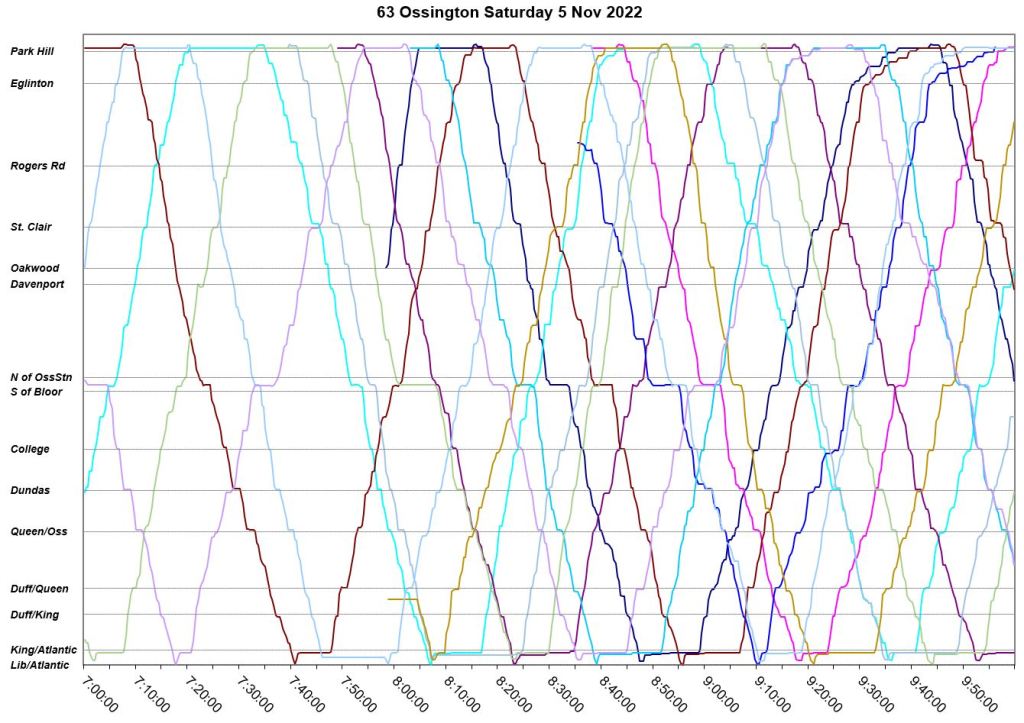
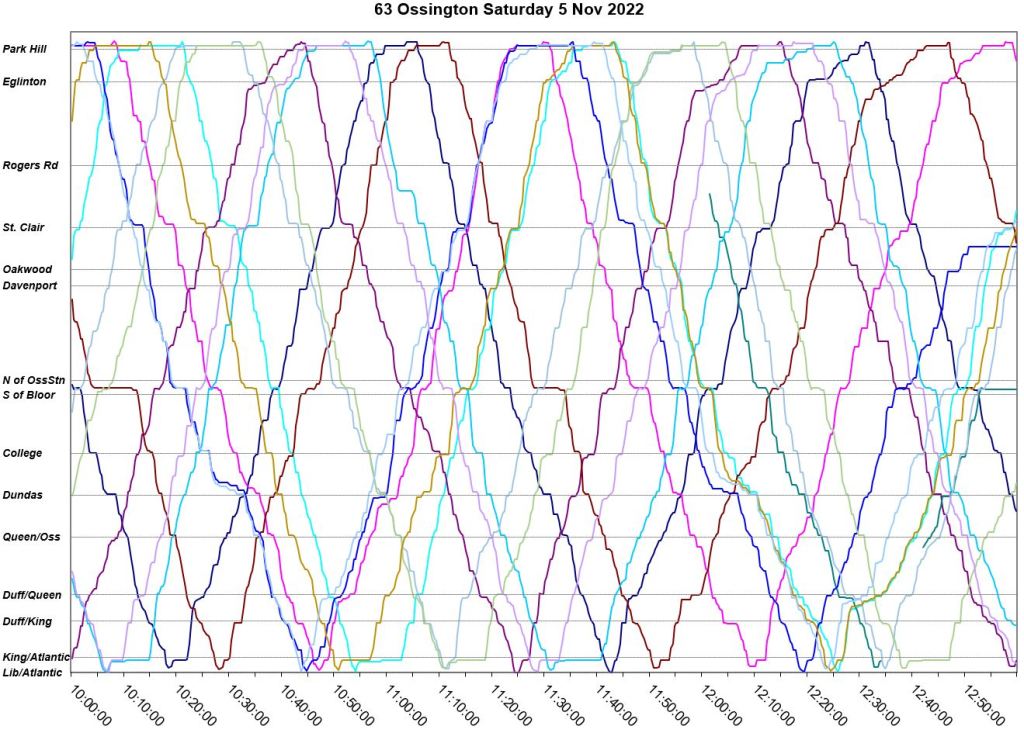
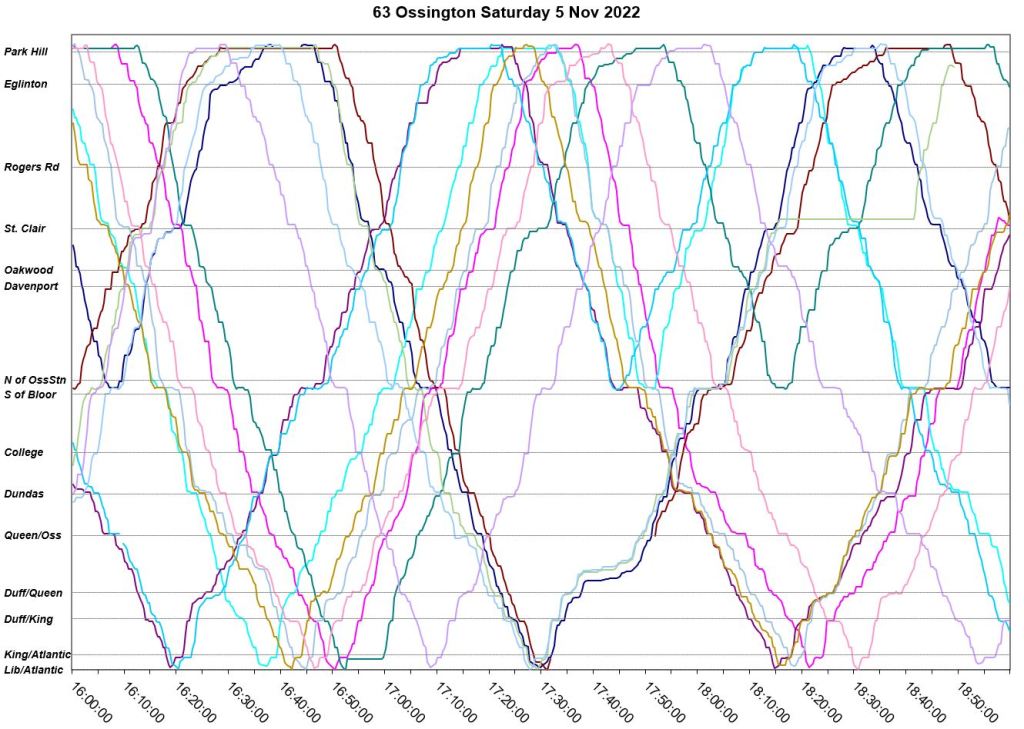
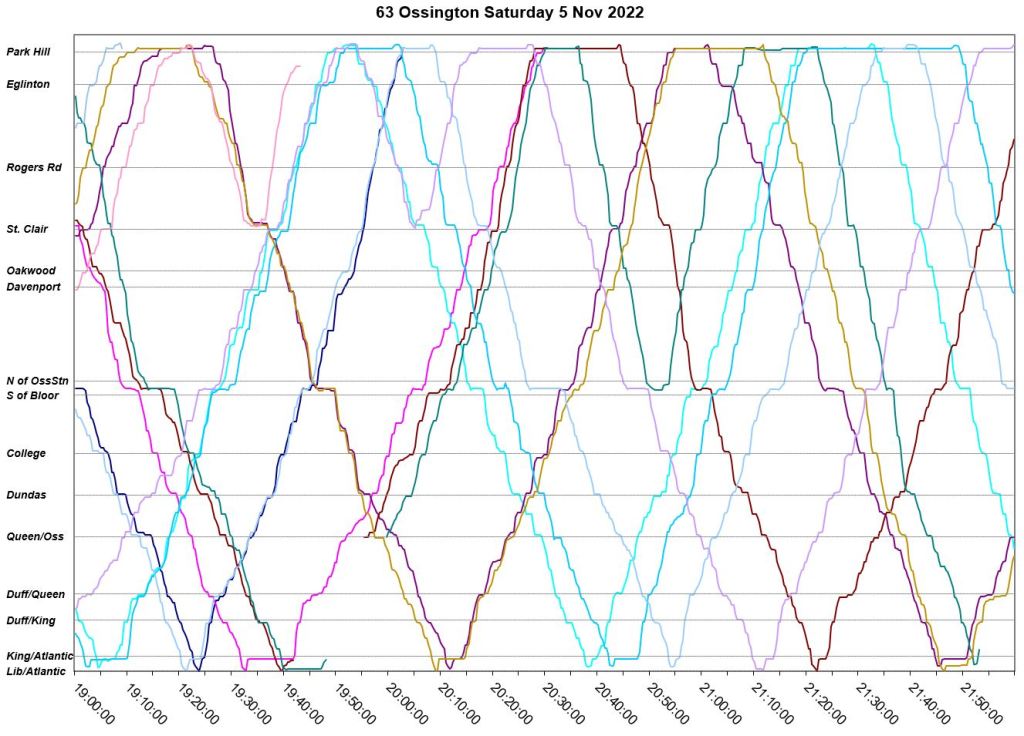
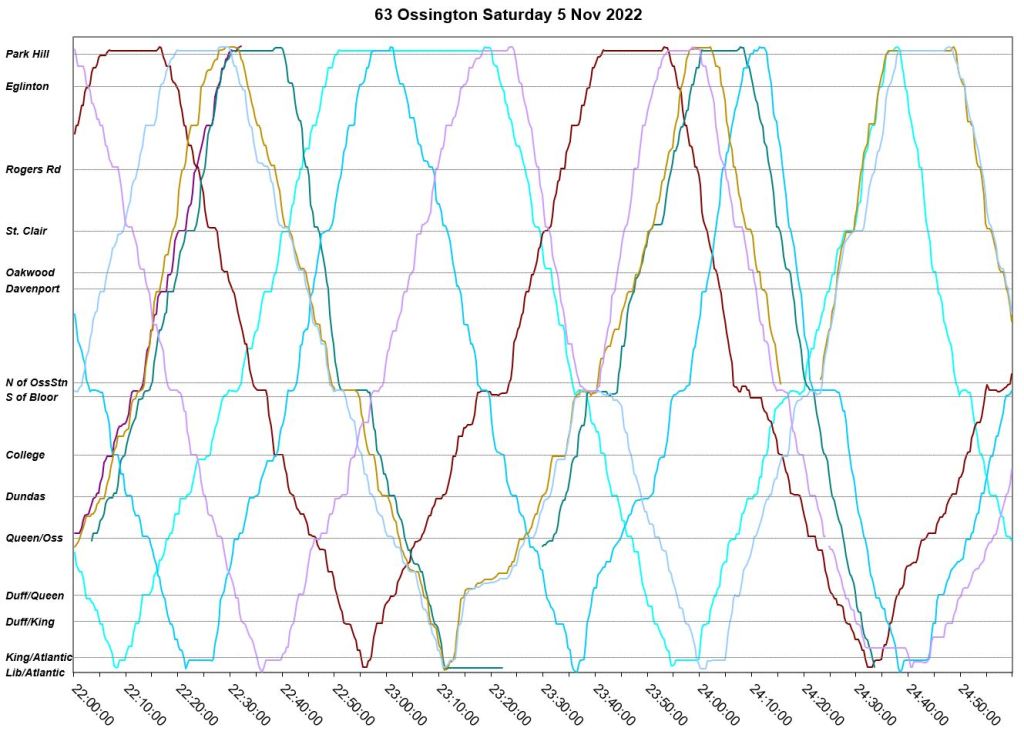
Saturday, November 5
November 5 is particularly bad with buses running in pairs or worse from mid-morning right through to late evening. The problem compounds as the day goes on with several buses all being at a terminal at the same time and departing as a group.
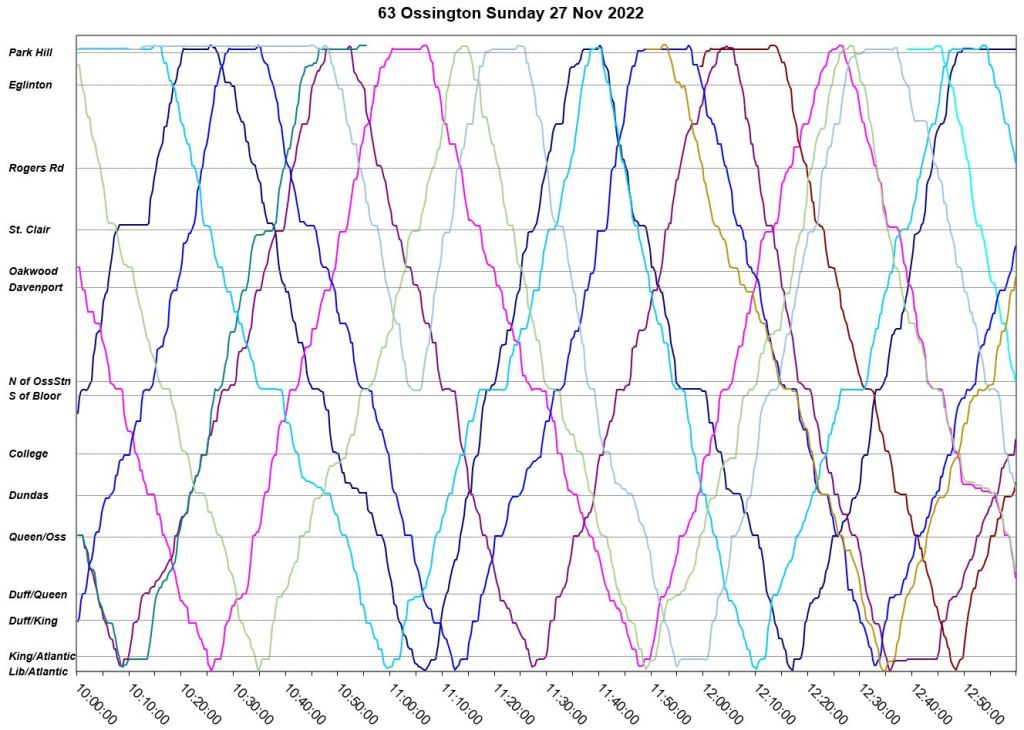
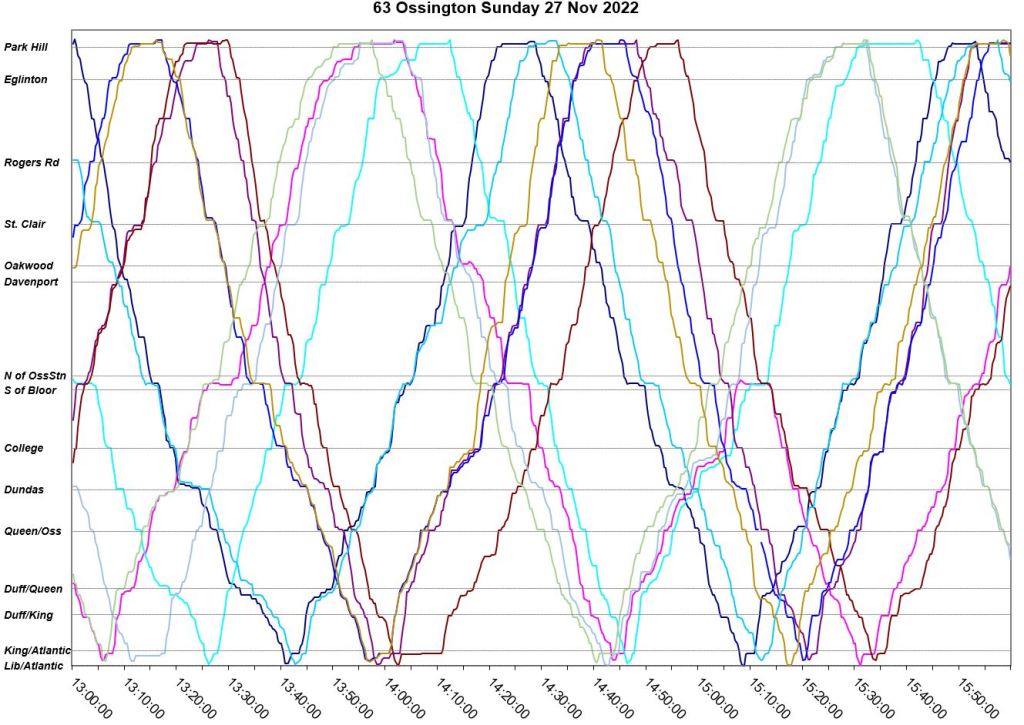
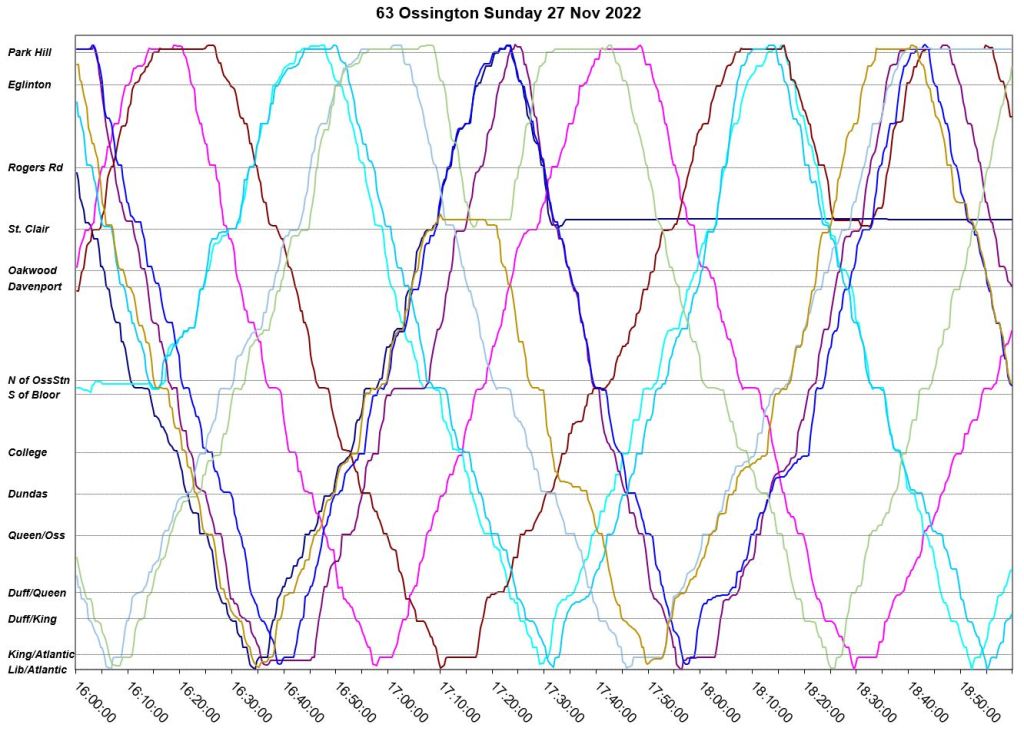
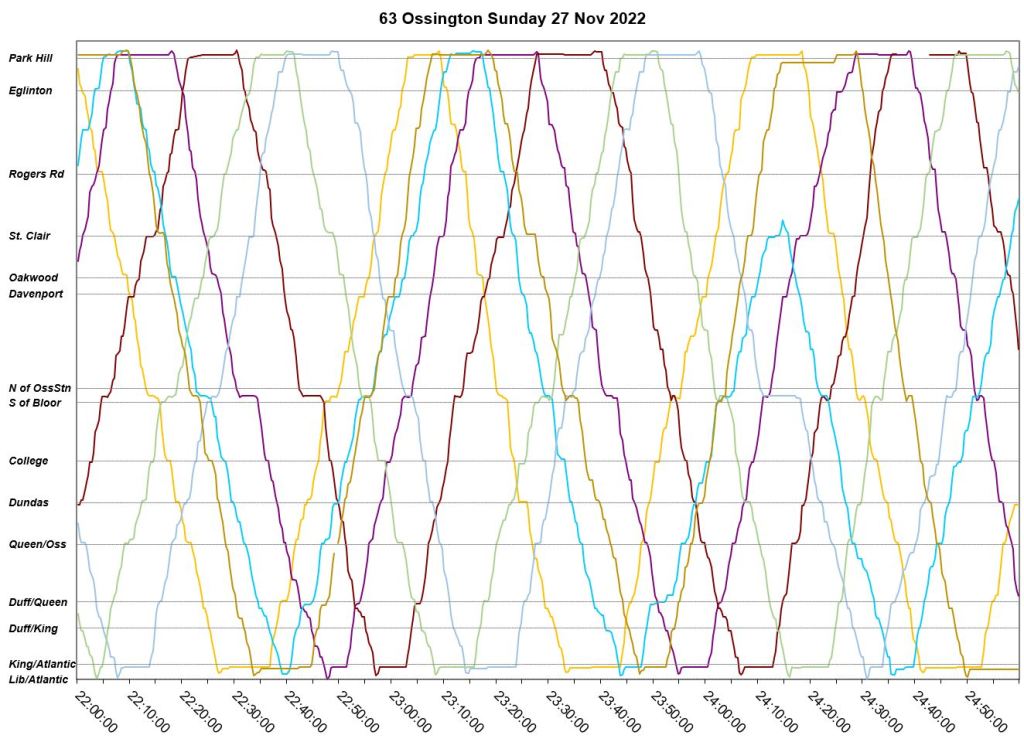
Sunday, November 27
November 27 is a Sunday with no congestion delays visible. However, as the Saturday shown above, bunching begins to appear by late morning and becomes progressively worse as the day goes on. By 3:00 pm, seven of the ten buses on the route are at the south end of the line and the other three are together at the north end. This mess does not get unscrambled until mid-evening.

The 63 Ossington bus is the replacement of the old Davenport streetcar. The Ossington trolley bus could be called the streetcar killer. See a history of the 63 Ossington bus for a history of the Davenport streetcar.
LikeLike
I think you meant to title the article November 2022?….
Steve: Ooops! Yes!
LikeLike
Have you received the January 2023 service change memo yet?
Steve: No.
LikeLike
Honestly even back in the fall of 2022 September and October the 63 route had constant issues with scheduling etc. I really enjoy your blog Steve wishing you a happy and healthy rest of 2022 and a good start to 2023.
LikeLike