
Updated December 20, 2022: Detailed charts have been added for the segments between Jarvis and Yonge, and between Yonge and University. Click here to jump to the new part of the article.
This article continues a series looking at the travel times on King Street in the “transit priority” segment between Bathurst and Jarvis Streets with data to the end of November 2022.
With the resumption of commercial and social activities, the comparative calm on King has disappeared, and the street can be very busy in the Entertainment District especially in the evening. The laissez-faire approach to traffic management and enforcement on King did not matter much during the pandemic shutdowns, but the benefits of the priority area are slowly being lost.
This echoes other aspects of the transit system where as a City we seem to have forgotten how to run things well under “normal” conditions either because of permanent funding cuts, or because we have forgotten the effort needed to deal with heavier demand on our services and infrastructure.
The first set of charts in the article takes the long view starting in 2016 to show the evolution from before the transit priority zone was created, then the effect of that zone, the arrival of the pandemic and the return to pre-pandemic activity.
There are two distinct sections of King Street. East of University is the business district, and it is less affected, at least from a transit travel time point of view, because activity there is still below “normal”, pre-pandemic conditions. However, interference from north-south traffic backlogs at intersections is starting to have an effect, mainly in the PM peak. West of University is the Entertainment District and its high density residential neighbourhood where one might ask “what pandemic?” from the number of pedestrians and motorists on the streets.
Later in the article, I will review changes in travel times over short segments between Jarvis and Bathurst.
The situation on King with deterioration of the transit priority area’s benefit was the subject of a recent item by the CBC: What’s Happened to the King Street Transit Corridor?
The Long View: 2016 to 2022
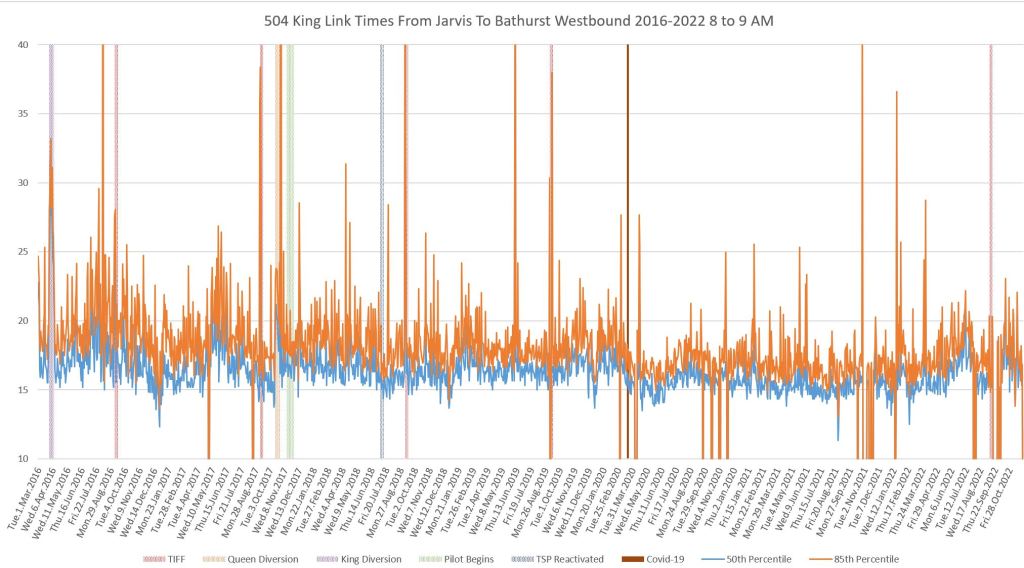
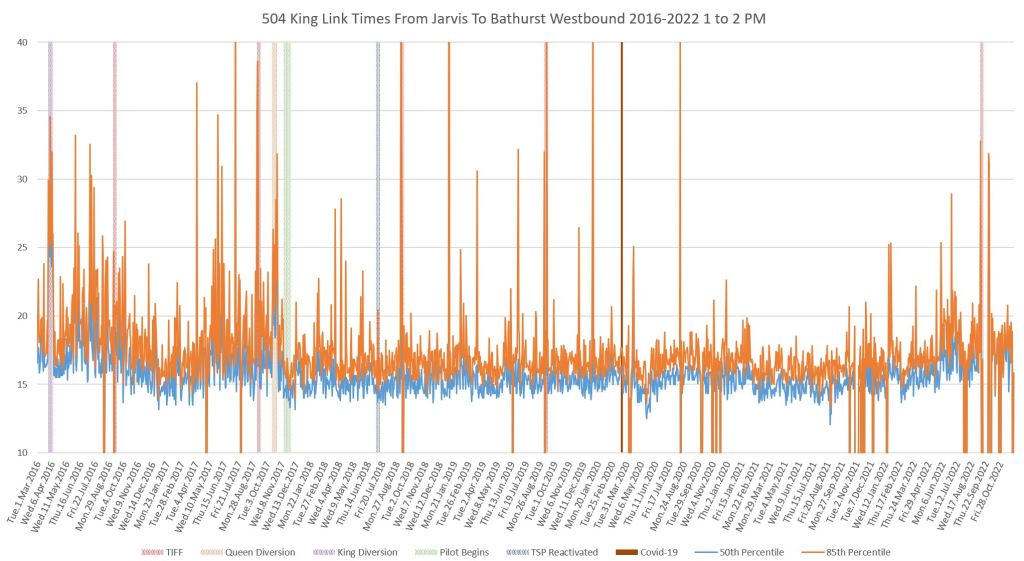
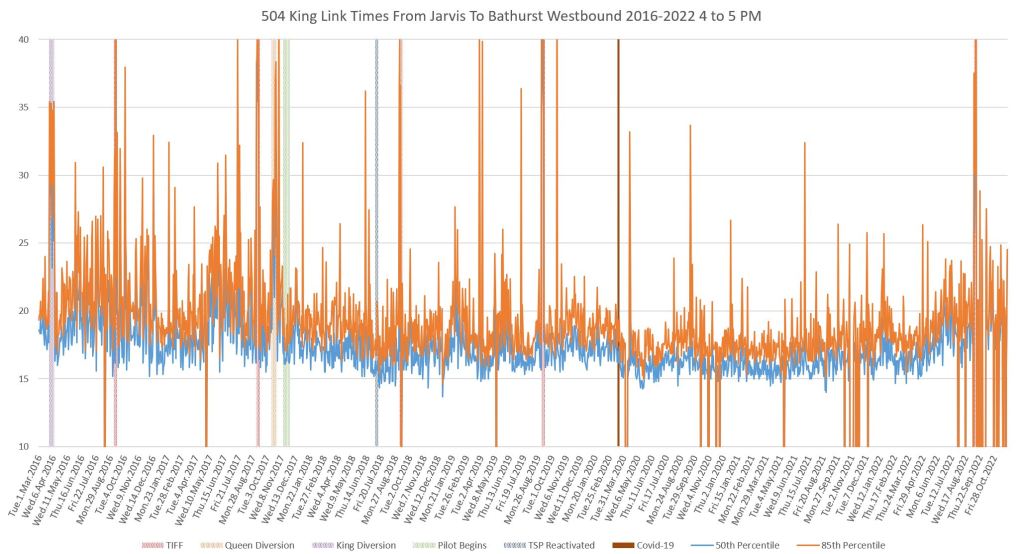
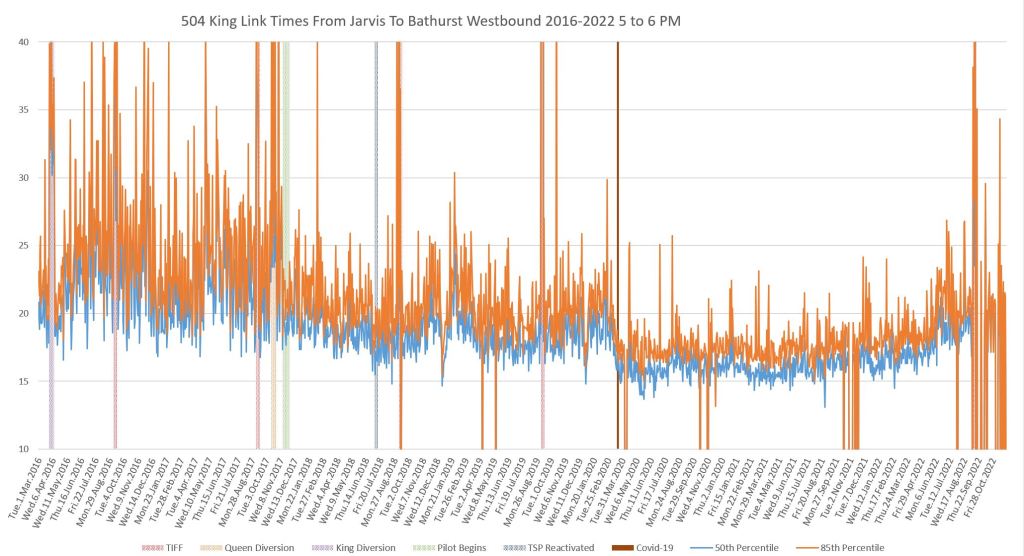
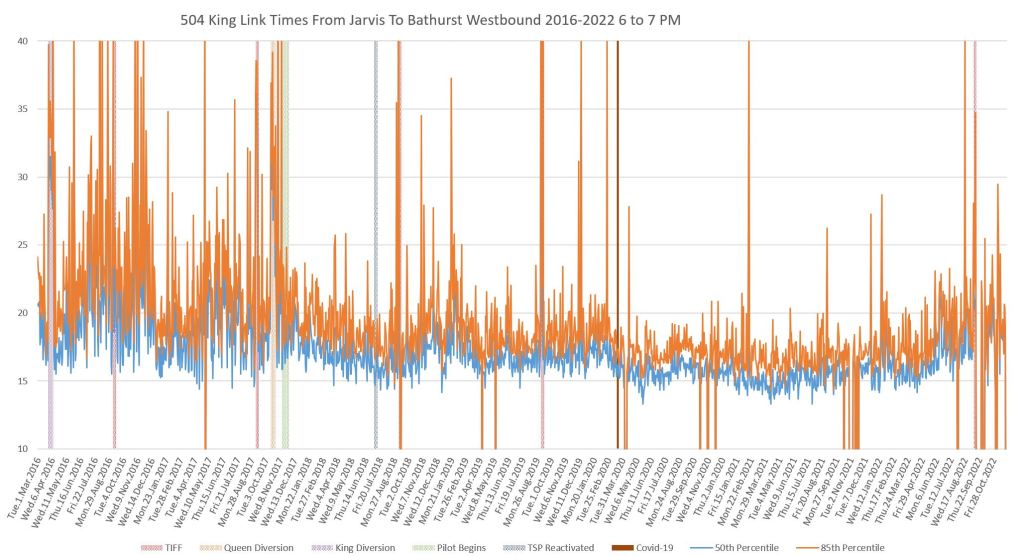
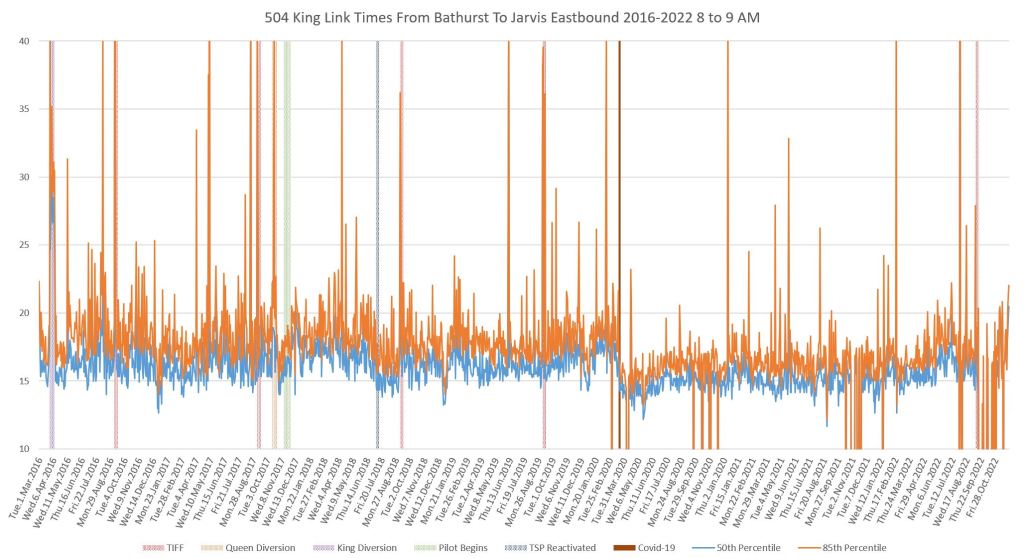
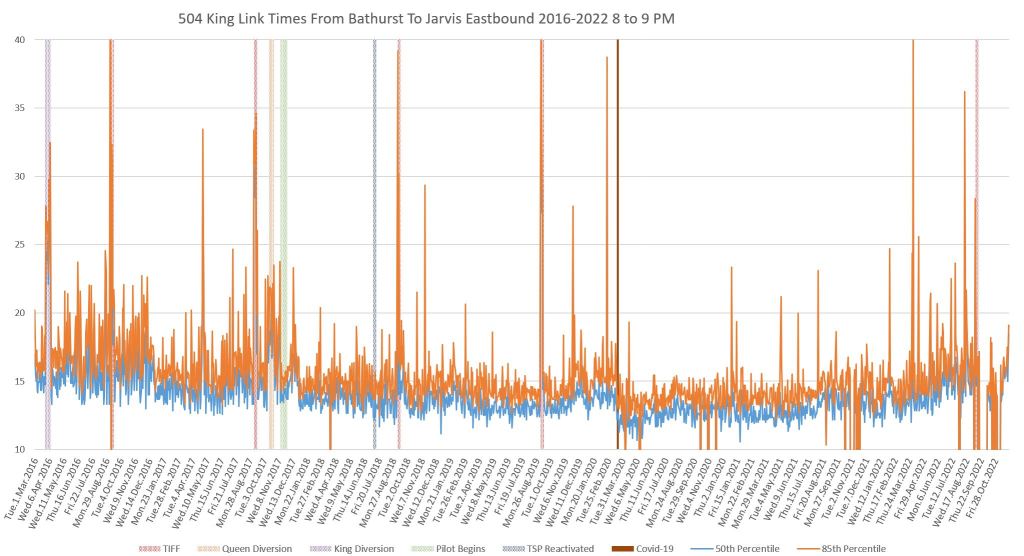
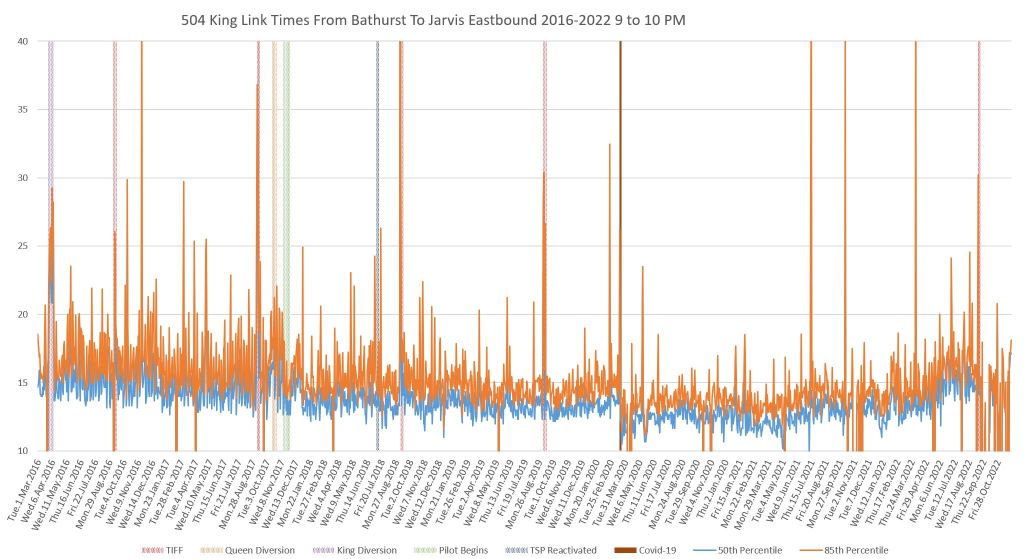
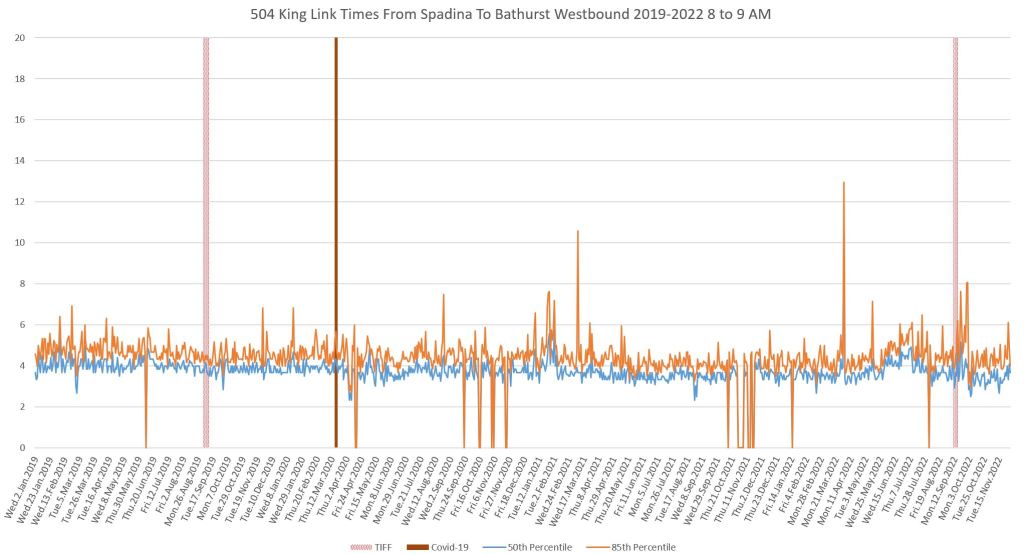
These charts show the travel times each way for vehicles between Jarvis and Bathurst on weekdays at various times of the day:
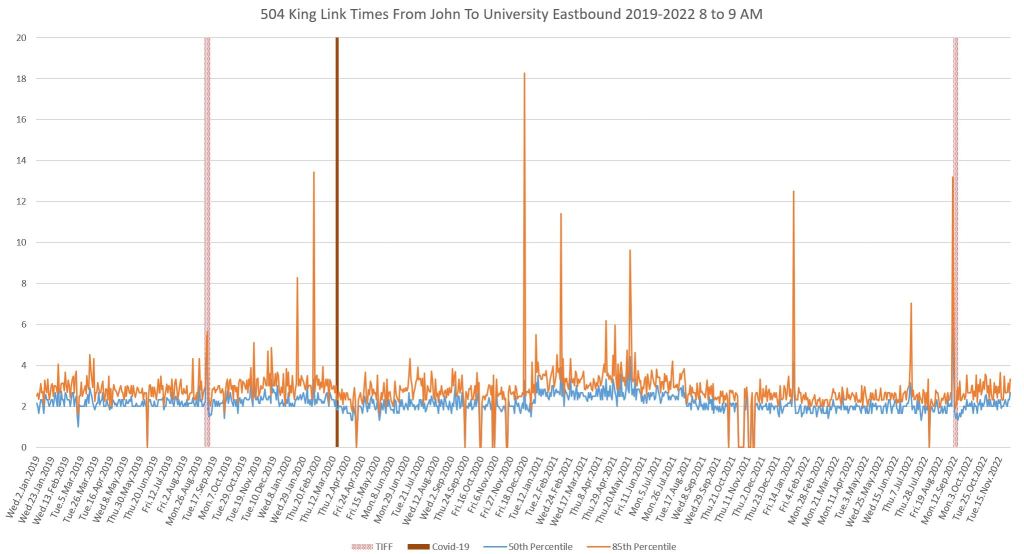
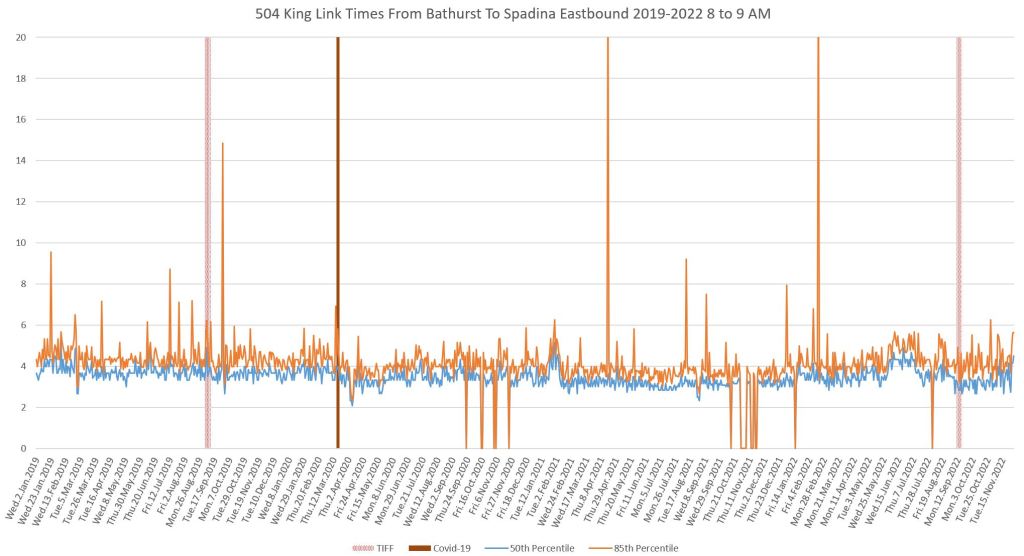
- 8 to 9am: AM peak period. This is a period where the transit priority scheme had little effect because the street was not congested before the plan went into effect. This was mistakenly cited by some critics as an example of the plan’s failure without looking at data from later periods in the day.
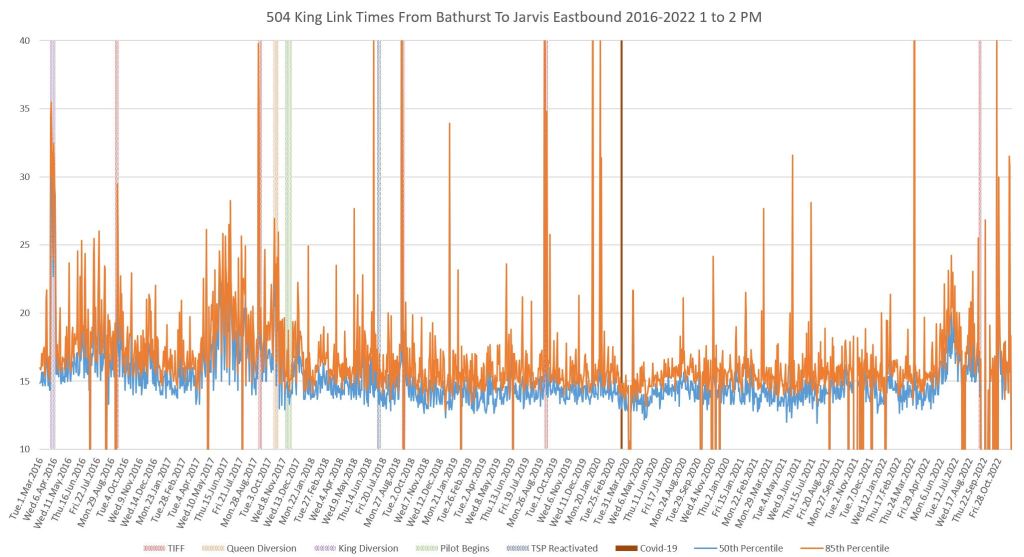
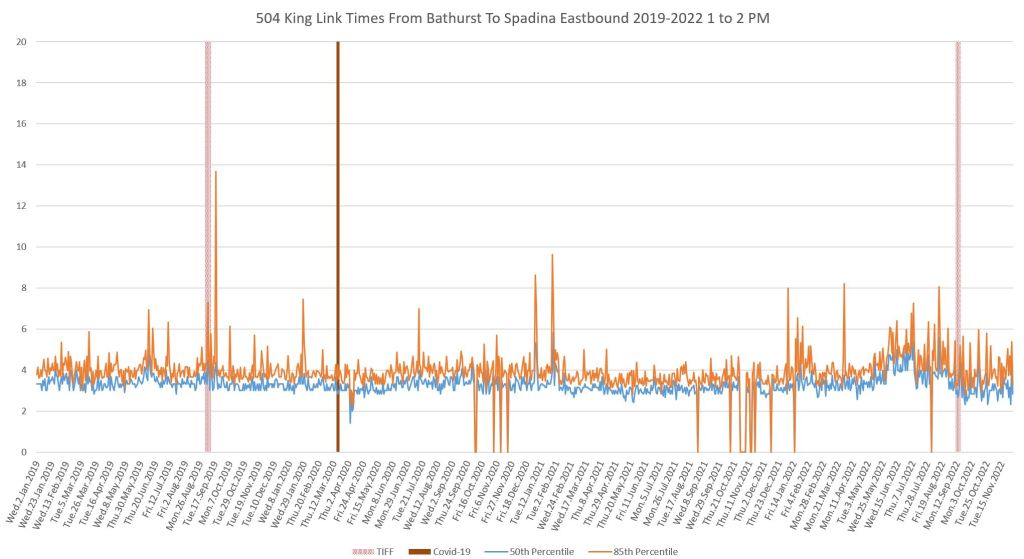
- 1 to 2pm: Midday. This is a period where traffic has built up somewhat, but conditions can be affected by theatre district activity on matinee days, and by sporting events which add to the downtown traffic load.
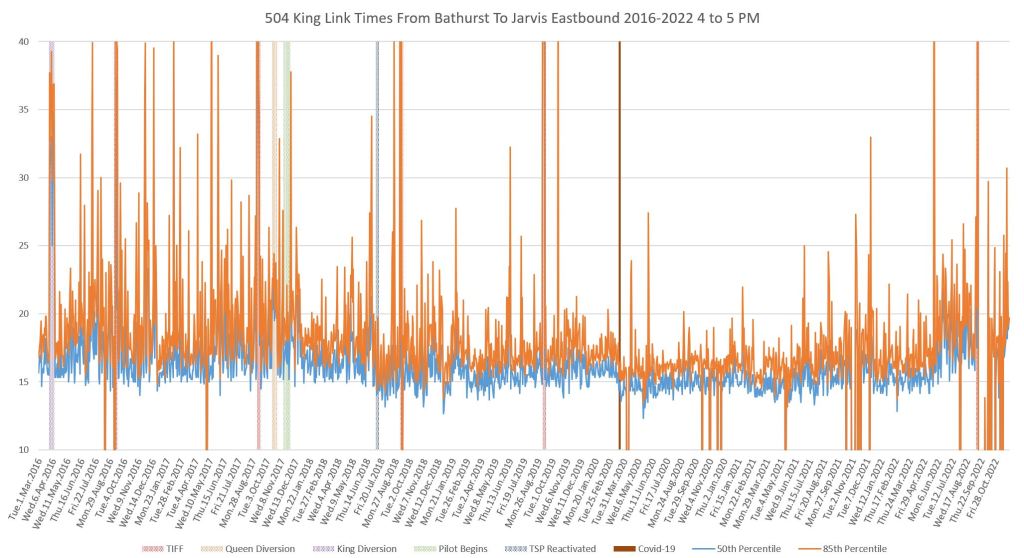
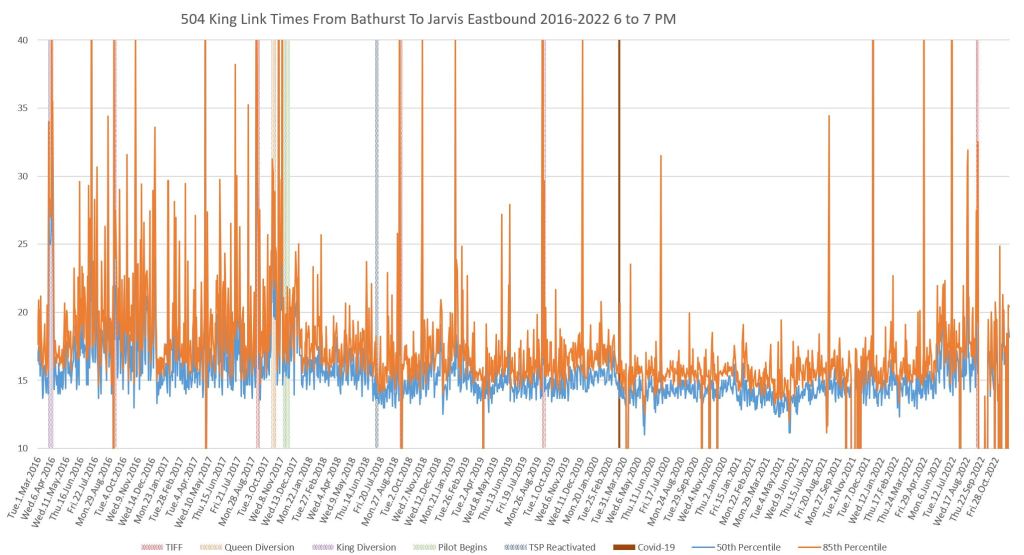
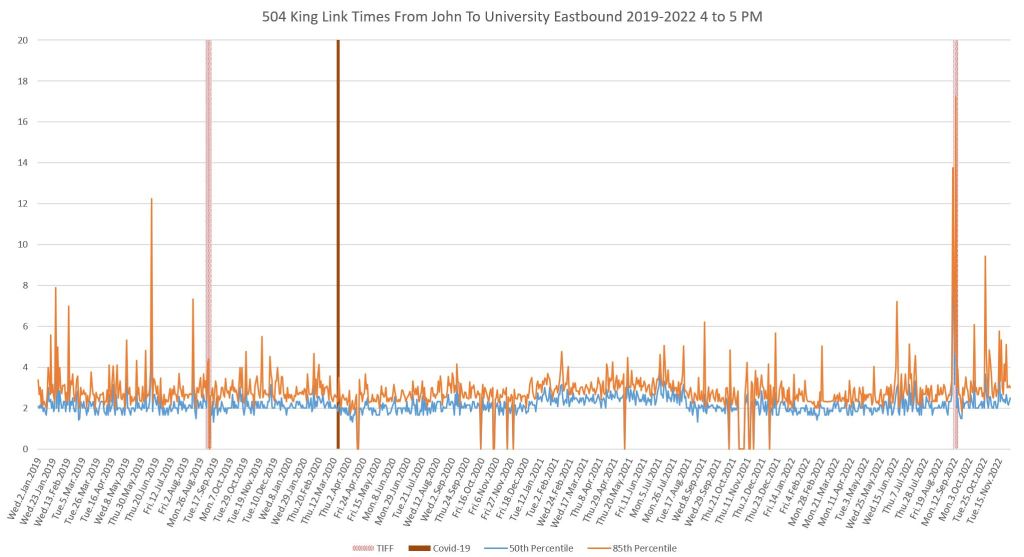
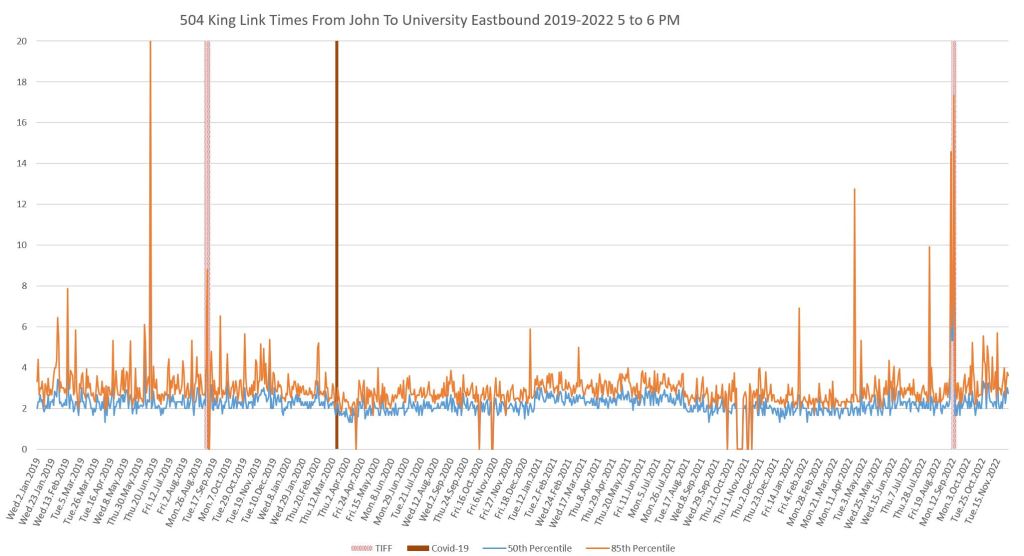
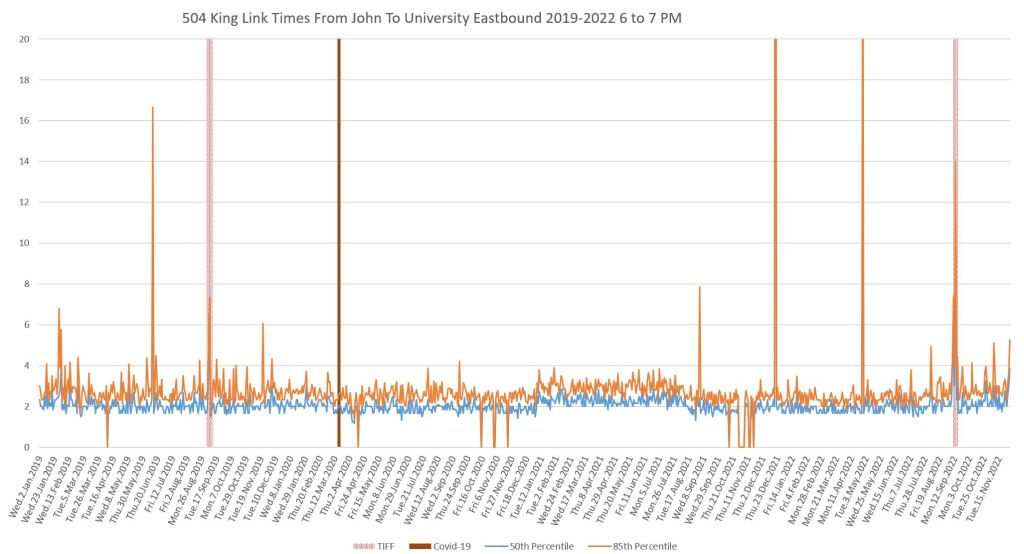
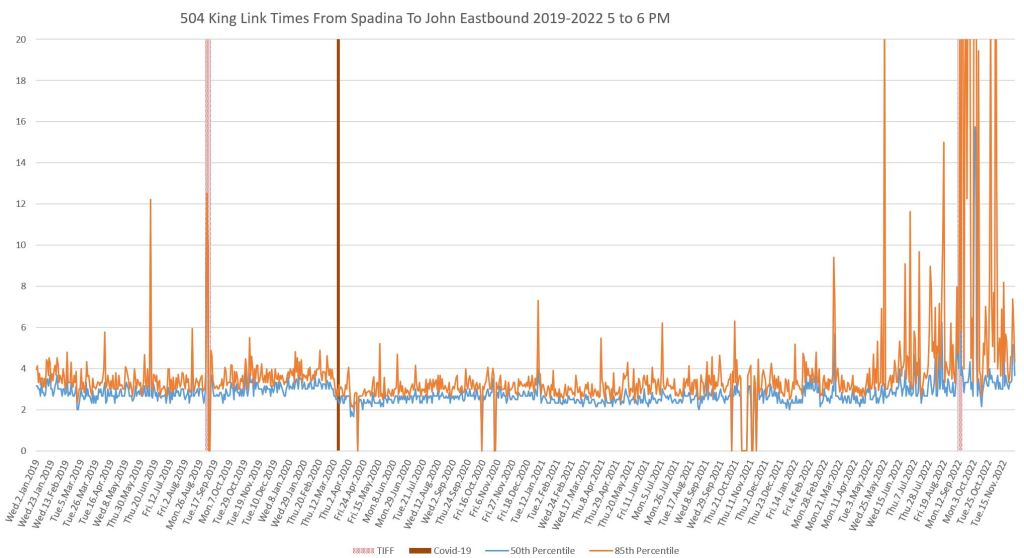
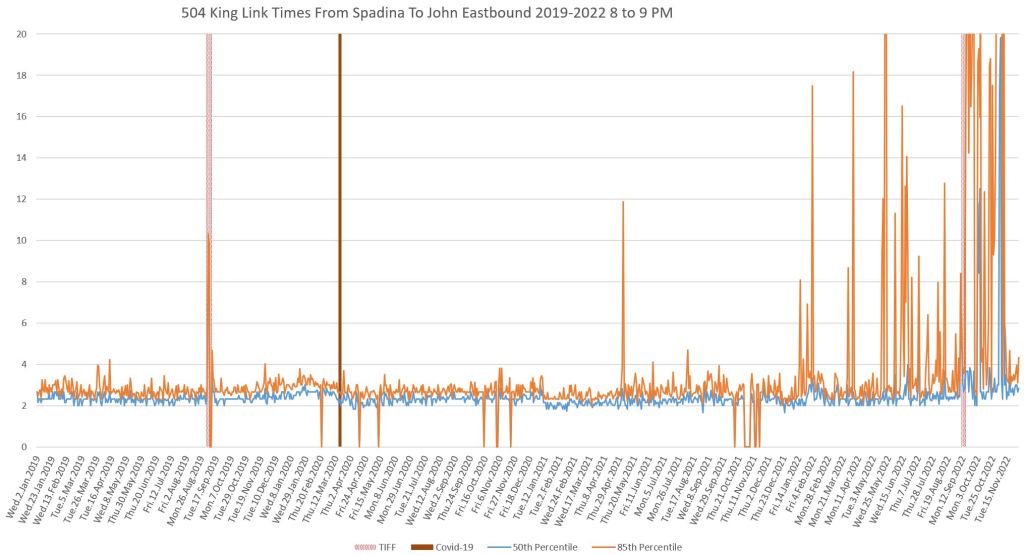
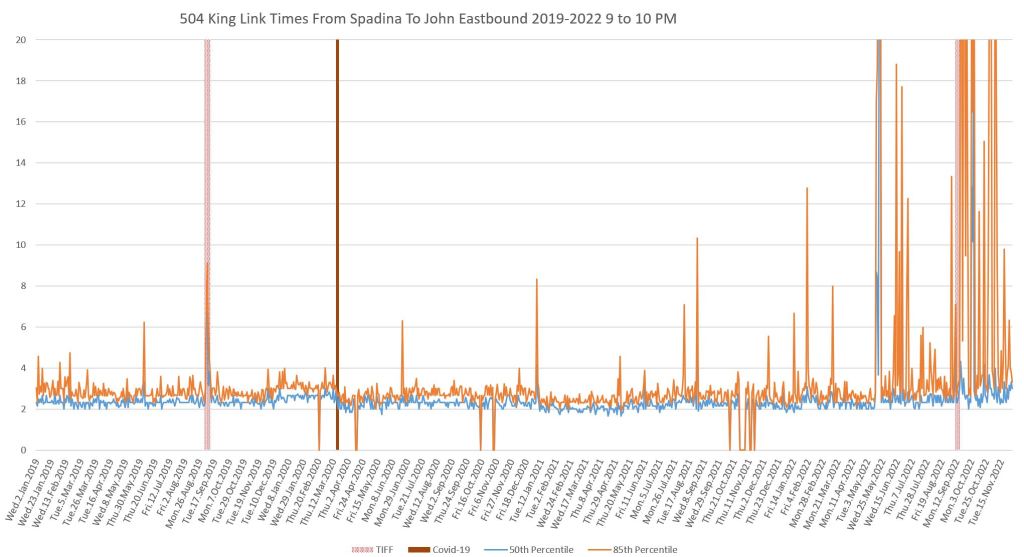
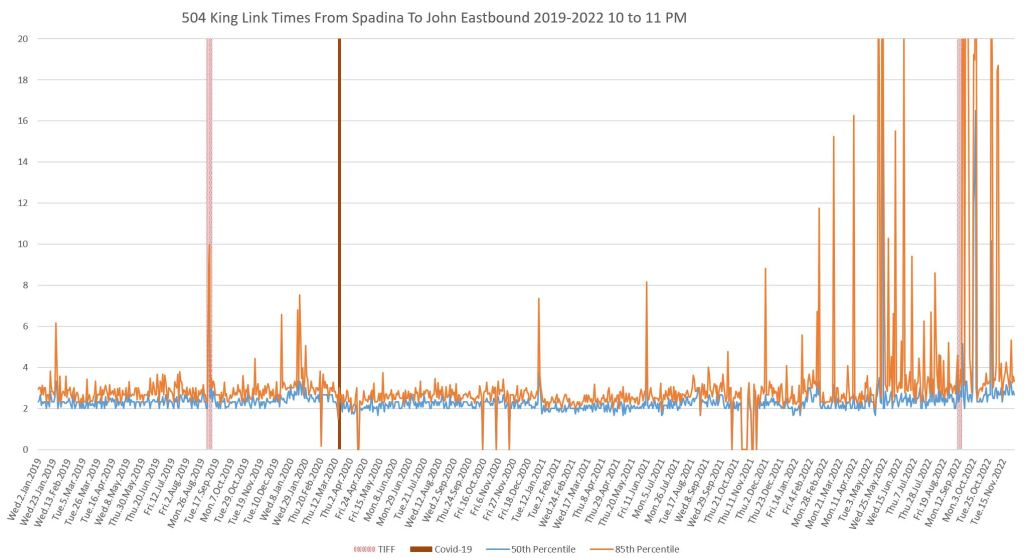
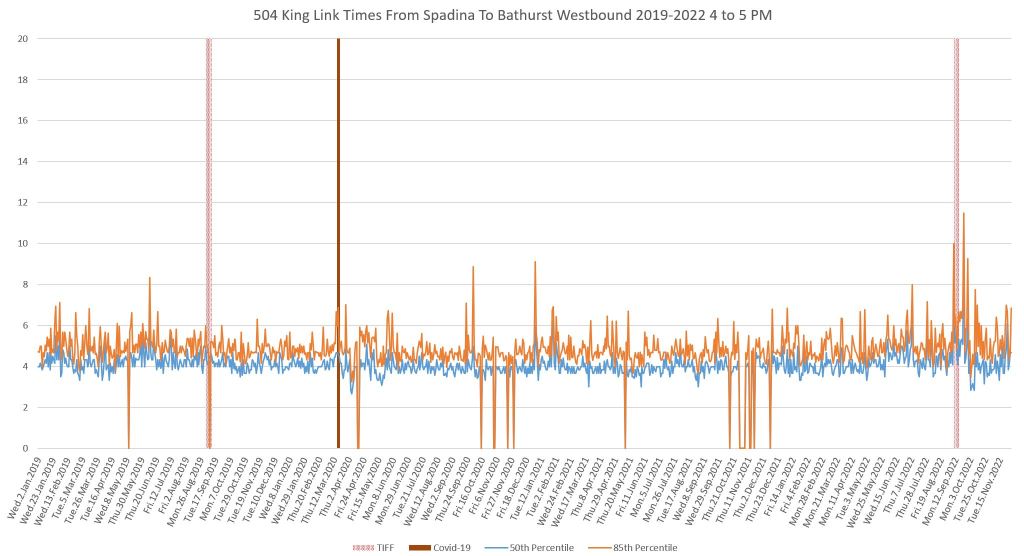
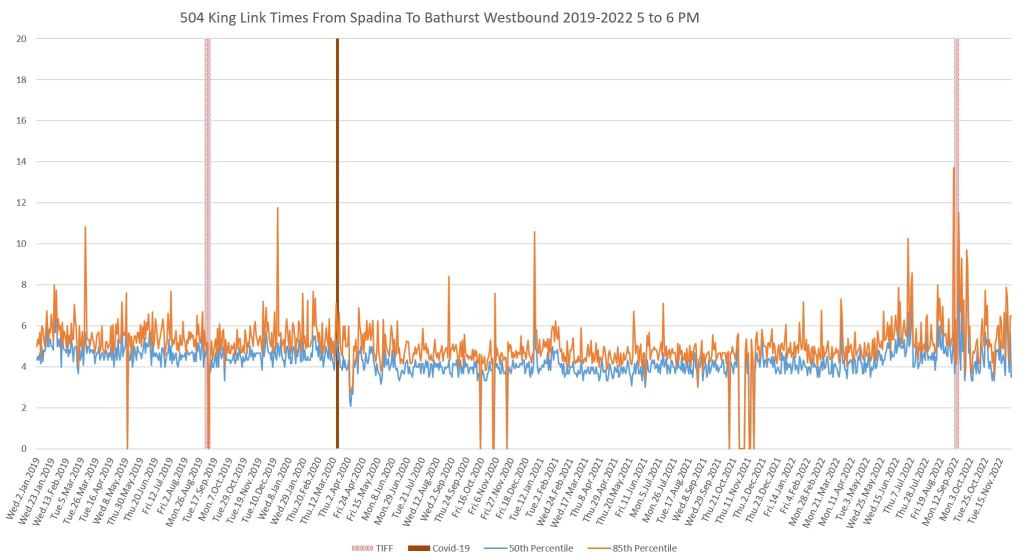
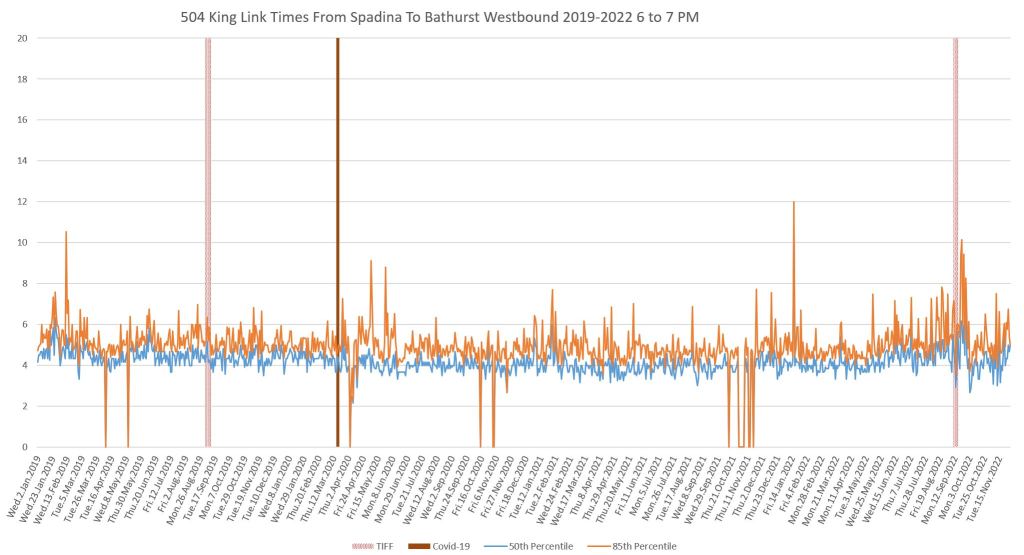
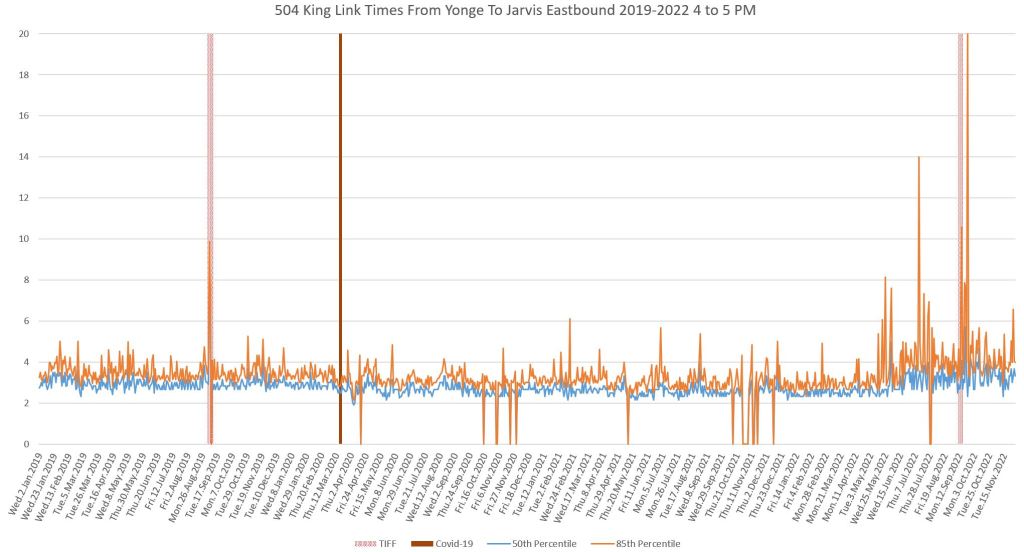
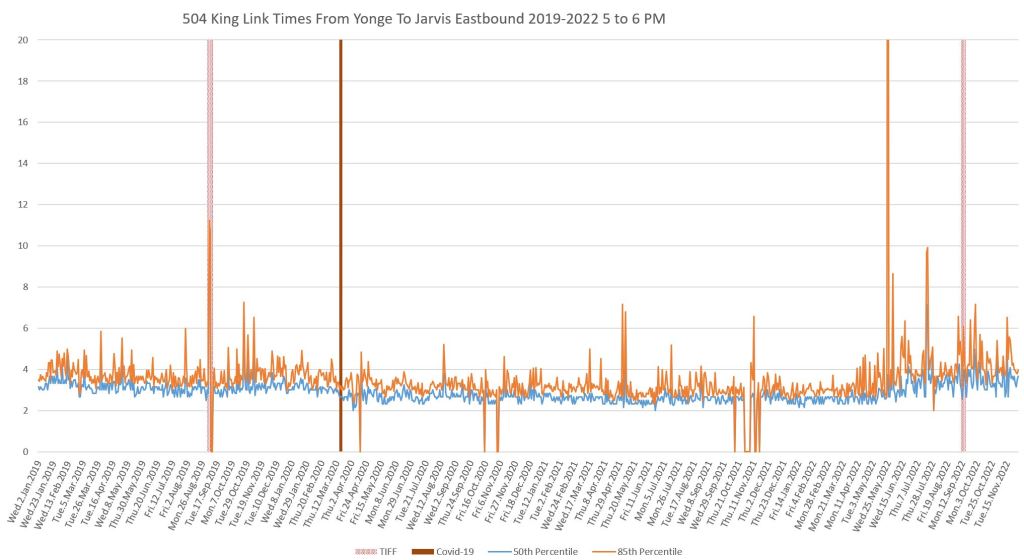
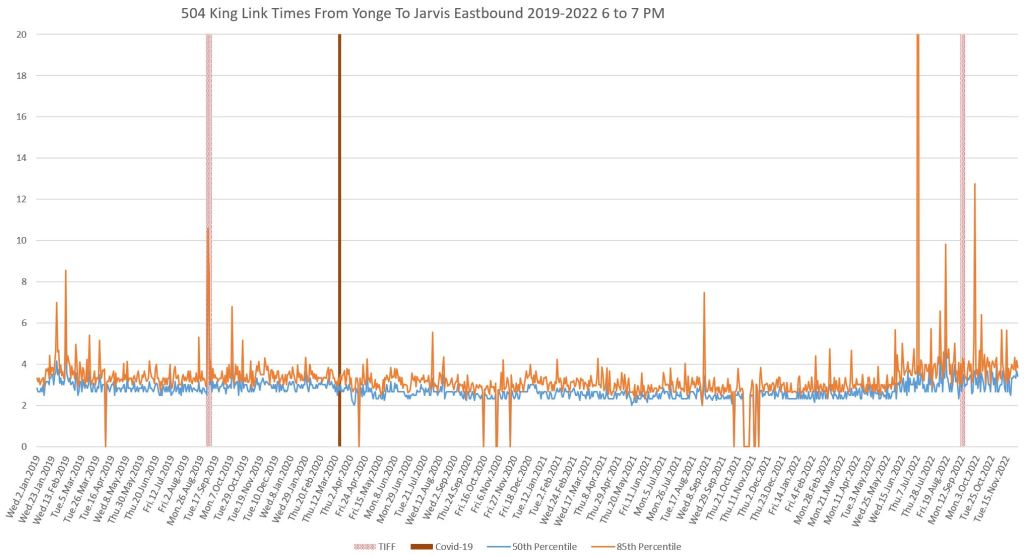
- 4 to 7pm, in three hour increments: PM peak period. These charts show the evolution of travel times through the peak.
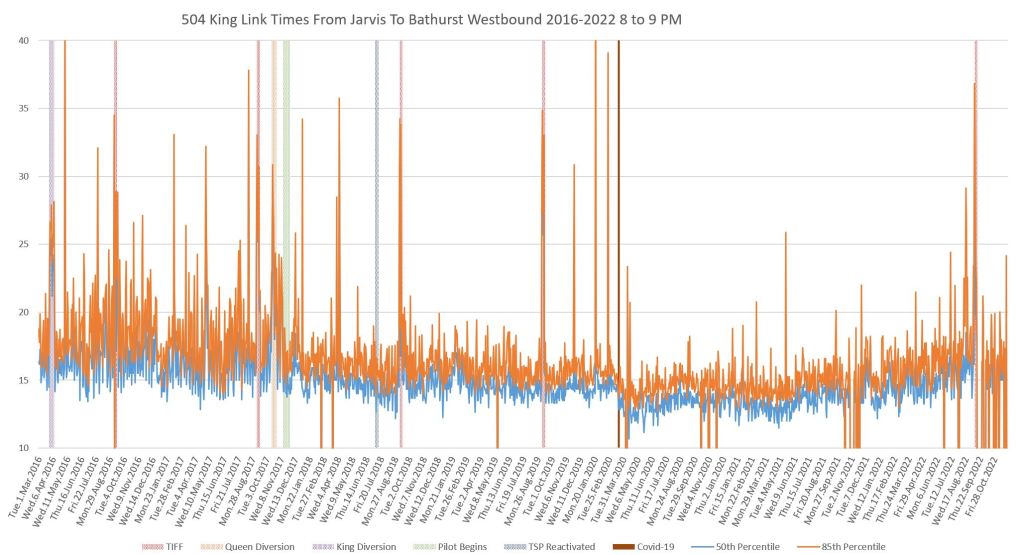
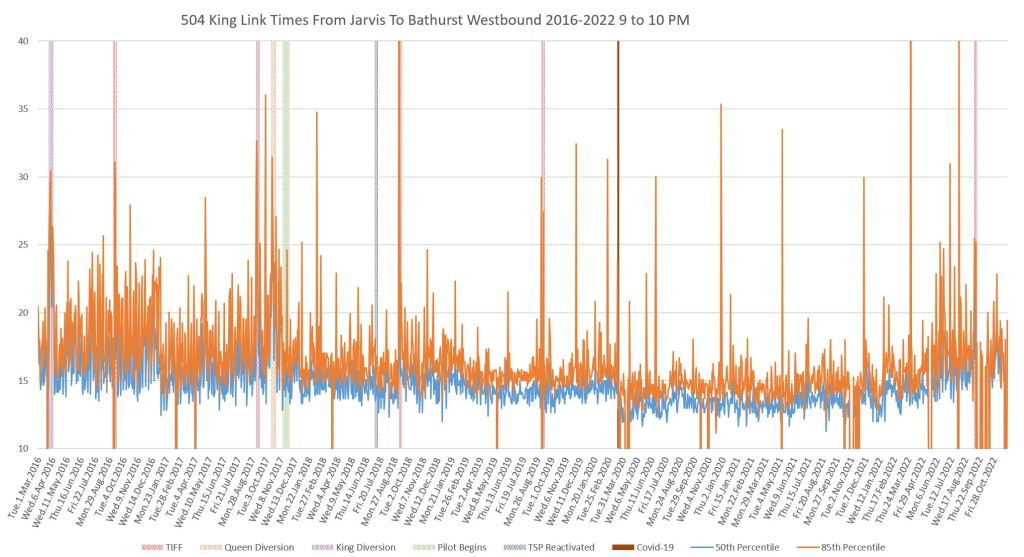
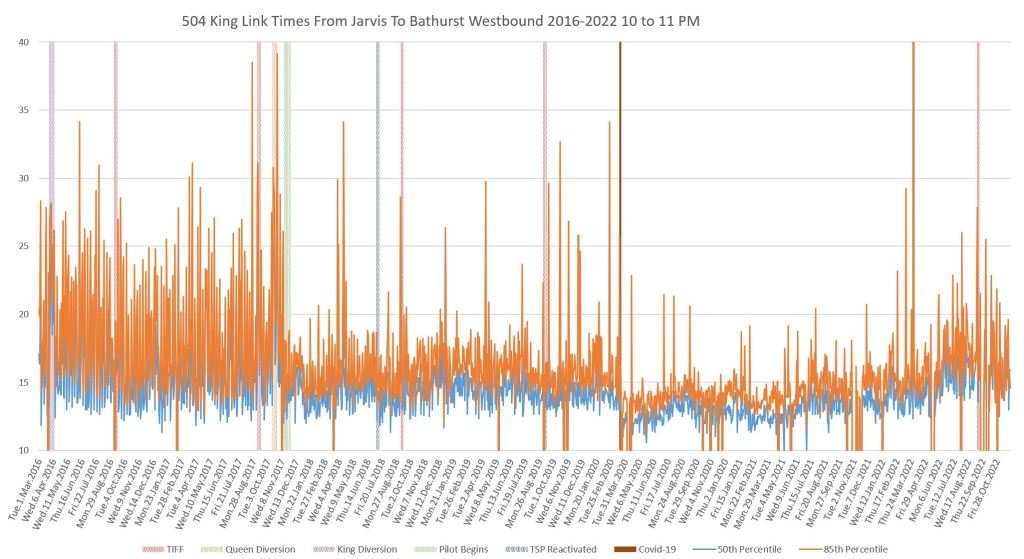
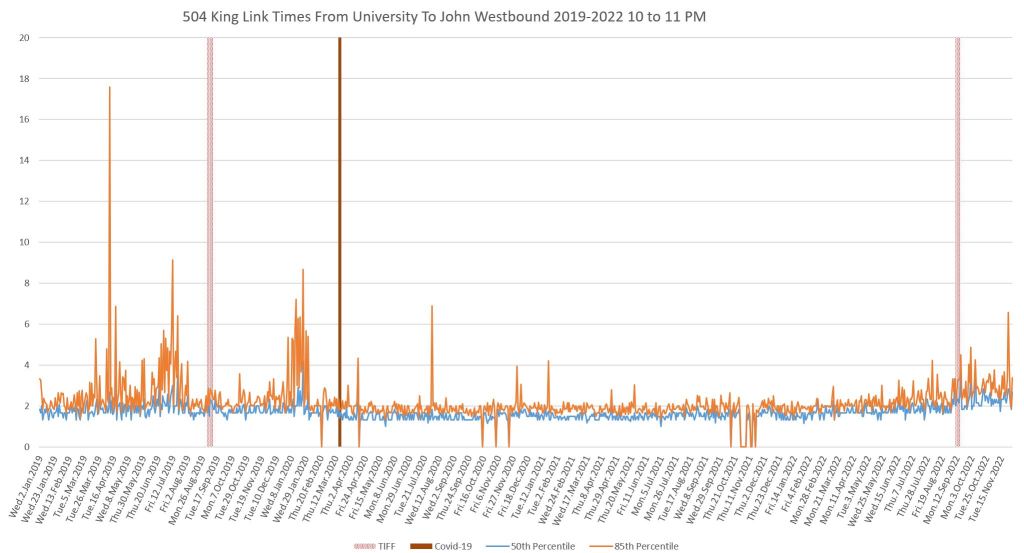
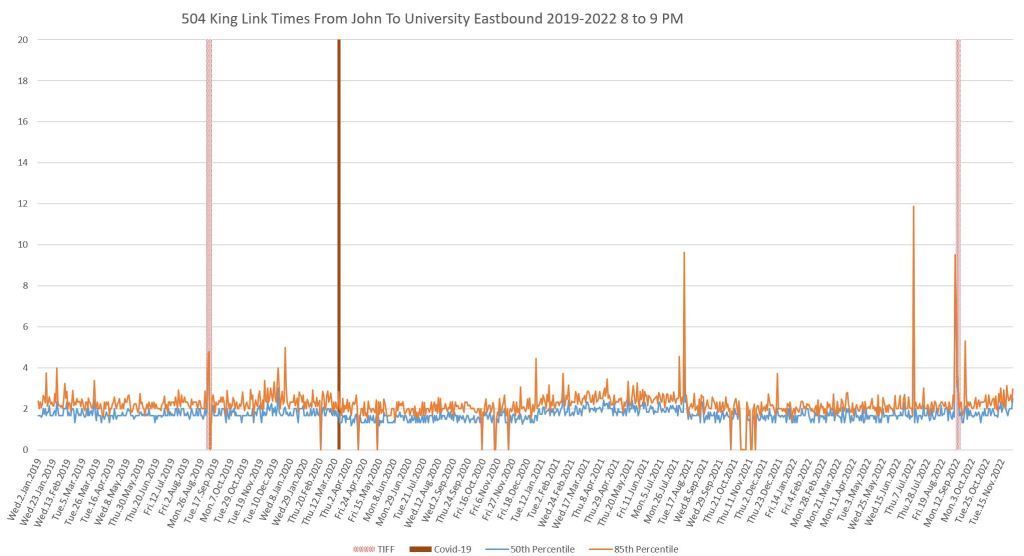
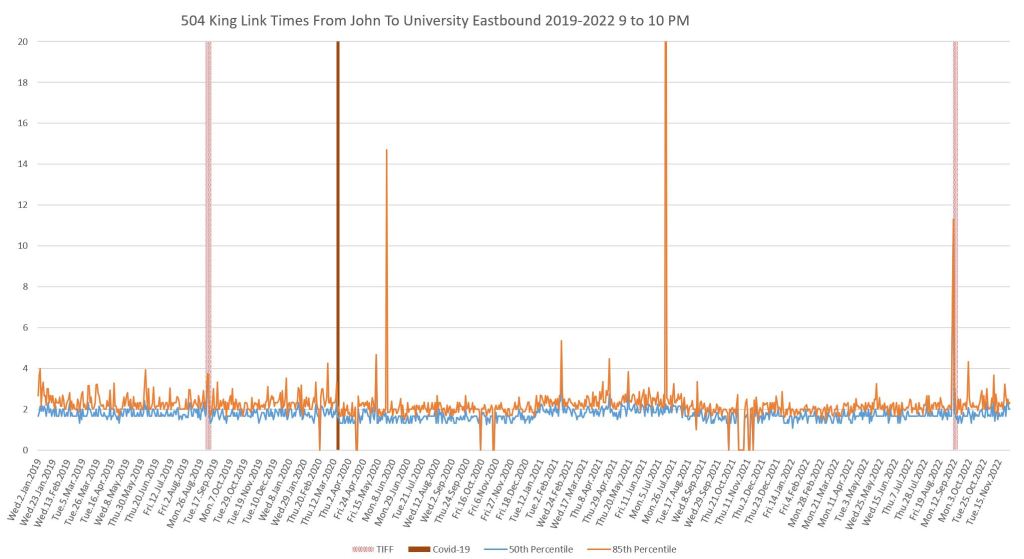
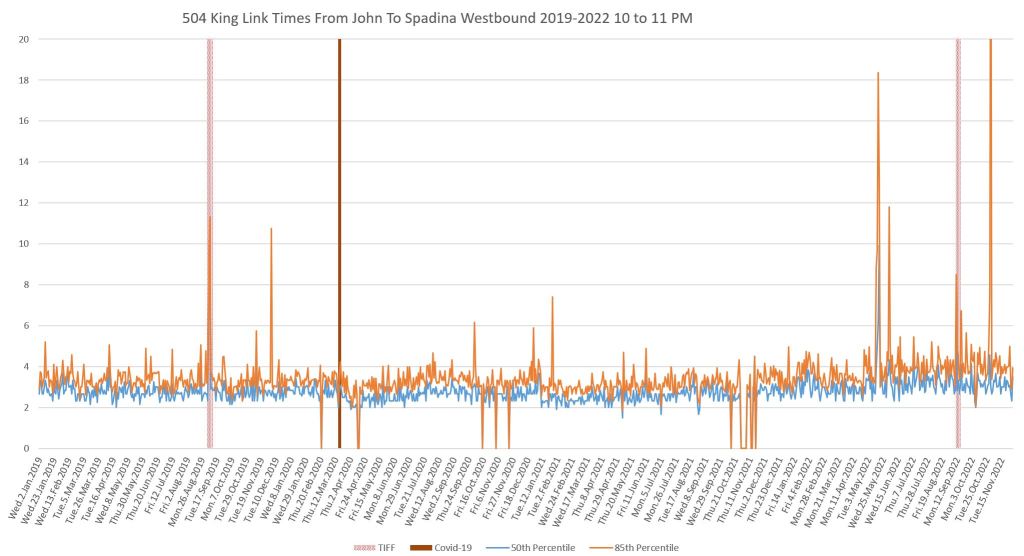
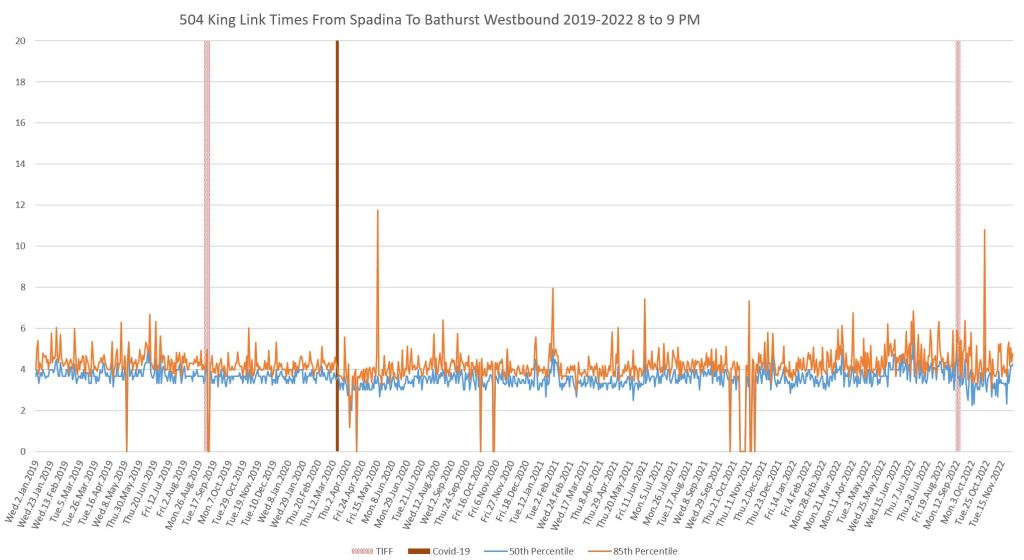
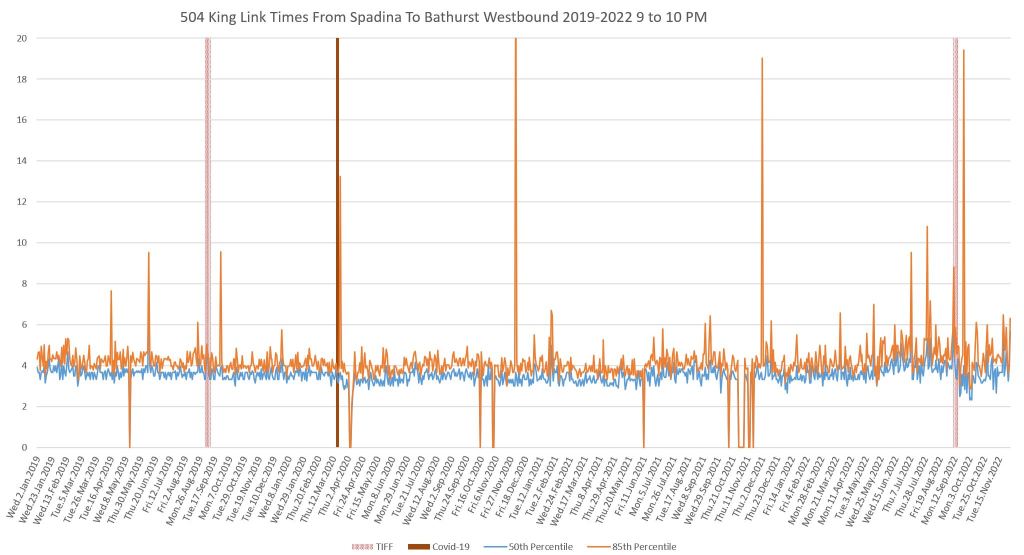
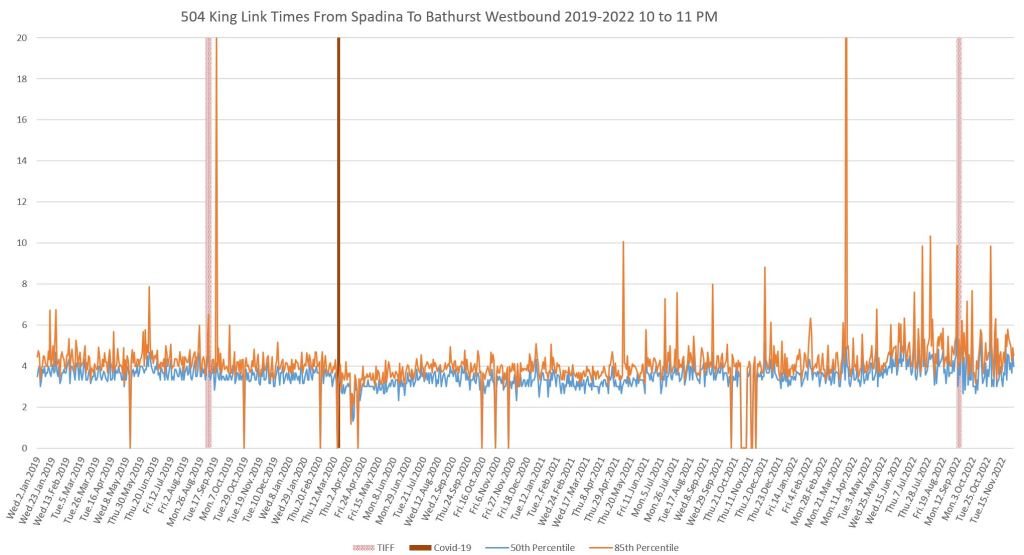
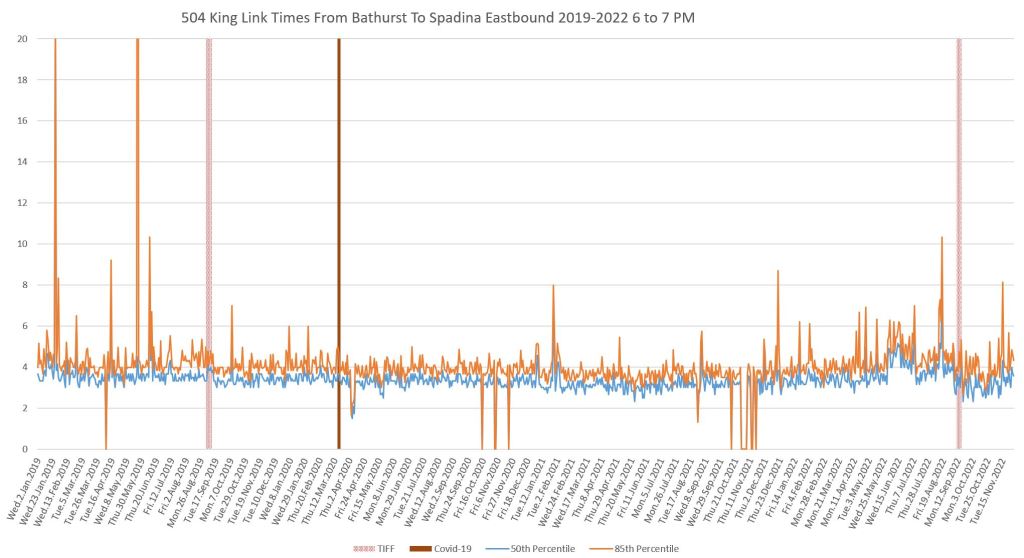
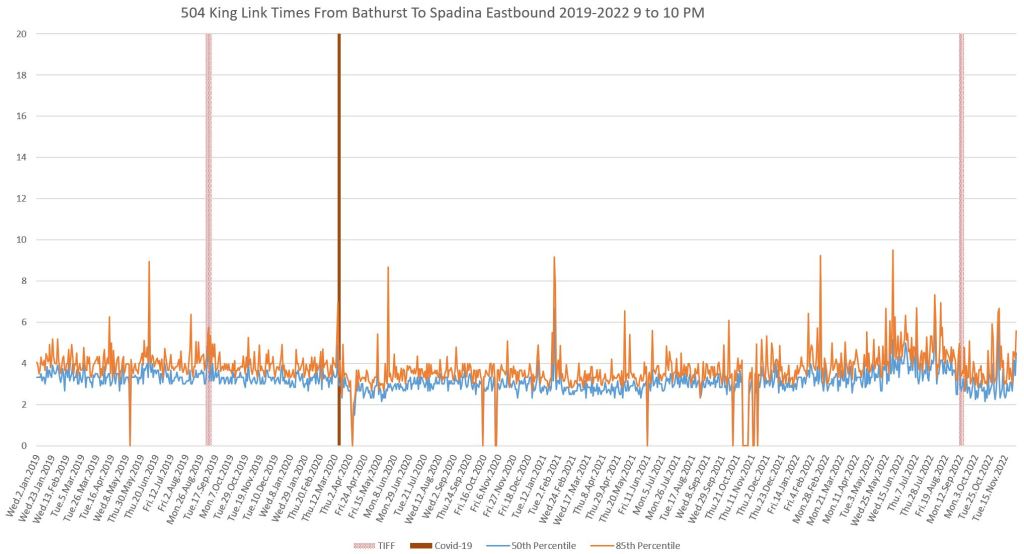
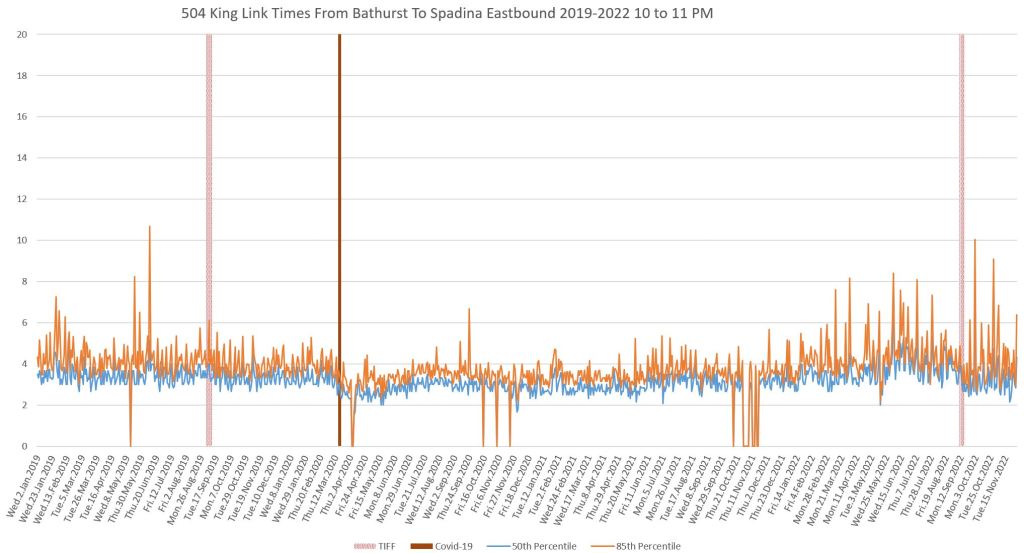
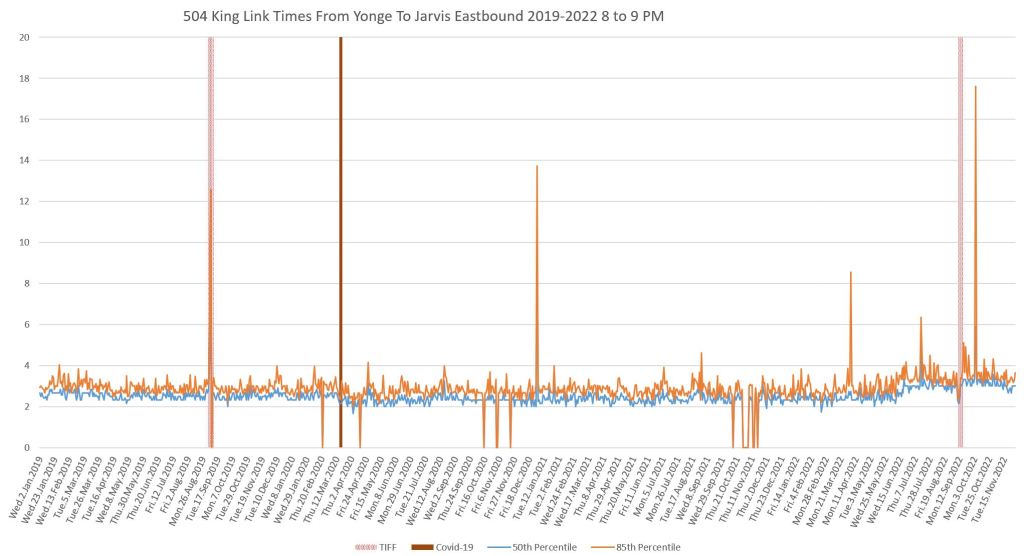
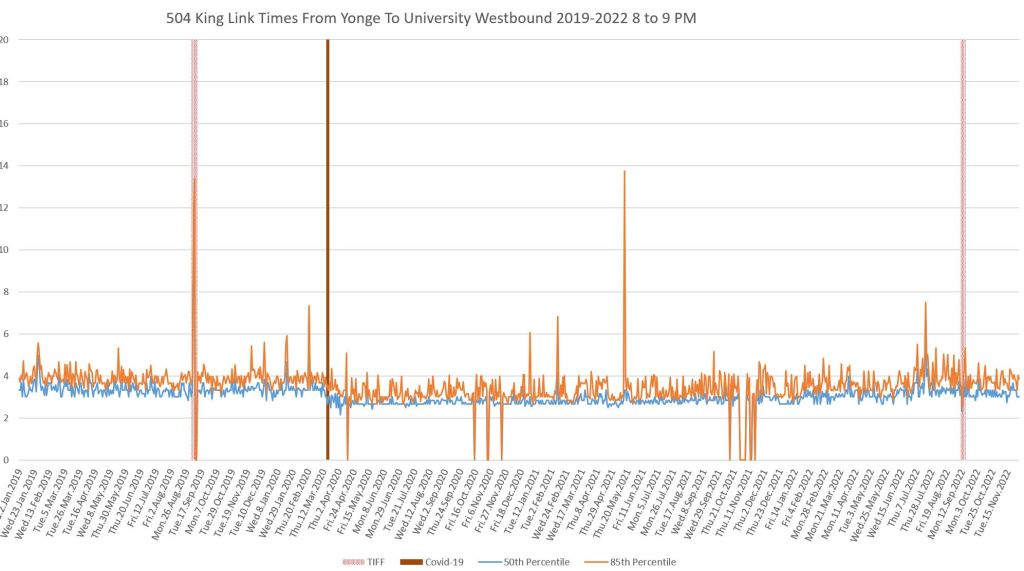
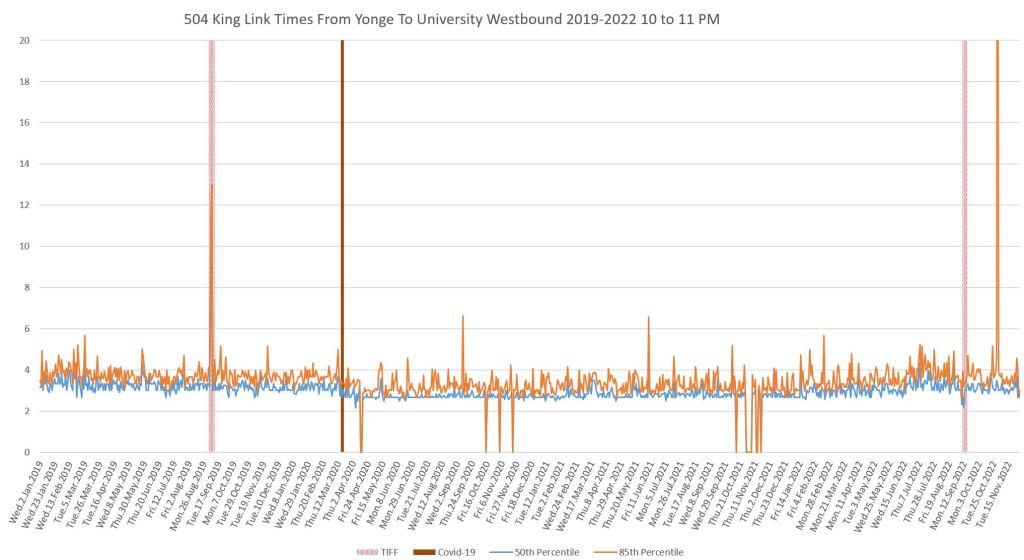
- 8 to 11pm, in three hour increments: Evening. Conditions during this period are affected by activity around the theatres and in the Entertainment District generally. In the period before the priority scheme, there are regular weekly spikes in travel times particularly after 10 pm corresponding almost entirely to Fridays with occasional interruptions for bad weather. (Note that the charts do not contain weekend data).
Another regular event that affects the King car is the Film Festival which either forces a diversion via Queen Street or presents both congestion and occasional blockages on King. This did not occur in 2020 and 2021 due to the pandemic.
In recent months, construction on Adelaide Street (water mains and new streetcar track) has spilled some eastbound traffic onto King Street. This work will cease for the winter and we will be able to gauge the effect of restoring Adelaide’s capacity when the January 2023 data are available.
As in all past articles, there are two lines on each chart:
- 50th percentile (blue): This shows the median value for travel times. Half of the trips were faster, and half were slower.
- 85th percentile (orange): This shows the close-to-peak values of travel times. About 1/7 (86th to 100th percentile) of trips took longer than this value, but this can represent a single trip because of the number of data points per hour in some periods.
In late 2022, there are several times where the values fall to zero. The reason for this is that during the King/Shaw reconstruction, many streetcars, sometimes all of them, turned back eastbound at Spadina even though at least some were to scheduled to operate to Bathurst Street. This meant that there are no Jarvis-Bathurst trips and no travel time measurements over the full span. Normal service was restored at King/Shaw in early December, and almost concurrently the loop via Charlotte Street at Spadina became unavailable due to construction. The effect of these changes should be visible once the December 2022 data are available.
An essential part of any review of King Street’s design and behaviour must include recognition of its very different character by location, day of the week and time of day.
Westbound
The first two charts with the 8am and 1pm data show some changes from period to period, but are fairly flat. There is only a small rise in travel times in the latter part of 2022. However, for later periods in the day, both during the PM peak and through the evening, the change in the data for each major era is quite visible including the recent increases in travel times. They have return to and in some cases exceeded the pre-pandemic era, but are also pushing into the pre-transit priority territory as well.
An important difference between the pre- and post-transit priority eras is that the variation in values, notably the peaks shown by the 85th percentile line, were in most cases lopped off by the priority scheme, and this improved service reliability over the entire route. There appears to be some return of these peaks since summer 2022, although they are not yet as consistently bad as in 2016-17. This is a problem that must be addressed lest the street completely lose any benefit from the priority scheme.
The charts can be viewed full size in a scrollable gallery by clicking on any image.
Eastbound
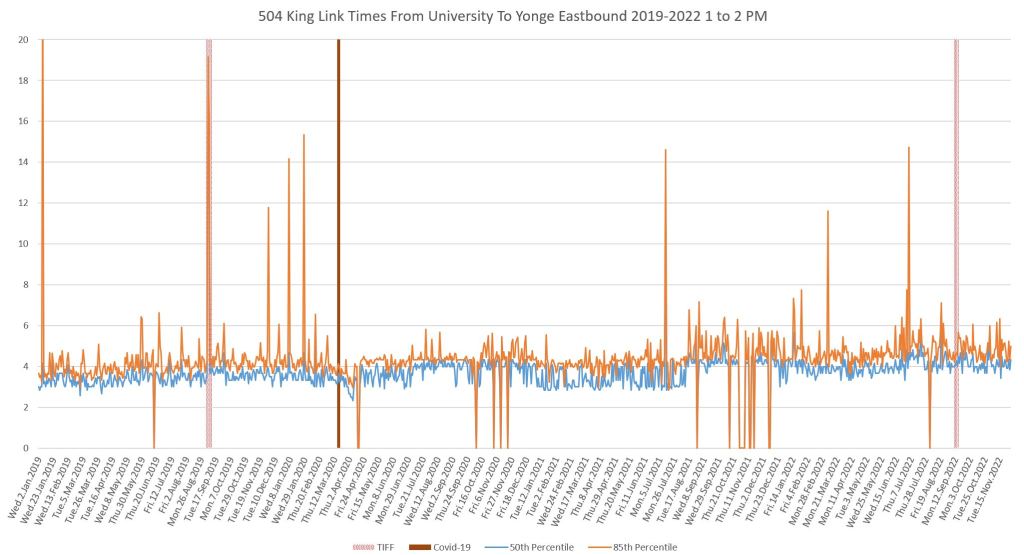
The eastbound data behave similarly to westbound with an important difference: in the pre-transit priority era, the evening congestion was not as bad as westbound because the primary traffic flow for theatres and clubs ran more to the west than the east. Whether this continues to be the case in 2023 remains to be seen.


Data for Segments of the Transit Priority Area
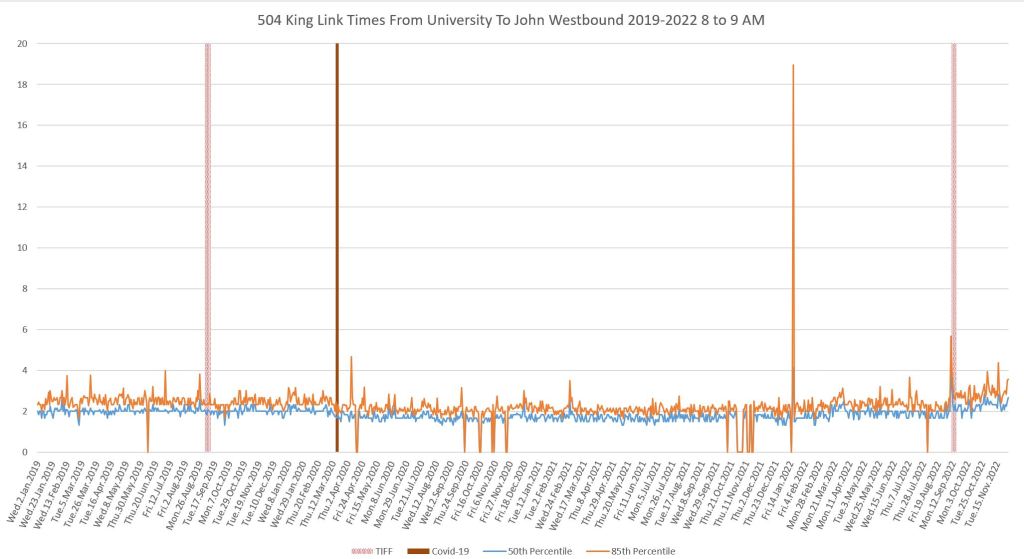
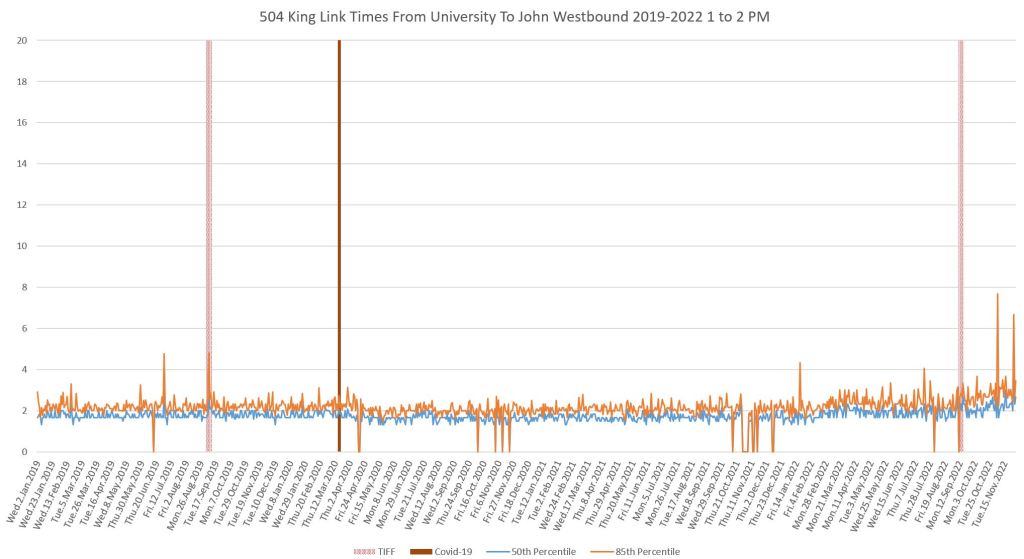
The charts in this section differ from the ones above on two counts:
- The vertical axis of the charts runs from 0 to 20 minutes rather than 10 to 40 in the preceding charts in recognition of the shorter travel times over these segments.
- The data are shown only from January 2016 onward.
In the three segments, the amount of change is small, particularly in the median values as opposed to the 85th percentiles. However, the combined effect of the small changes shows up in the charts for the entire span from Jarvis to Bathurst as each segment makes its own small contribution.
Note that data for these segments includes buses operating on the 504C King West shuttle during the period when it came east to University Avenue from September 2022 onward.
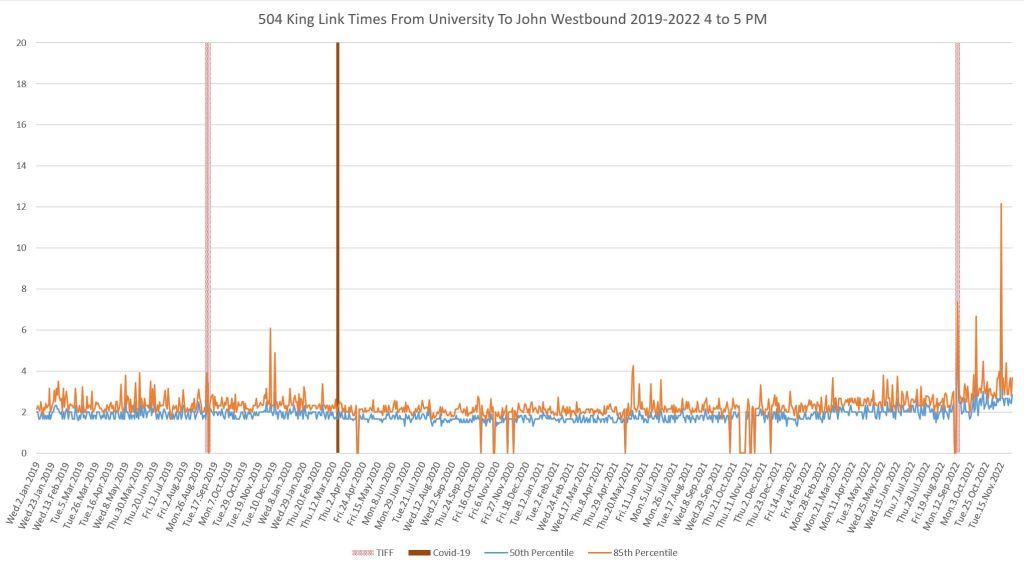
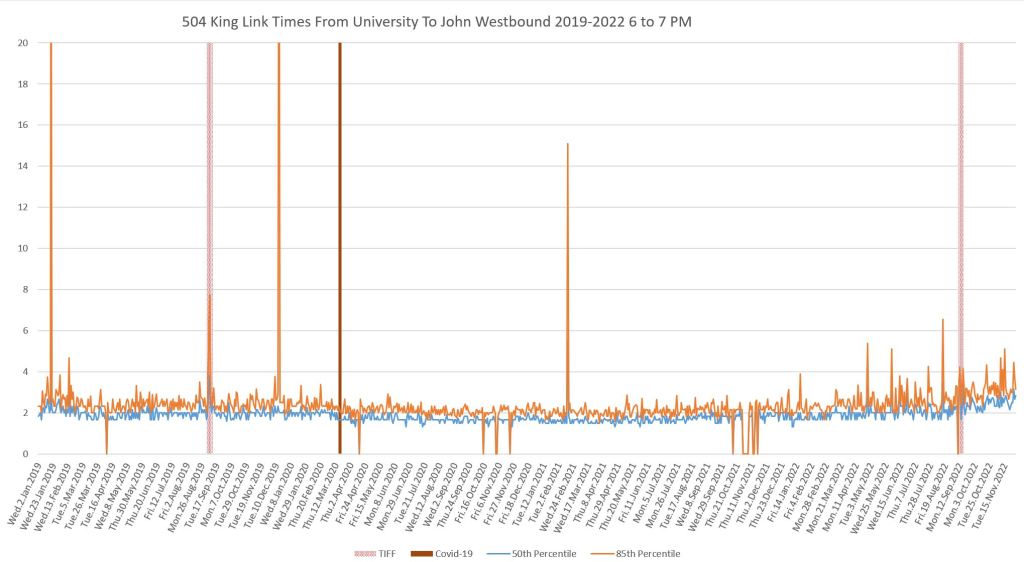
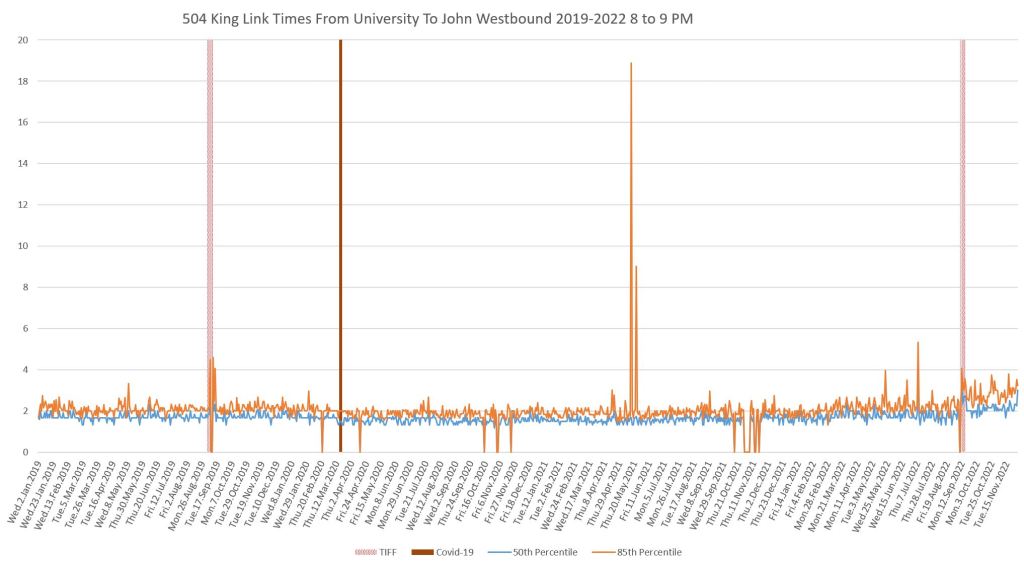
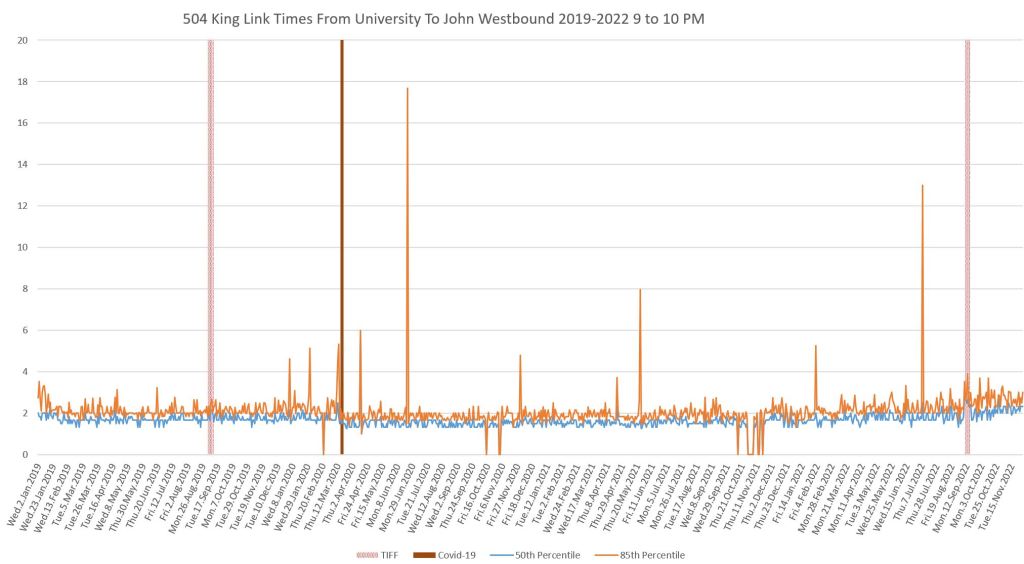
University to John
Westbound
This has been a fairly quiet part of the route for much of the day although in pre-pandemic times, it could be affected by congestion as the entrance to the club district. This pattern has not returned.
In December 2022, the curb lane was occupied for condo construction (the Mirvish/Gehry towers) for part of this segment. The effect of losing this traffic lane remains to be seen as much of King has been constrained by CafeTO installations already.

Eastbound
This is an uneventful area eastbound because the primary generators of congestion are on the north side of the street.


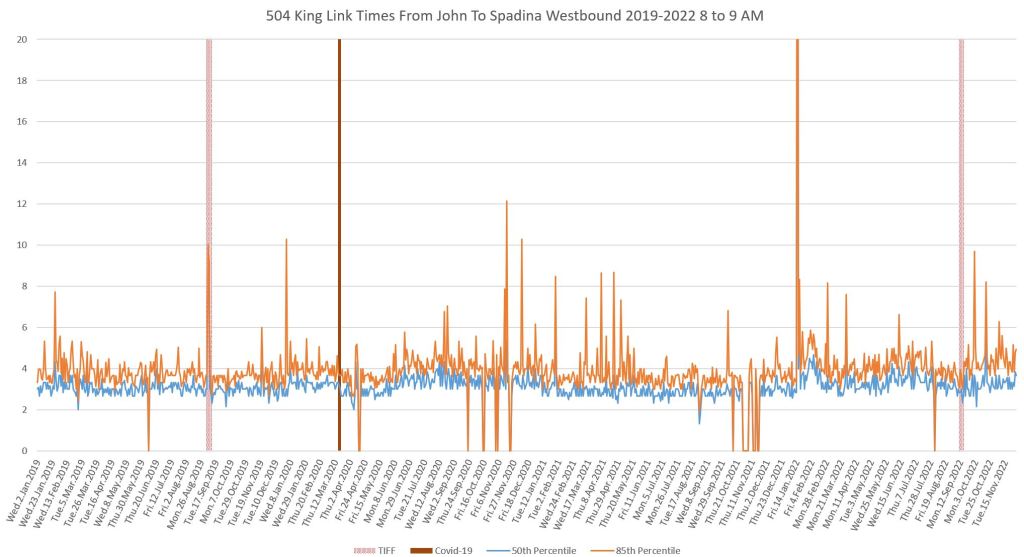
John to Spadina
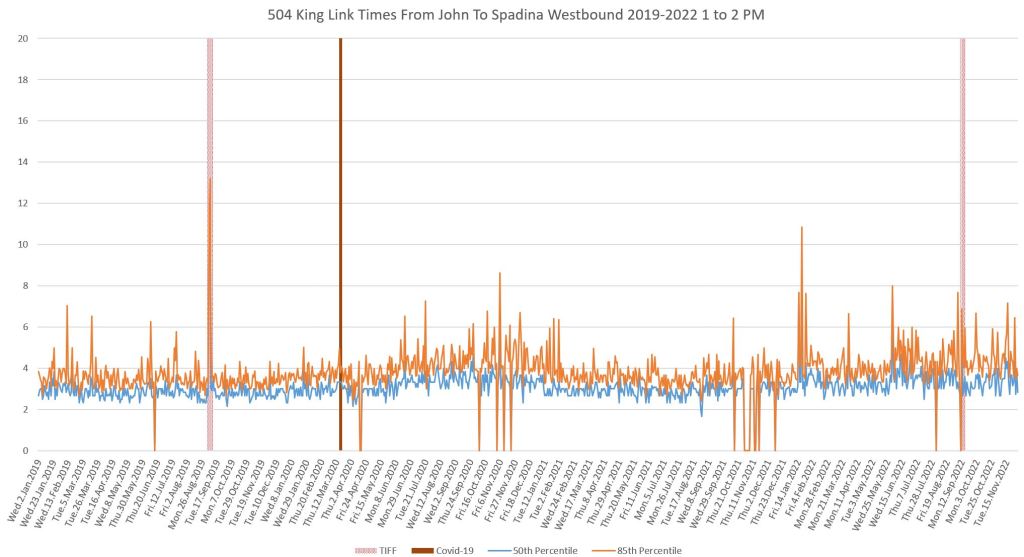
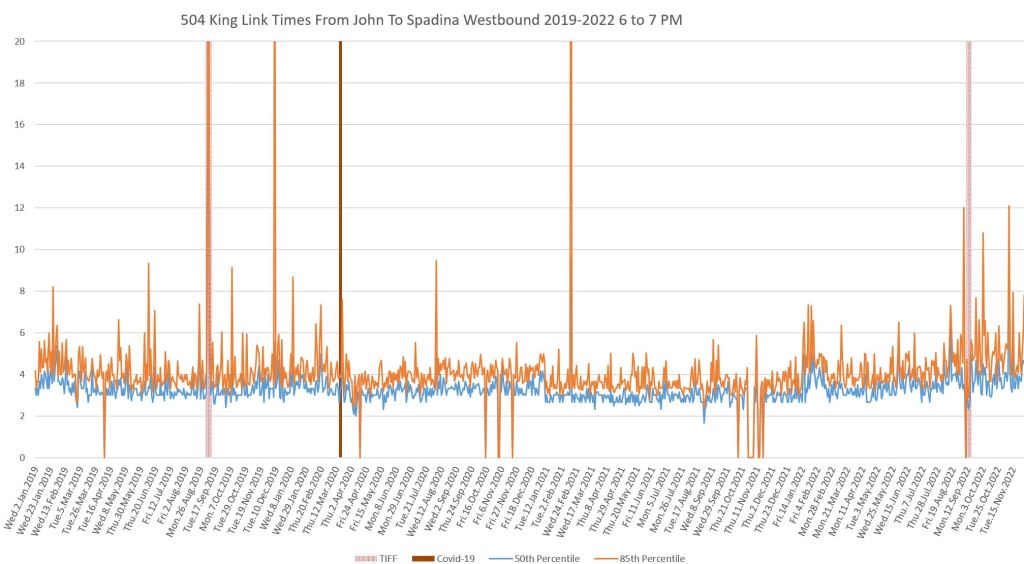
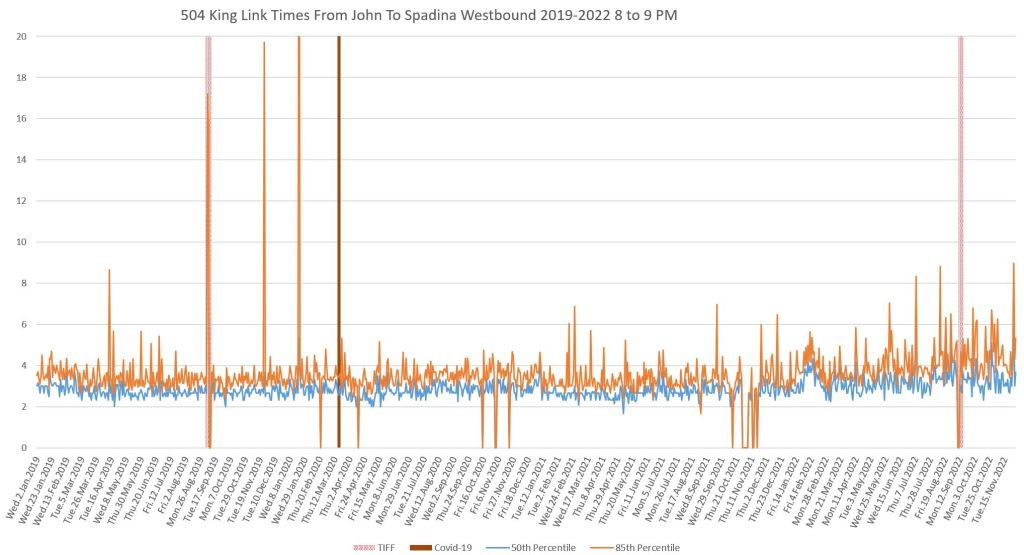
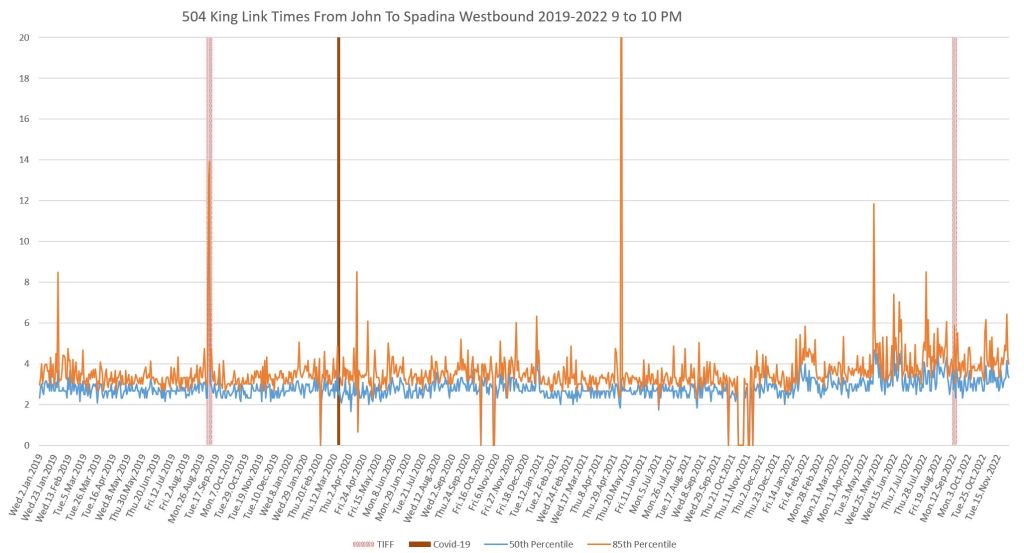
Westbound
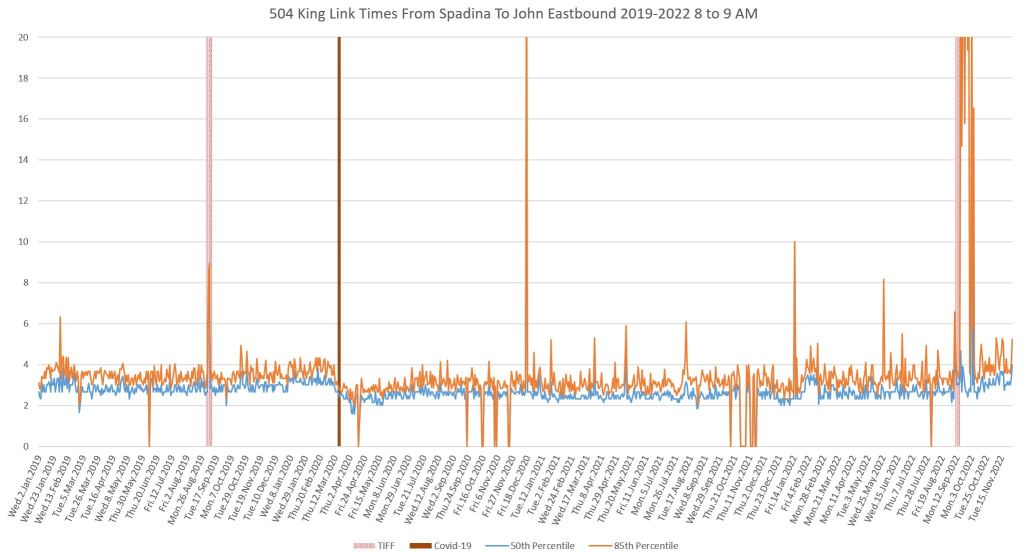
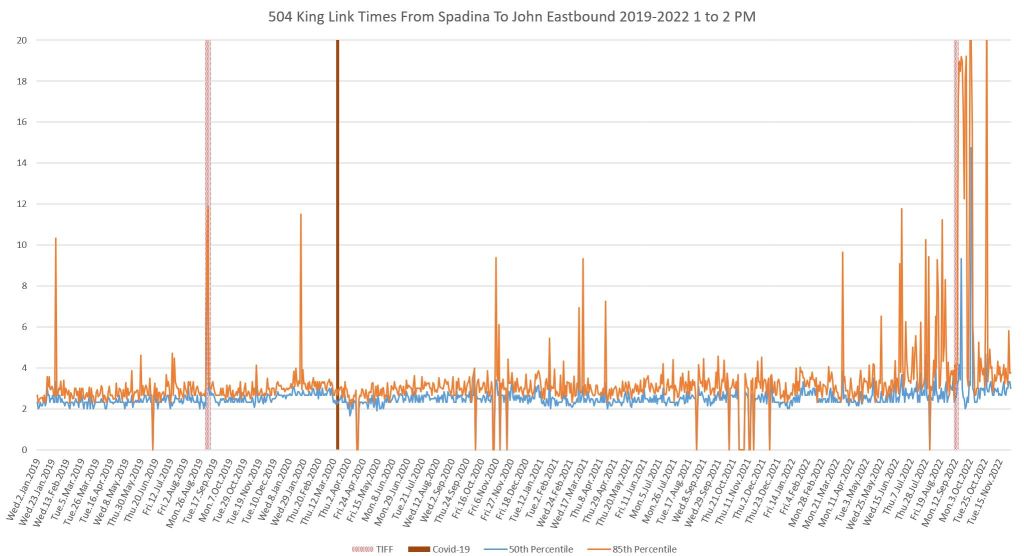
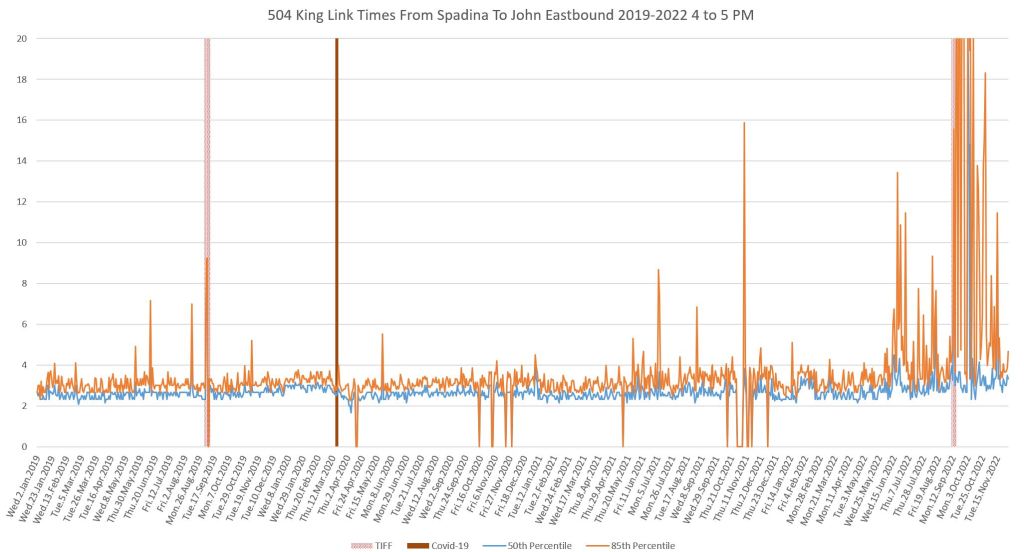
Between John and Spadina, travel times have started to build in fall 2022, but moreso in the 85th percentile (orange) than in the median (blue). This implies that the consistency of travel is worsening with occasional long trips pushing up the 85th percentile.


Eastbound
Eastbound data for this segment in fall 2022 are clouded by the number of short turns westbound at Spadina which included very long layovers in Charlotte Loop. The 85th percentile is very high, but the median is hardly affected. This pattern should end in December 2022 when Charlotte Loop was no longer available.
Note that this problem does not affect the charts for the full Bathurst-to-Jarvis travel times as cars that short turned at Spadina are not included there.

Spadina to Bathurst
Travel times have been rising in the afternoon peak and late evening, but as with the segment east of Spadina, this shows up more in higher 85th percentiles than medians in some cases indicating more scatter in travel times. Medians rose through the summer but have now fallen back to earlier levels.
Westbound

Eastbound


Update: Segments Between Jarvis and University Added
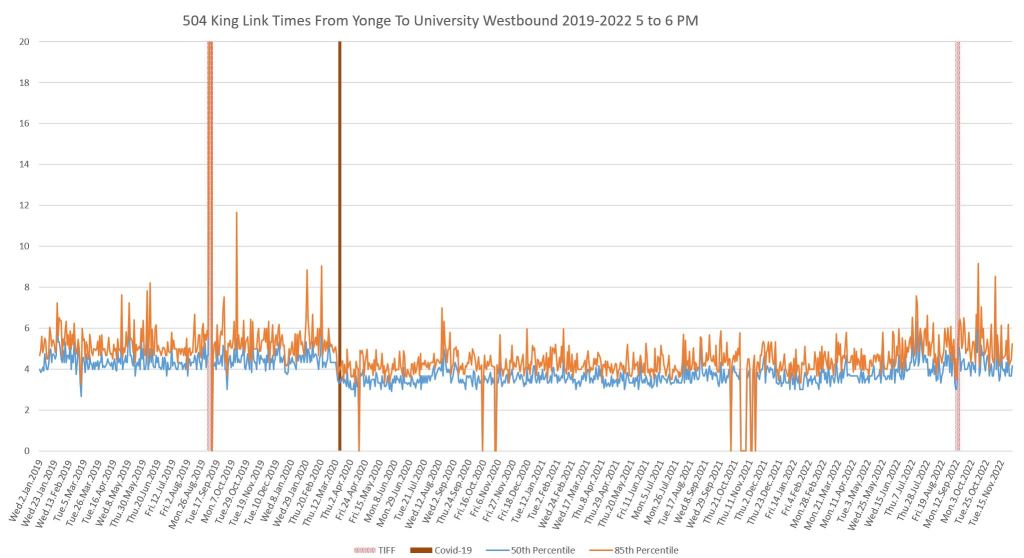
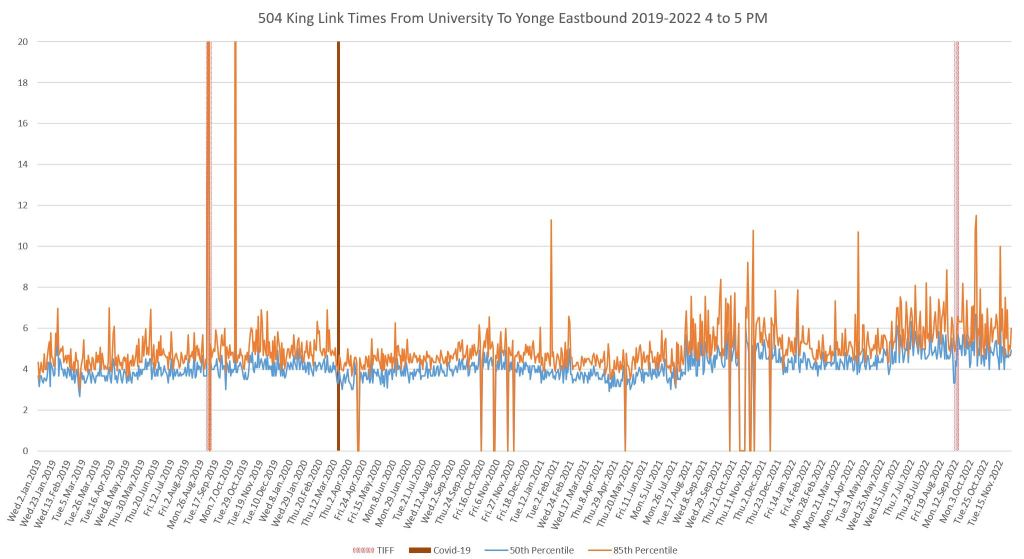
Although the portion of King Street east of University is generally not affected by the Entertainment District, it is subject to disruption from north-south traffic backing up through intersections. This effect occurs primarily in the PM peak, although it can also occur if there is a major sporting event or construction on the approaches to the Gardiner Expressway.
In some cases, the median travel time (blue) does not change very much, but the 85th percentile (orange) does jump around more from roughly May 2022 onward indicating less reliability of travel times.
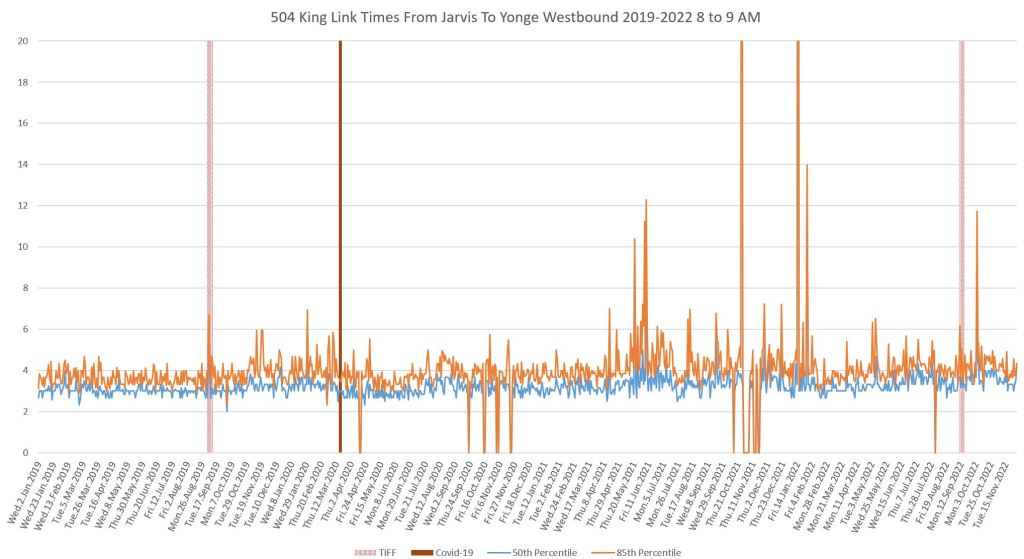
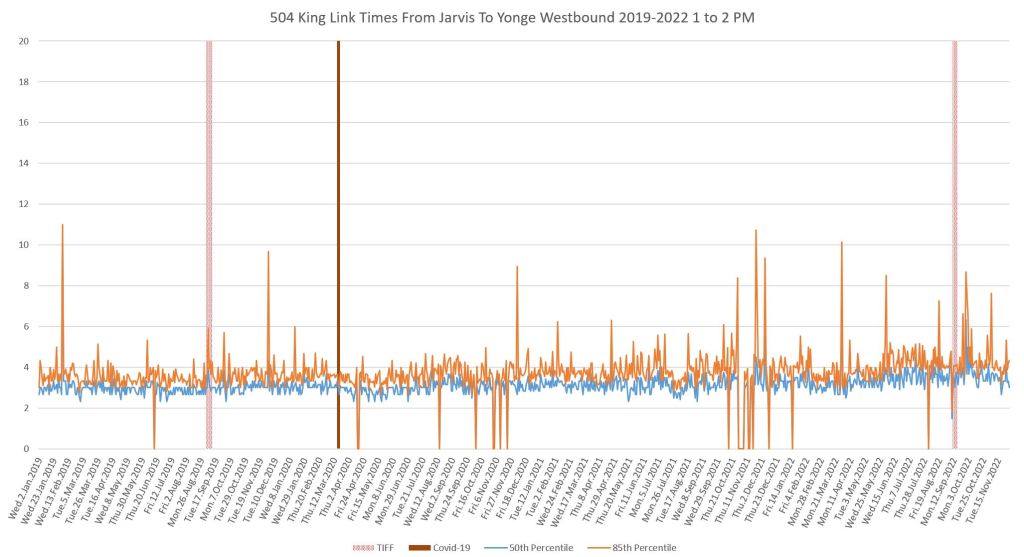
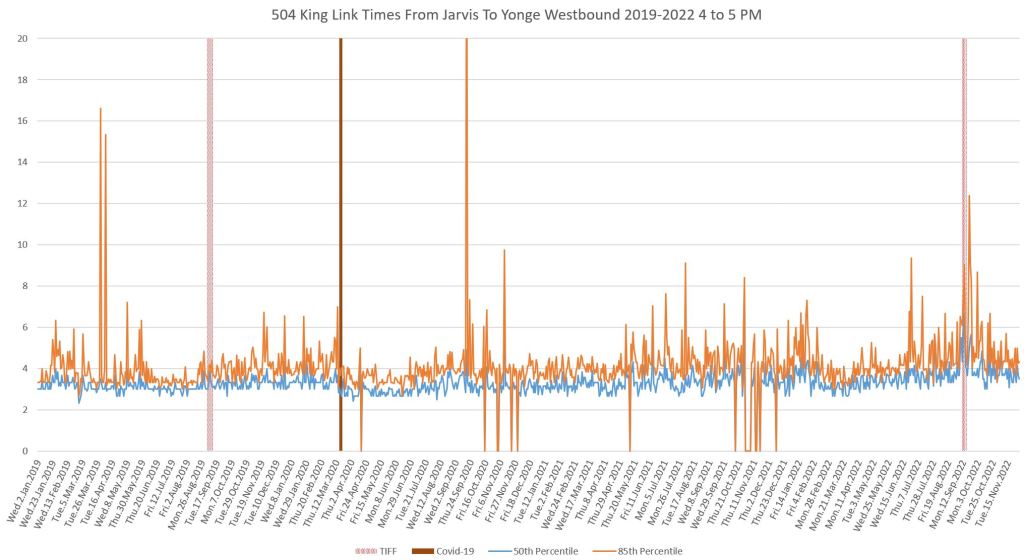
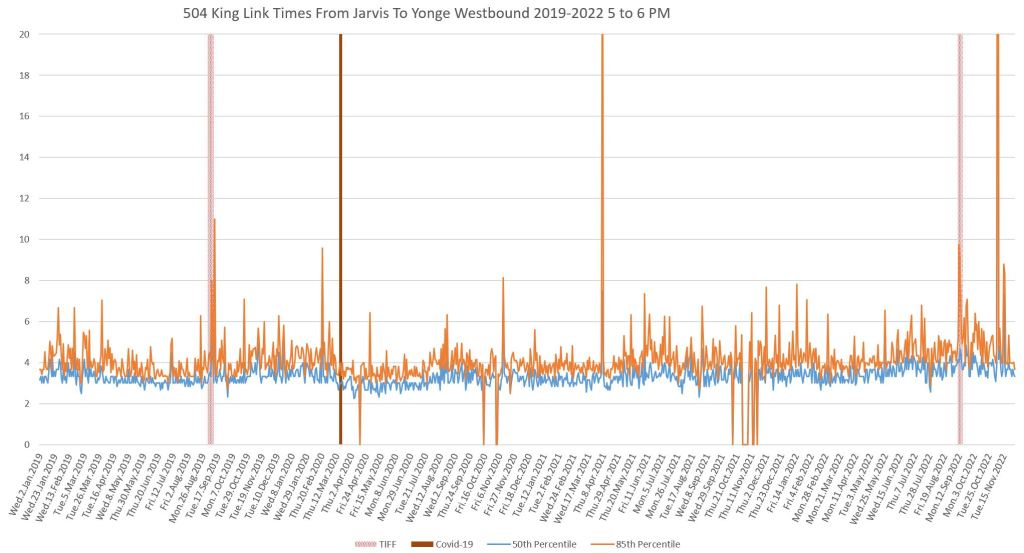
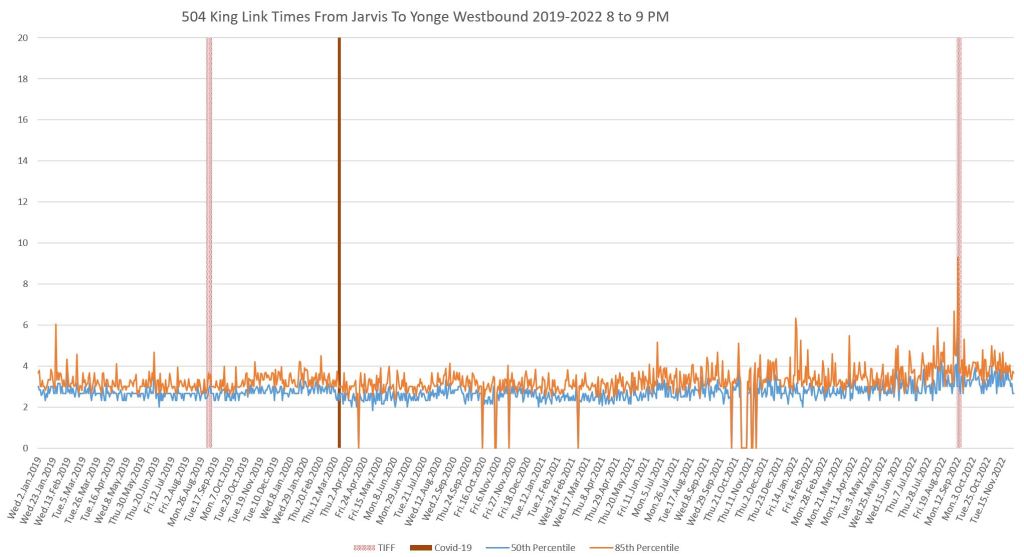
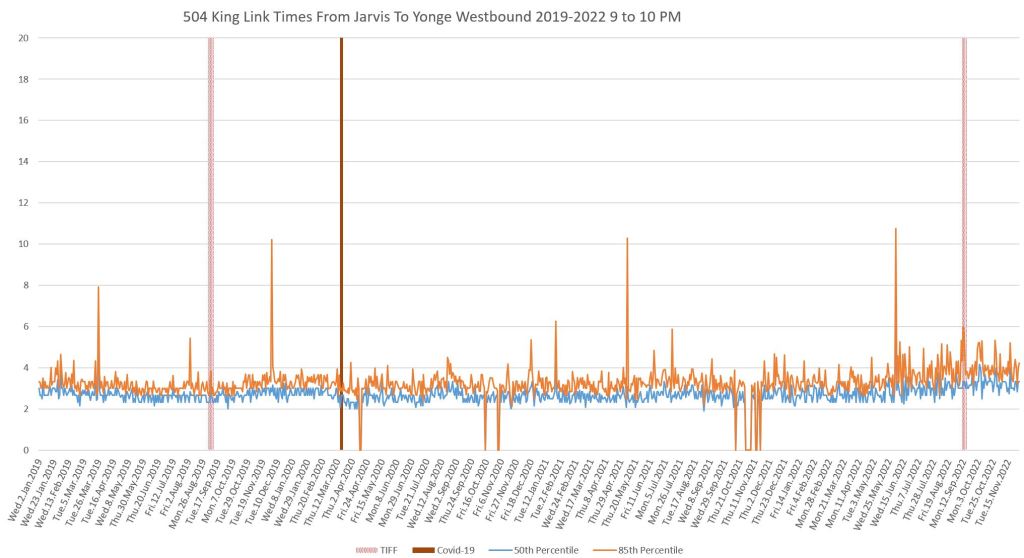
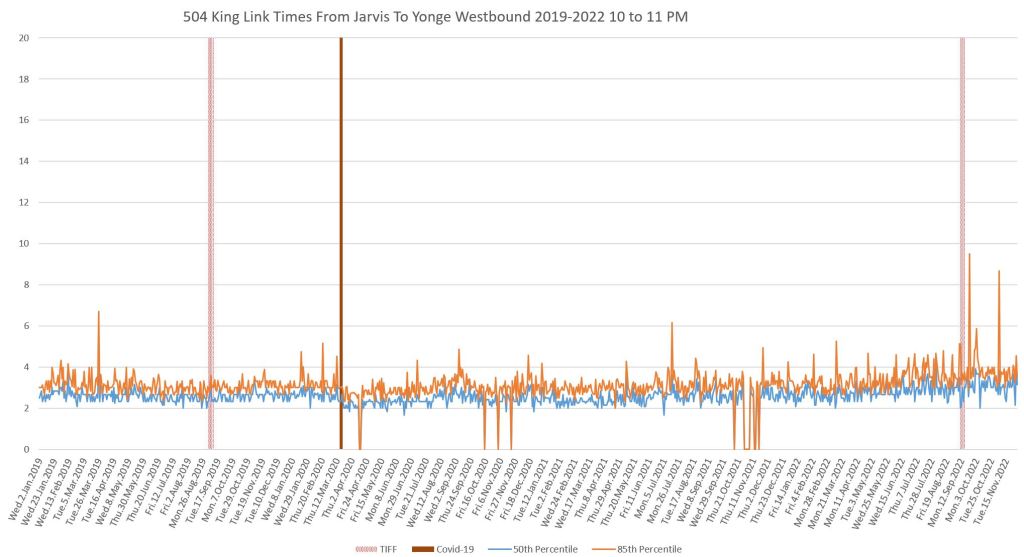
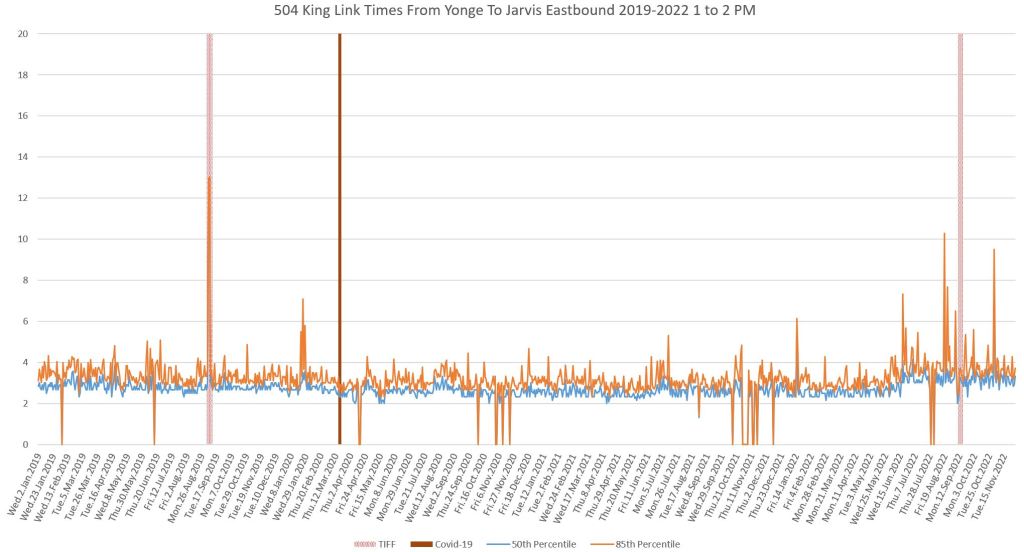
Jarvis to Yonge
Although the median values of travel times have not changed much in 2022, there is a growth in the 85th percentile indicating a wider range of values mainly in the PM peak.
Westbound

Eastbound


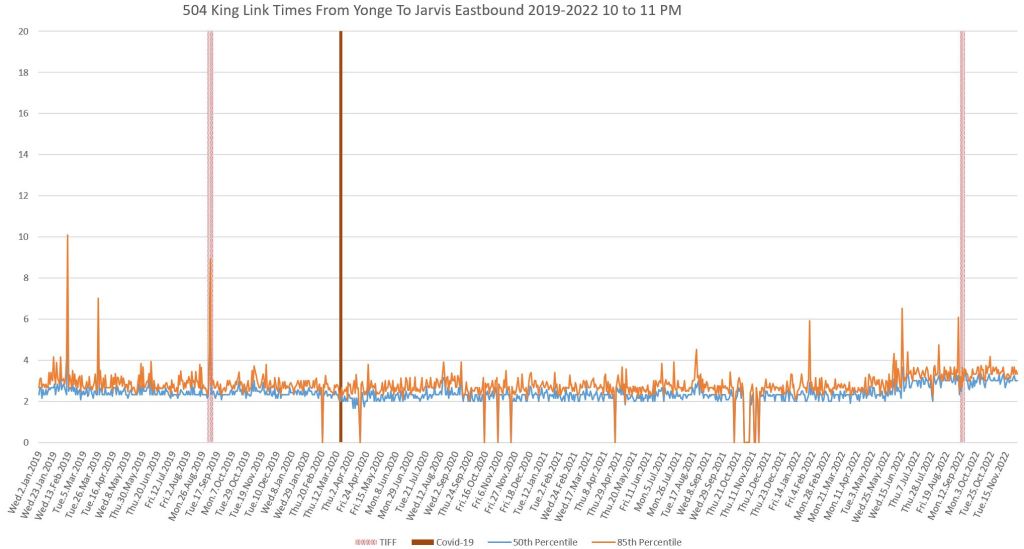
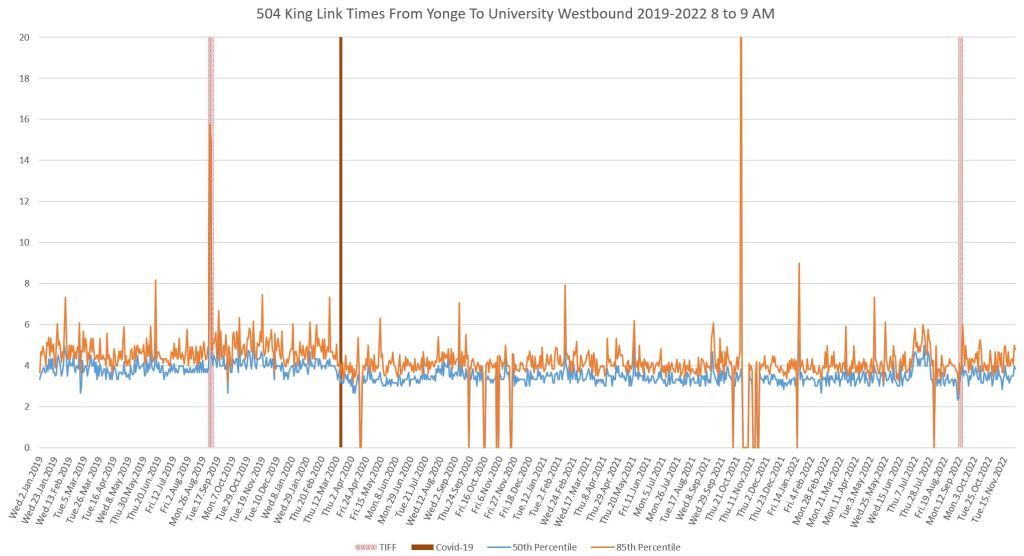
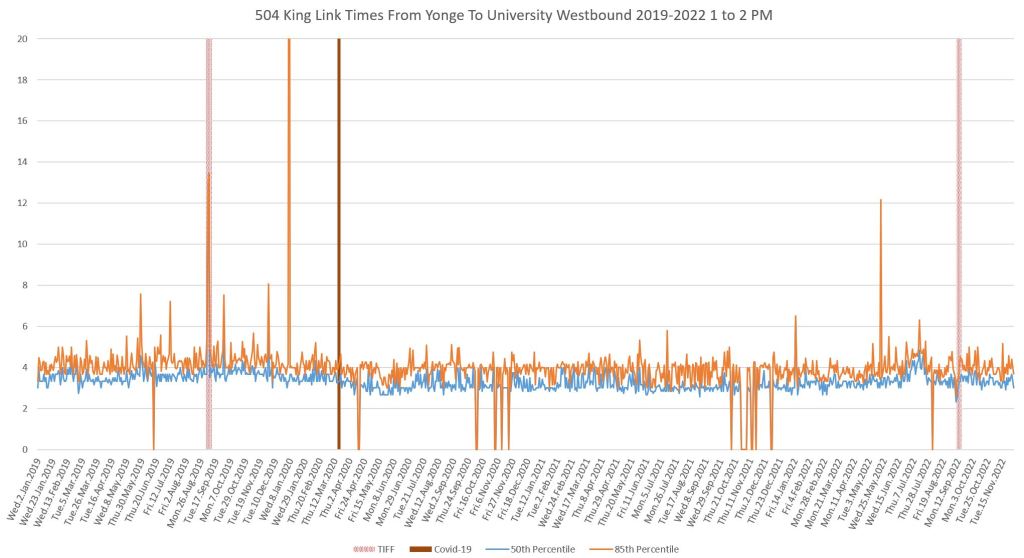
Yonge to University
Westbound
Westbound travel times from Yonge to University have not changed much over 2022.


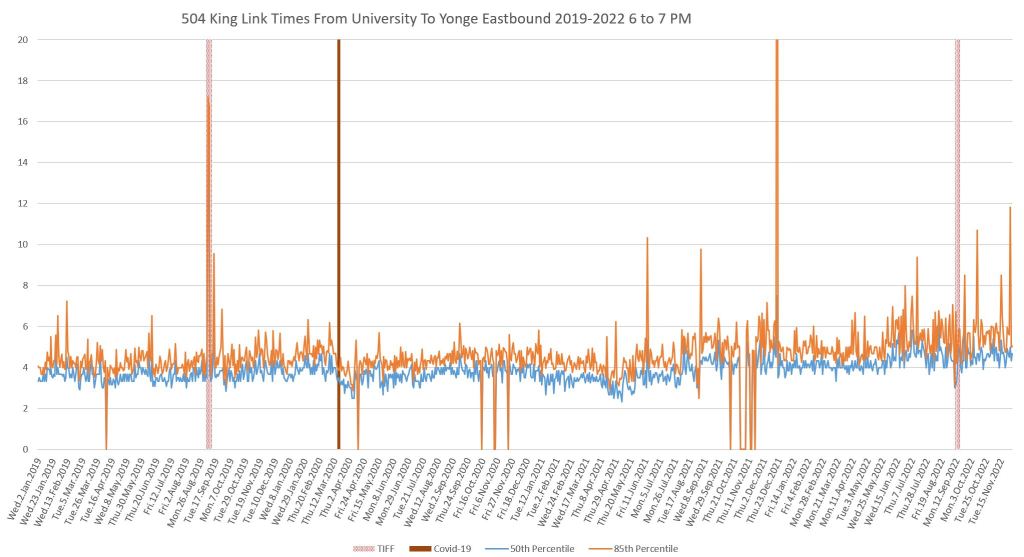
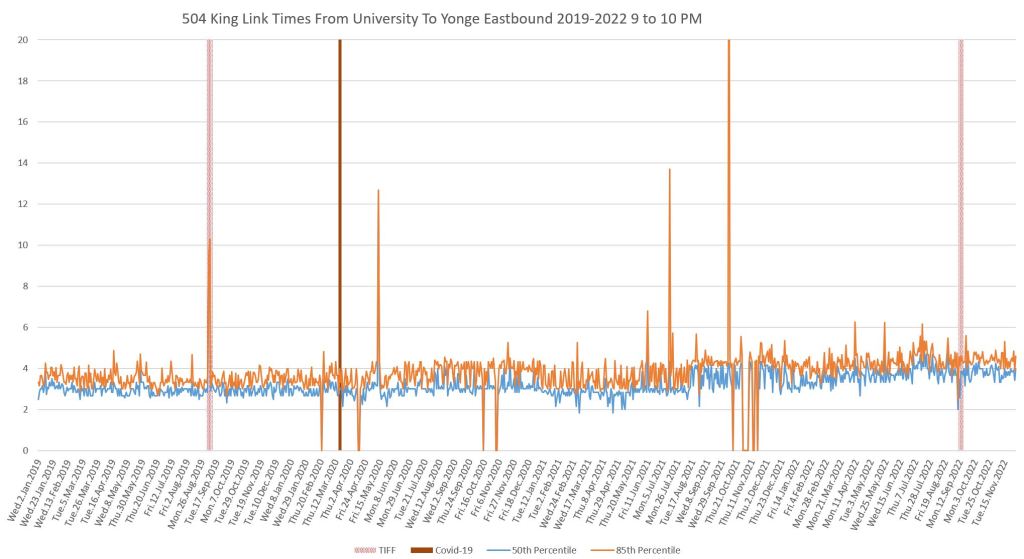
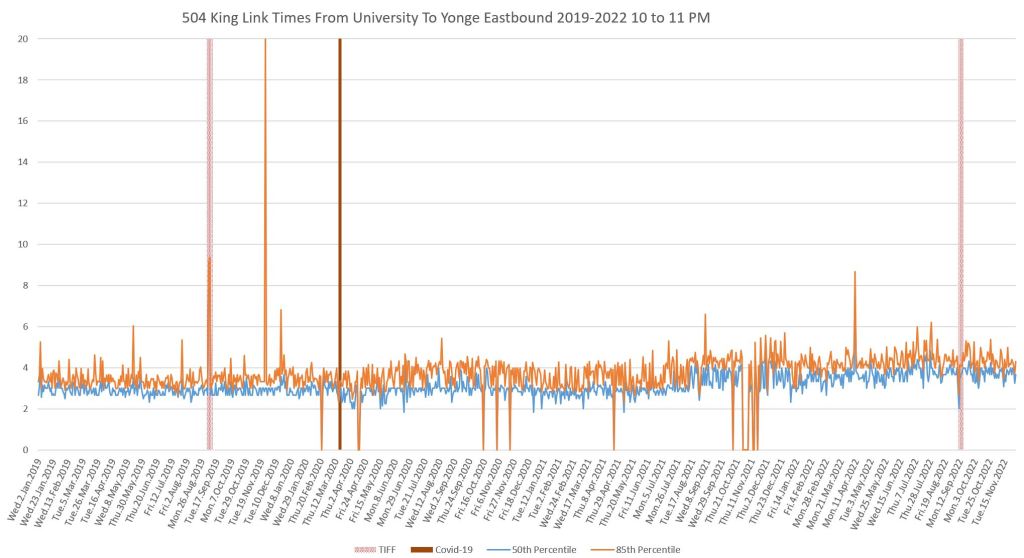
Eastbound
Travel times and particularly the 85th percentile values have been climbing through 2022 primarily in the PM peak starting at 4pm.


During TIFF, the streetcars on King Street West could continue through at a “walking pace”. We see that in many European where while a street maybe a “pedestrian zone”, the trams still move through at a “walking pace”. Even at a “walking pace”, the streetcars on King Street West during TIFF will be faster than using the diversions.
As long as the city gives priority to the single-occupant automobile, mixed traffic transit service will be squeezed.
Steve: The biggest problem is that TIFF wants to take over the street completely for a vendor fair on which they make money. They even count “attendance” of people walking down the street in the counts for the film festival as a whole. May, just maybe, if the City ever finishes the reconfiguration of John Street, the TIFF fair can be moved there, but I suspect there will be strong pressure to keep it on King.
LikeLiked by 2 people
All of this data proves that the King Street Pilot has failed and should be ended, I see this article of yours as an own goal. Thanks Steve.
Steve: No, this article demonstrates how the City talks a good line about transit and traffic improvements, but when push comes to shove does nothing beyond the initial photo ops. John Tory had to be talked into supporting this scheme by Jenn Keesmaat among others, and it will be intriguing to see what he does to rescue it from the lack of enforcement, not to mention a few cases of compromised design.
LikeLike
Peter Street is a huge issue especially in even afternoon/evening rush hour with commuters often remaining in the the intersection on red blocking King Street. This would, to me, explain a lot of the 85th percentile build up along that section.
Steve: The problem of traffic backing up through intersections afflicts other parts of King too, mainly further east at University. Another example of basic traffic management the City does not address.
LikeLiked by 1 person
Any thoughts on the King Street transit project’s effect on cyclists? I have riding the seemingly barren King Street on my bicycle and have noticed an influx of cyclists on the corridor who don’t have to deal with as many cars as they would on Adelaide or Richmond. Granted, we need to maneuvre around Streetcars, but since they lumber along so slowly, I find it is not an issue.
Steve: When the King Street project was being designed, there were complaints from cyclists about how they were not included. The premise was that lanes on Richmond/Adelaide would serve them, something of a joke considering ongoing construction, road conditions and the incursions of CafeTO. Four lane streets really are a challenge especially when we have a Council and Mayor who bow and scrape whenever a motorist complains about the “war on cars”.
LikeLiked by 3 people
Therefore, they should likewise count all the hundreds/thousands of transit riders on the King Car who pass by AND might well be enticed to get off and attend!
LikeLiked by 2 people
Jarvis & King is also frequently blocked in the afternoon rush hour(s). This intersection had, until quite recently, the vague imprint of yellow lines that the City painted there a decade or more ago to remind drivers that you should not enter an intersection you cannot leave. Of course, there was zero enforcement and that was long before the KSP.
Steve: I have looked at the data in more detail for the segments between Jarvis and Yonge, and from Yonge to University. There is an increase both in average travel time and in the degree of variation at certain times of the day, although not the same as the segments further west which have the entertainment district effects. I will update the article with additional charts for the two segments east from University.
LikeLiked by 1 person
Has anyone did a survey of the number of single-occupant motor vehicles in the downtown? The majority of traffic congestion is caused by the sole occupant of automobiles. I’m excluding delivery and contractors (heating, electrical, plumbers, etc.). Yet the city gives them priority ahead of buses and streetcars carrying way more than what the almighty automobile transport.
LikeLike
Bay Street is often backed up and blocked from all the Gardiner bound traffic. Jarvis too which is made worse from the lane closures for construction of the new St. Lawrence north building.
LikeLike
Hi Steve,
Any truth to the rumour circulating online that Queensway’s 8000 series airport buses will be retiring at the end of this board period (December 23)?
Steve: I don’t know, but they are roughly the right age for retirement. That series is not flagged in the November edition of the vehicle list for retirement, but other contemporary groups of buses are.
LikeLike
Bay Street has bus lanes in the right lane. Useless. Motor vehicles still park (stand, or stop) in the right lane. This ends up with the buses having to move into the left lane to maneuver around, slowing everyone.
It was faster when Bay Street had streetcars. At least they would be passing the blocking vehicles without have to maneuver around them. In addition, when stopping at streetcar stops, they would be able to stop the traffic which allowed the left turning vehicles in the opposite direction to turn.
Steve: The Bay Street “Clearway” has been unsuccessful since the day it was implemented, and that’s a long time ago when trolley buses plied the route and service was a lot more frequent. Unless the TTC is planning a huge service increase there, the signage should be removed.
LikeLike
Hi Steve,
Great post again.
I have an unrelated question, but figured this was a good way to reach you. Do you happen to have copies of, or know where to find copies of, the contracts between TTC and YRT for providing service north of Steeles? Thanks in advance.
Steve: I have never seen these posted publicly anywhere, and suspect they would survive an FOI request on the basis of “commercial confidentiality”, at least as far as the amounts payable were concerned.
LikeLike
Hi Steve,
I was wondering based on my experiences travelling to different cities and seeing other transit systems such as Los Angeles, (which has some of its light rail, rapid transit lines built on existing expressways) why hasn’t the TTC in the governments come up with an idea of building more rapid transit line on the highways (similar to what Allen Road/Line 1 looks like) if the government decided to reduce a few lanes on the 401 or 427 to build a rapid transit (light rail or subway) line on the middle which can potentially provide a fast connection between Pearson airport and Scarborough town centre or Kipling station with stops at each highway exit/major intersection.
Steve: This has come up recently in another thread on Twitter. There are a few fundamental problems. First of all, our expressways are not designed to have stations at interchanges and access either on foot or by bus feeder would be very challenging. Second, the idea that governments would willingly give up road space for transit, and in particular the one now in power, really is beyond belief. I would be surprised if even an NDP government would take on that challenge. But third, the focus of such proposals always seems to be the idea that there is a lot of point-to-point demand as opposed to the much more general travel pattern we know exists. Very bluntly, if we are going to start taking lanes, I can think of local streets where this is far more justified than an attempt to repurpose highway space.
The RapidTO proposals have not met with warm reception on Dufferin and Jane, for example, and I think the same fate awaits them on other streets. There is something of a parallel with King and other streetcar streets. In spite of the opposition of so suburban councillors and a less-than-enthusiastic initial reaction by Mayor Tory, we were able to implement it because of local political support and because there was parallel road capacity to absorb diverted traffic. Also, with some initial opposition, the conversion of curb lanes to patios and seating areas has proven quite popular even with affected merchants. This was a very site-specific conversion, an moving to other areas would be much more challenging. There are still some who fight to undo the reserved lanes on St. Clair and just want more space for cars.
We need to focus on using road space for the benefit of transit everywhere. A 401 express lane would be a big fight and in the end would add little to the transit network as a whole. The Dufferin Bus and Queen car would be just as bad the day after a 401 lane opened as the day before.
LikeLiked by 1 person
Steve pointed out some of the problems with this. I will point out that even if the Eglinton Crosstown is ever completed, there will still be no East-West rapid transit north of Eglinton. I am not counting the Sheppard Stubway since it is only 5.5 km long. So there is a definite need for something like this in our transit network.
I will start out by saying that subway technology is inappropriate, due to its high cost. That is why the various proposals over the years to extend the Sheppard Stubway have gone nowhere, and rightfully so. In 2011, the cost of extending the Stubway from Sheppard West Station to Scarborough Centre was estimated at $4.2 billion. There is insufficient demand to justify such a high cost. Source for demand and cost estimates: Wikipedia
I note that the current provincial government re-committed itself to extending the Sheppard Stubway in its “2022 Ontario Economic Outlook and Fiscal Review.” See chart 1.2.
However, there is little money currently being spent towards expanding the Stubway, so I will put that in the ever-expanding category of “Doug Ford promises that are highly unlikely to ever be kept.”
The problem with a 401 LRT proposal is how to create the stations for transfers from all the North-South feeder routes. Usually those North-South streets are carried on bridges over the 401. In theory, it would be possible to rebuild the bridge to include an LRT station, so that at each station the track would rise from ground level up to the station on top of each bridge. However, the cost of such elevated stations would be so extremely high as to put it in the same category as Sheppard Stubway expansion in terms of “cannot be justified on a cost/benefit basis.”
Having said all that, there is still a high level of demand for East-West travel north of Eglinton. Not enough demand for a subway line, but definitely enough for an express LRT route. And with the rapid expansion of Toronto’s population, that demand will only continue to increase.
In my opinion, one alternative that should be looked at is putting an express LRT line in the Finch hydro corridor. To some extent, the Finch hydro corridor is currently used by express transit, with the Finch 939 Express bus using the remains of the York University Busway from Dufferin Street to Finch West Station through this corridor. This, of course, involves evicting most of the current users of this corridor, which range from children’s playing fields to garden allotments. However, the real estate is already in public ownership, and that is the greatest expense of most LRT projects. And connecting stations to north-south feeder routes will be at ground level, further reducing costs.
I am not a big fan of BRT, but it does have its place. Right now the Finch 939 Express buses have not only recovered from Covid loss of demand, but are absolutely packed, even mid-day outside of peak hours. As a first step, extending the busway from Dufferin to Finch Station and running it as a proper BRT would be a significant step forward. Yes, this means that children at Northview Heights Secondary School will lose some or all of the North York Civic Soccer Fields. But since children are disproportionately killed or injured by the lethal cancer-causing fine particles put out by automobile drivers, they will be the major beneficiaries of any transit project. Source for child vulnerability is page 20 of this document.
Steve: A few additional details worth mentioning. Any change in grade to achieve a station has to allow for the structure length needed to climb/fall the desired change in elevation. This was an issue with a scheme to make stations on a surface Eglinton West line tricky. The more the stations, the more time the line spent changing grade. It also made the stations much more expensive due to accessibility requirements.
It’s really important to remember that the corridor does not go all of the way across the city, but cuts to the south west of Highway 400. Also, there’s the little matter of a few bridges required along the way crossing valleys and a reservoir. It’s not all flat. Doable, but there isn’t a continuous strip of land just sitting there for the taking.
Ironically, the Finch corridor was part of the TTC’s mid-1960s LRT plan for a suburban network to be built when most of the land around the corridor was empty. But Bill Davis and GO Urban got in the way, so it was never built.
LikeLike
True, but we are currently constructing the Finch West LRT to provide local service west of Finch West Station. This demonstrates the great flexibility of LRT. The same vehicle providing local service to the west of Finch West Station can then turn into an express vehicle in the Finch corridor.
True again, but this is standard engineering. Every road and railway line through Toronto deals with these things. Having stood on the side of the Dufferin Reservoir, I would estimate the water crossing at no more than 200 metres. And, as you point correctly out, it was part of the TTC’s mid-1960’s LRT plan. If it was feasible to build then, it is feasible to build now.
Right now, demand for East-West transportation along Finch far exceeds supply. So that even off-peak mid-day buses are seriously overcrowded, resulting in dangerous Covid super-spreader situations.
How are we going to handle this demand for East-West transportation after the completion of the Eglinton Crosstown? One proposal is to expand the Sheppard Stubway from Sheppard West Station to Scarborough Centre. The problems are that this costs $4.2 billion in 2011 dollars, the demand does not exist to justify the vast capacity that a subway provides and subways take a long time to build.
An express LRT in the Finch Hydro Corridor has the potential to provide the right capacity at the right price.
Steve : Those comments were aimed as much at happy fantasy map drawers who simply draw a straight line all the way from Rouge Hill to Mississauga. One important issue about the corridor remains, however, in that the transfer points to many existing routes will not be in areas with much “there” there because they are in a Hydro corridor. I must return to a common question about relative demands for express and local services, and whether the access time to the Finch corridor will counter the saving in travel time along that corridor.
LikeLike
Very much so! I will put forth four New Year’s resolutions for politicians in 2023.
#1. No more fantasy map lines. In particular, no advocacy for one pet line that miraculously solves all problems. Yes, I am thinking of John Tory and his ridiculous “Smart track” scheme. But he is far from the only example.
#2. No more “silver bullet” miracle technologies that magically solve all problems. The list that Toronto has suffered through is long, but the poster child for this is the Scarborough “toy train” line. At least we have stopped hearing so much about hydrogen recently.
#3. No more inappropriate infrastructure that is not justified by potential demand. No part of Toronto “deserves” a subway or anything else for any reason other than that it will be used. Yes, I am thinking of the white elephant Scarborough Subway, for which the demand for subway capacity does not exist.
#4. Remove thumbs from rear ends for things that desperately need to be done and are long overdue. The classic example of this is the Hamilton LRT, the lack of which has been seriously harming the city of Hamilton for all the decades that politicians have been talking and doing nothing. Another example is the endless talk about, and equally endless failure to act, to rezone Toronto for “missing middle” housing and mixed use neighbourhoods while we have a major housing crisis. What we need is this [YouTube video].
Please note from this video that 62% of Toronto’s residential area is restricted by zoning to single family housing. You now know why Toronto has a housing crisis. What we need is rezoning Toronto for more housing. But what we get are politicians who have great difficulty understanding that the way of solving a housing crisis is to build more housing.
Steve: The video generally makes its point, but for the Toronto examples, it does not clarify that the “62%” is almost entirely in what we used to call “the suburbs”, whereas larger built forms are legal within the old city, although some of the other factors mentioned kick in there as well. Showing century-old neighbourhoods in old Toronto gives the impression that t is these which are the “problem” areas, when it is the vast tracts outside the “old city” where there is a big problem with built form and density. That is compounded by a more car-oriented street layout where there is more space used for roads and parking.
When I start seeing videos showing single family houses in central Etobicoke, or Scarborough or North York, I will be less critical. We have already seen the rearguard actions to hobble housing proposals with the Deputy Mayor’s amendment to Tory’s proposal that kept parking requirements alive. One can actually understand the argument that the burbs really are not transit friendly, and intensifying housing there without parking could bring its own challenges. However, that’s an example of pushback from the far eastern end of Scarborough, not from a manicured cottage in Cabbagetown.
LikeLike