Various projects on the west end of the 501 Queen route continue, some faster than others, with one real surprise.
King-Queen-Queensway-Roncesvalles
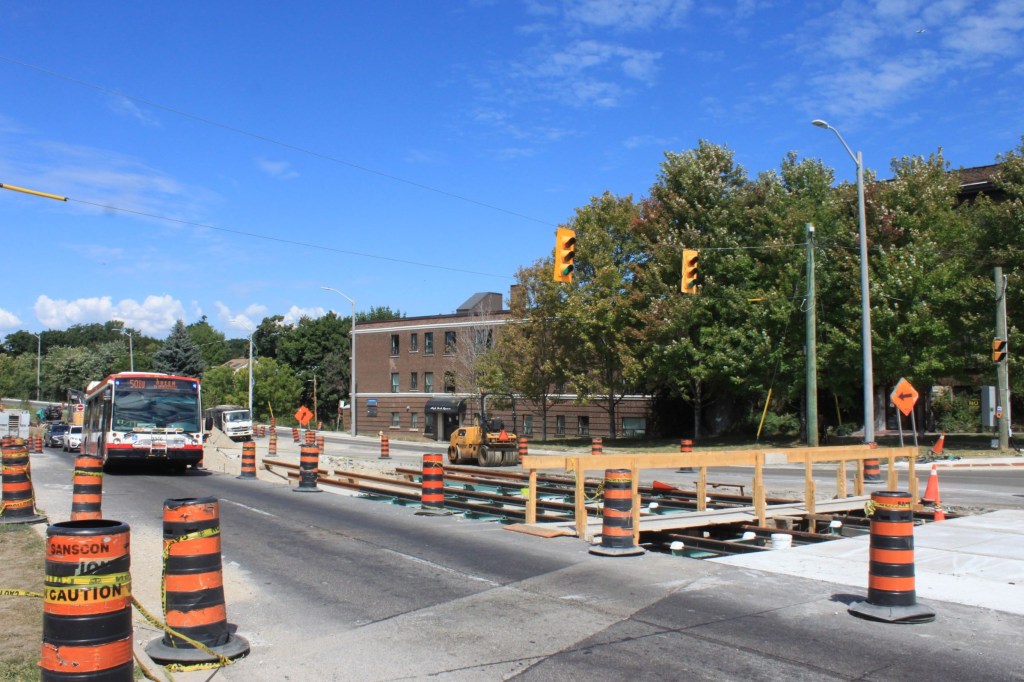
Little has changed here since my last visit except that the new contact wire is now attached to span wires in places, and some of the frogs (crossing pieces) have been installed.
The new contact wire still ends just east of Sunnyside Loop. Until reconstruction of the south side of The Queensway including bases for new overhead poles has completed, the loop’s overhead suspension system cannot be installed.
Further west at Glendale (St. Joseph’s Hospital), the concrete work now extends to the west side of the intersection, and the beginnings of a new eastbound stop stop are evident.
Looking west at GlendaleLooking east at GlendaleTemporary pedestrian crossing
Lake Shore & Kipling
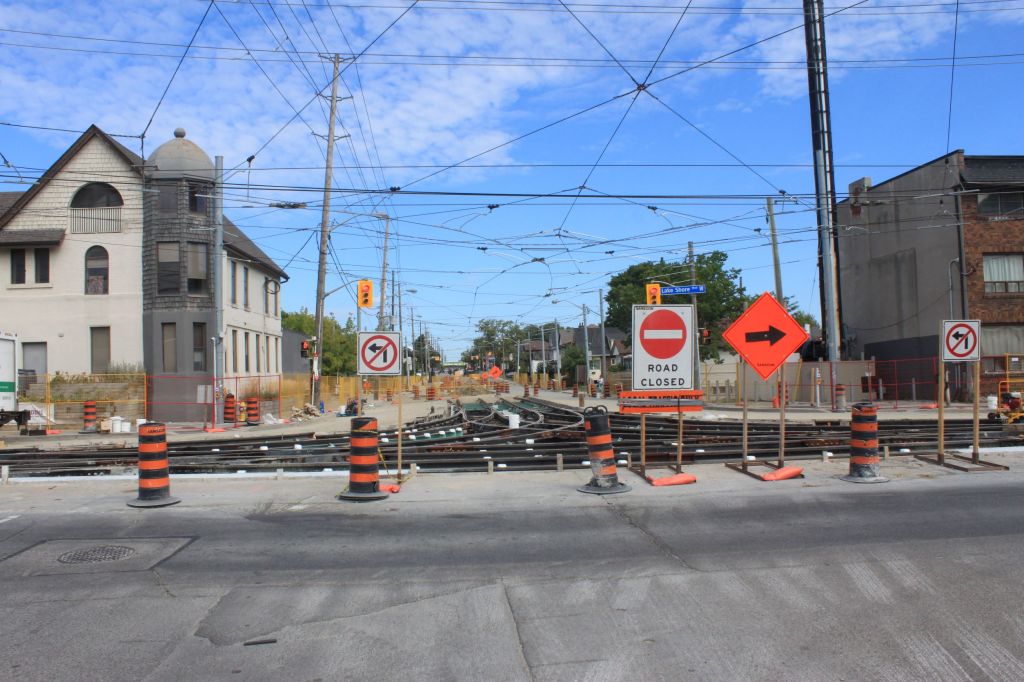
The TTC is rebuilding both the intersection at Kipling as well as Kipling Loop. To my amazement, they have not only replaced the rarely used east-to-north curve, but have added a new south-to-west. It will now be possible to short turn a Queen car eastbound at Kipling!
This is the same organization that forgets to add much-needed curves during other reconstruction projects or leaves them out on the basis that the budget won’t handle the expense. There is probably a special award for this sort of thing.
In a classic right hand, left hand, situation, note that the new pantograph compliant overhead includes the east-to-north curve, but does not include the south-to-west.
Looking north on KiplingLooking northeast on Lake ShoreLooking southeast on Lake ShoreLooking south on KiplingLooking west on Lake ShoreKipling Loop
Just east of the intersection, rails have been removed on the approach for replacement. This is a particularly clear example of how the “new” method of track construction adopted in the 1990s pays off with the need to only strip the top layer of concrete and expose existing attachment points to existing ties.
Looking east on Lake Shore east of Kipling
Louisa to Mimico
The track replacement and repaving of Lake Shore from Louisa to Mimico is complete, and only a few traffic cones prevent full use of the roadway.
Updated August 14, 2022: Charts of travel times on King between Strachan and Dufferin have been added to show that although there were congestion problems, they existed only on specific days due to special events, not pervasively through the month of July.
According to the TTC CEO’s Report, short turns (a situation where a vehicle does not reach its scheduled destination but instead turns back at an earlier point) were all but eliminated in May 2019.
This is not to say that short turns should not exist. They are an inevitable part of transit operations where delays can occur, and are essential to restoration of regular service. Back in 2019, the TTC’s problem was that they were used very frequently either as a lazy way to manage service or in response to unrealistic schedules. Now they occur but are not reported.
Meanwhile, other problems with service such as bunching, gaps and missing vehicles are not reported or tracked (at least publicly) at all.
There is no way to avoid saying this: the reported level of short turns is a total misrepresentation of what actually happens on the street as any regular rider knows. Management gets to claim they have eliminated a problem, but in fact it persists.
From TTC vehicle tracking data, it is possible to count the number of streetcars passing any point on the line. In order to determine how many short turns occur at a specific location, counts on either side of a turnback will reveal the answer.
For example, if the screenlines for counts on Queen are defined as Coxwell Avenue and Woodbine Avenue, then the difference in counts shows how many cars short-turned at Woodbine Loop.
For these analyses, the counts are grouped by hour and by day through a month. Next, all weekdays, Saturdays and Sundays are consolidated to show the difference between types of day. The weekday counts are broken out by week to catch short-lived effects.
Friday, July 1, Canada Day, is counted as a Sunday. Note that this means that there are six “Sundays” and only five “Saturdays” included in the totals. That is the reason the count of trips within the month is higher for Sundays than for Saturdays.
An important distinction in any analysis is between overall averages and a detailed view of operations. TTC has a bad habit of reporting stats, when they do so at all, on a monthly average basis. This blends together periods when service is good with periods when it is very bad giving the impression that things are going fairly well. Riders, of course, encounter and are angered by the bad times which happen too often and fairly predictably.
The raw data are at a minute-by-minute, vehicle-by-vehicle level. In the charts here, I have tried to strike a balance between “information overload” with too much detail, and high level views that obscure what is happening on the street.
The TTC will host the final event in their centenary year on Saturday, August 20, 2022 at their Hillcrest site on Bathurst Street south of Davenport from 10am to 2pm. The event takes place in the employee parking lot south of the Gunn Building which is on the southwest corner at Davenport.
There will be static displays of vehicles and future plans, but the shops will not be open.
A free shuttle bus will take visitors to the Toronto Archives on Spadina north of Dupont where they can view the TTC 100 Years of Moving Toronto exhibit.
Other routes to be reviewed include 85/985 Sheppard East, 102/902 Markham Road, 43/943 Kennedy and 68/968 Warden. Routes in the Eglinton-Kingston corridor will be reviewed as part of a “red lane” update in the Fall.
Scheduled service on Steeles East is unchanged since Fall 2021. There are various route branches which overlap to provide a frequent combined service on paper, although individual branches on wider headways can be less reliable.
Peak service is provided by three branches:
53B Finch local to Markham Road
953A Finch express to Staines
953B Finch express to Markham Road
The scheduled headway on the express service is every 7’00” (am) or 7’15” (pm) as opposed to every 6’00” on the local service. This means that even if everything runs exactly on time, there will be uneven spacing between the express and local buses.
Midday and early evening service operates with 53A and 53B local buses to Staines and to Markham Road respectively, but the 1-in-3 (midday) or 1-in-4 (early evening) pattern of 53A buses produces gaps in service on the 53B branch that serves the Amazon fulfillment centre via Markham and Passmore Roads. Late evening weekday service alternates between the branches.
There are similar uneven weekend headways on the 53B because of the gaps produced by the occasional 53A trips.
Service Standards vs Service Reliability
A point worth mentioning here is that even the fairly well-behaved periods of service on both the local and express branches show a problem with an on-time target window that is close to the scheduled headway. Service can be “on time” within a six minute window, but still operate in bunches.
For example, if the scheduled departures are on the 0, 6, 12, 18 … minute marks, buses could actually leave on 5, 5, 17, 17 … and be “on time” by TTC standards. Half of the buses would be five minutes late (the upper bound allowed), while the other half would be 1 minute early (the lower bound). This is a worst case scenario, but it shows what the standards allow.
In effect, the six minute window allows gaps of up to twelve minutes followed by a pair of buses to be considered “on time”. This allows reported service quality to be much better than what riders actually experience, and leaves a gap (so to speak) between the claimed and actual service quality.
Overall, service reliability on Steeles East is fairly good simply because it is so frequent on weekdays on the common part of the route west of Markham Road. However, the outer branches suffer from gaps and bunching that is hidden by the frequent service further west. Weekend service is particularly uneven, and the degree of headway management varies from one weekend to another. The express service headways are spread over a range wider than the time saving an express trip offers.
Several projects are in various stages on the west side of Toronto’s streetcar system. Here is an omnibus update.
King-Queen-Queensway-Roncesvalles
The reconstruction of this junction has reached the point where all of the contact wire for the new intersection is in place, but it is not yet attached to the hangers on the spiderweb of span wires above the intersection. Contact wire extends west of Roncesvalles through the South Gate area, but ends just east of Sunnyside Loop.
Further west, the track is in place to Glendale Avenue (St. Joseph’s Hospital stop), but not fully concreted. One block remains to be installed from Glendale to the existing right-of-way.
Looking east from GlendaleLooking west from Glendale
According to the most recent City construction notice, service west of Bathurst Street will resume in two stages, and even then will not yet be through to Humber and Long Branch.
Effective September 4th:
501/301 Queen streetcar service will be extended west to Dufferin Street from Bathurst Street. 501L replacement buses will be shortened to operate from Long Branch Loop to Dufferin Street.
The 504/304 King streetcar will continue to be replaced by bus service west of Dufferin Street.
As of October 9th:
501/301 Queen streetcar service will be extended as far west as the KQQR intersection. 501L Replacement buses will continue to operate between Long Branch Loop and Dufferin Street.
The 504/304 King streetcar will continue to be replaced by bus service during construction and will have no service on Roncesvalles Avenue south of Howard Park Avenue. Route adjustments are: Howard Park, Parkside, Lake Shore, Colborne Lodge, The Queensway (both directions).
Detailed service plans will likely be published by the TTC in mid-to-late August.
Lake Shore Boulevard West
The track between Louisa Street and Mimico Avenue was not replaced in the last round of TTC upgrades on this route. They are now completing this section. A few points to note in the photos below:
In the view looking west, work on overhead conversion to pantograph mode including staggering of the contact wire is in progress. Over the entire route from Humber to Long Branch the contact wire is not yet attached to many of the new hangers.
In the view looking east, note that the rail is not yet fastened down with Pandrol clips. The previous rebuild here is recent enough that the track foundation already has steel ties, and so the rebuild only requires removal of the top pavement layer. The new track is then attached to the existing foundation.
Looking west from Burlington ST.Looking east from Burlington St.
At Kipling and Lake Shore, construction has just begun on replacement of the intersection and Kipling Loop. From the pre-assembled track already sitting on trailers near the site, it appears that the east-to-north curve will be replaced rather than removed. This curve is only ever used by railfan charters, and yet it survives. Meanwhile, on another project at Church & Carlton where missing curves in the south-east quadrant would add to network flexibility, the TTC is rebuilding the track as is without them.
Dundas West Station
The new extended platform for 505 Dundas cars is now in place, although still missing guardrails, and the track replacement for the loop has been complete for a few weeks. The new platform will allow two 505 Dundas Flexitys to be in the station at once (this was already possible for 504 King cars) relieving a source of congestion on Dundas Street at the station entrance.
Currently announced plans are for buses to return to this loop in September, but 505 Dundas streetcars will continue diverting to High Park until early October pending completion of new overhead and the platform.
504 King streetcars will not return here until completion of the last phase of the KQQR project likely in late Fall 2022.
In my article detailing the planned service changes on the coming weekend, I included a proposed map showing how the 506 Carlton shuttle bus would divert around construction at Church Street. This route has been changed:
Original: From Jarvis & Carlton, south to Gerrard, west to Yonge, north to Wellesley, west to Bay, south to College (same route in reverse eastbound).
Revised: From Jarvis & Carlton, north to Wellesley, west to Yonge, south to College (same route in reverse eastbound).
The original roundabout diversion was due to concerns that construction at Yonge & College would prevent buses from turning there. Here is the updated map from the TTC’s website.
At its meeting of July 14, 2022, the TTC Board received a Green Bus Update. By the time a contract is awarded later this year, it will be almost five years since the TTC began this process.
Among the issues not yet resolved are the status of various potential vendors, the degree to which the head-to-head comparison of buses will actually influence product selection, and the financial arrangements in the short and long term for a major shift in bus propulsion technology.
The final piece of the Wellington Street reconstruction is underway with new track between Church & King and Yonge & Wellington. The long-inactive wrong-way track has been / will be removed during this work.
Wellington Street has a new design with the north sidewalk extended into what was once the curb lane in places for transit stops. The view below looking east from Scott shows a lay-by cut into the former curb lane. This can be used for deliveries, taxis, etc., but it is not a through lane.
Westbound streetcars remain where they were in the second lane counting from the north side.
503 Kingston Road service will return to this track once it gets new pantograph-compliant overhead in the Fall.
Looking S on Church from KingLooking S to Wellington/FrontChurch/Front/WellingtonLooking S to Wellington/FrontLooking W on Wellington from ChurchLooking W on Wellington toward Scott
In a recent article, I reviewed route-level ridership data cited in the 2023 Annual Service Plan as well as the 2019-2021 numbers posted on the TTC’s Planning web page.
During debate at the July 14 TTC Board meeting, an issue came up about the unexpectedly poor performance during the pandemic era of 25 Don Mills. This got me thinking about how the “results” could be influenced by when counts were done and particularly on routes that have both express and local branches under different route numbers.
To explore this, I recast the 2019-2021 stats in tables with and without the express 9xx routes consolidated into their local equivalents.
First, here are the stats with the local and express routes separate. The gallery below contains the first set of routes, but the complete list is in the following pdf. The data here are the same as presented in the previous article, but reformatted for easier browsing.
The three express/local routes on these sample pages show the differing effects.
Route
2019
2020
2021
% Recov 2020
% Recov 2021
Victoria Park
24 local
22,751
12,233
14,077
54%
62%
924 express
6,472
3,663
57%
24/924 local+express
29,233
12,233
17,740
42%
61%
Don Mills
25 local
27,988
16,481
18,719
59%
67%
925 express
16,624
9,074
55%
25/925 local+express
44,612
16,481
27,793
37%
62%
Dufferin
29 local
27,487
23,021
22,087
84%
80%
929 express
15,722
13,238
84%
29/929 local+express
43,209
23,021
35.325
53%
82%
In all three cases, the express service did not operate in 2020, and so all of the riding, such as it was, occurred on the local route number. This inflated the apparent ridership retention of the local route over the actual level on the corridor considering the two routes as one operation.
The effect was so strong on Dufferin that its local recovery rate went down slightly in 2021 because growing demand on the corridor was not enough to offset the shift of riders back to the express service.
The moral of the story here is that looking at stats in isolation can lead to incorrect conclusions if the underlying network and service plan are not taken into account. This applies to simplistic rankings such as “top 20” and “bottom 20” that can exclude routes with almost identical performance. A better metric would be the collection of all routes above or below a certain recovery rate.
Politicians who fund and, nominally, direct transit systems love easy-to-understand metrics that often hide or even distort what is going on. I will turn to TTC measurement indices and standards in a future article.
The real estate industry, their acolytes and even the affordable housing advocates went into meltdown when the 2022 update to the Development Charges landed at Toronto’s Executive Committee. This proposal was approved recently by City Council, but with a few carve outs such as exempting certain types of housing (up to 4 dwellings on a lot) from these charges.
The main trigger for the uproar was that the new DCs are much higher than those they replaced. With transit being the primary driver of this increase, it is worth understanding how DCs work and what the new charges will and won’t fund.
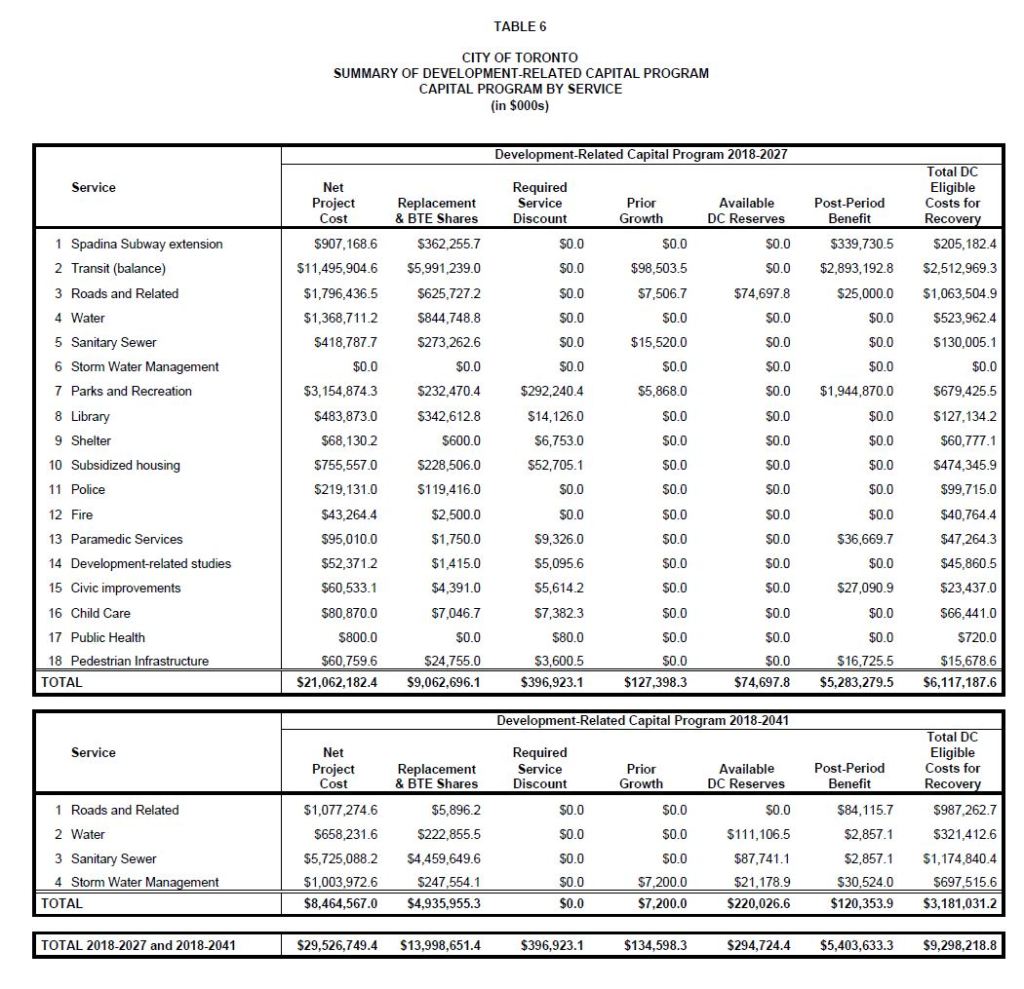
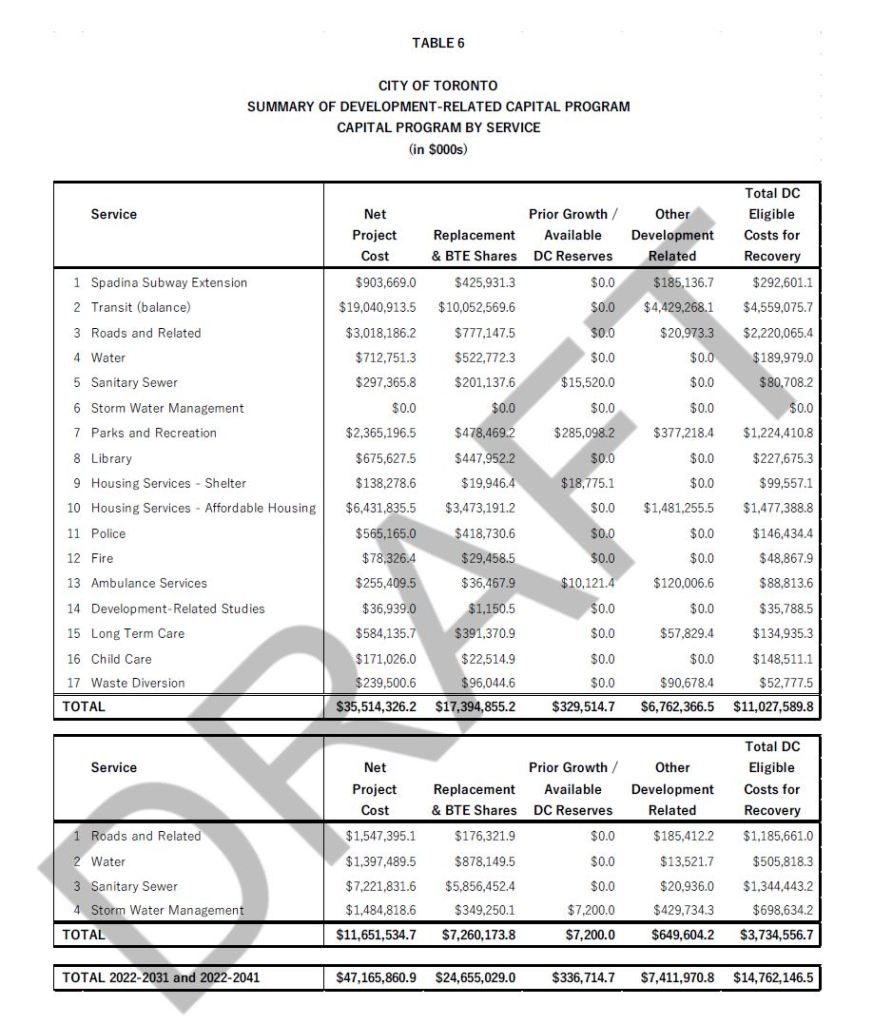
First, a comparison of the base data for the 2018 and 2022 reports. The tables below are in almost the same format making comparison easy.
The important column is on the right end of both charts “Total DC Eligible Costs for Recovery”. The total in 2018 was $9.3 billion while in 2022 it is $14.7 billion.
Yes, we are still paying for the Spadina Subway which gets its very own line in the table, and the Sheppard line shows up in the details under “Transit (Balance)”. Large increases lie in:
Transit, about $2 billion
Roads, about $1.2 billion
Housing Services, about $1 billion
Parks & Recreation, about $550 million
Some lines go up by a lot proportionately, but the dollar amount is comparatively low. For example, Pedestrian Infrastructure went from $15.7 million to $52.8 million, over triple, but the actual dollars pale by comparison with transit.
A major difference between 2018 and 2022 is the proportion of total costs recovered from subsidies and contributions from other parties.
In the 2018 DC calculation a grand total of $43.5 billion gross was reduced by $14.1 billion to a net value of $29.4 billion.
In the 2022 DC calculation, a grand total of $66.9 billion gross is reduced by $19.8 billion to a net value of $47.2 billion.
The increase in gross figures, 54 percent, is much higher than the increase in recoveries through subsidies and other revenue, 40 percent. This causes a disproportionate growth in the net of 61 percent.
Where Do Those Numbers Come From?
The background study that recommends new Development Charges starts with a list of every capital project in the City. The TTC has the biggest capital budget, even with some major projects taken over by the province, and it therefore generates the biggest part of the DC tithe.
For each project some costs are included and others are excluded. The headings on the charts above show the breakdown:
Net Project Cost: The cost of the project borne by the City after deducting provincial and federal subsidies and contributions by others (for example, York Region’s contribution to the Spadina Subway). (The gross costs for those who are interested are in the detailed tables.)
Replacement: Costs to replace existing infrastructure (such as new buses that replace old ones) are not eligible for DCs because this cost does not address growth, only worn out assets.
Benefit to Existing (BTE) Share: Demand that would rise if the improvements were already in place determines the portion of the benefit that is not due to new development.
DC Reserves: Some groups of projects did not manage to spend all of the money collected for them, and this sits in a carry over reserve offsetting new charges.
Other Development Related: Some costs are deferred to future rounds of DCs as reflecting the value of a project like a new subway line well beyond the five year cycle of DC updates.
The BTE share is calculated from existing and projected ridership (see below).
Looking at the 2022 chart above, of the $47.2 billion in net project costs, only $14.8 billion will be recovered in the current period from DCs. (The gross cost, by the way, is $66.9 billion.) This does not include provincial projects like the Ontario Line and Scarborough Subway which are no longer on the TTC’s books. It also does not include much of the Green Bus plan because that is mostly replacing existing buses, not adding to the fleet for ridership growth.