
With the opening of Line 5 Eglinton on February 8, the former 35 Jane bus was split in two. This article reviews the headway reliability on the new services, with a look back at November 2025 as a comparison. Service in the Jane corridor was notoriously erratic. It has been proposed as a RapidTO red lane route, but nothing has actually been implemented yet.
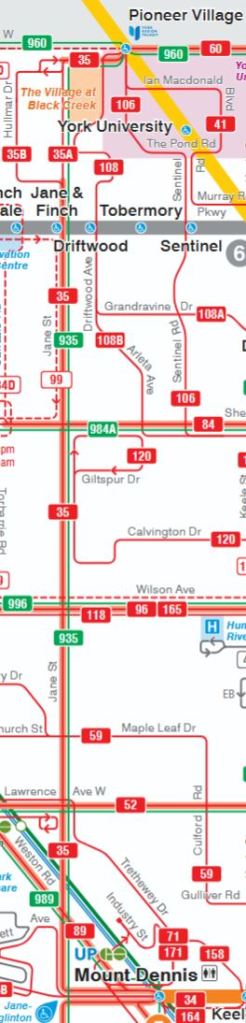
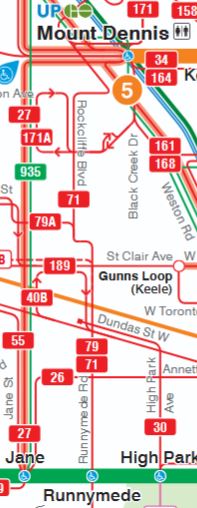
The original service operated from Jane Station to Pioneer Village Station. At the north end, the service divides with half of the buses running via Jane to Steeles, and half via Hullmar. This arrangement is preserved in the new 35 Jane whose southern terminus is Mount Dennis Station. (Map on the left below)
The new 27 Jane South route runs from Mount Dennis Station to Jane Station. (Map on the right)
There was no change in the 935 Jane Express which continues to run directly between Jane and Pioneer Village Stations.
By comparison with the service in Fall 2025, operations on the 27/35 route pair are an improvement, but this starts from a very low bar. Headways along the route are scattered over a wide range of values making service for riders quite unpredictable. There is no change in service behaviour over the three month period indicating that there was no effort to improve performance, or there was, it had no effect.
Introduction
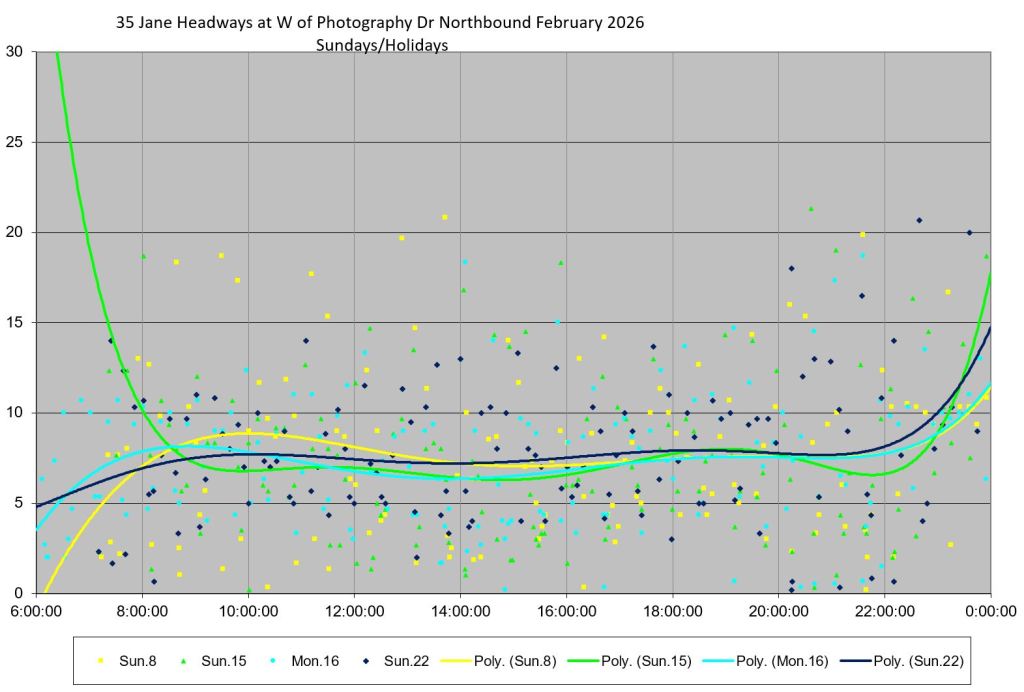
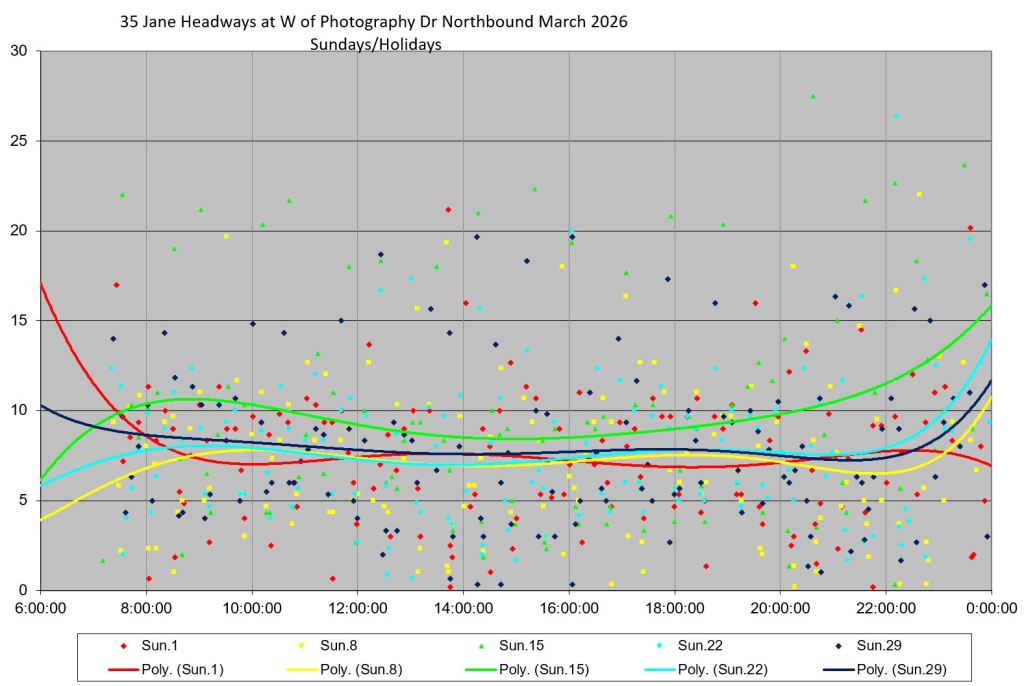
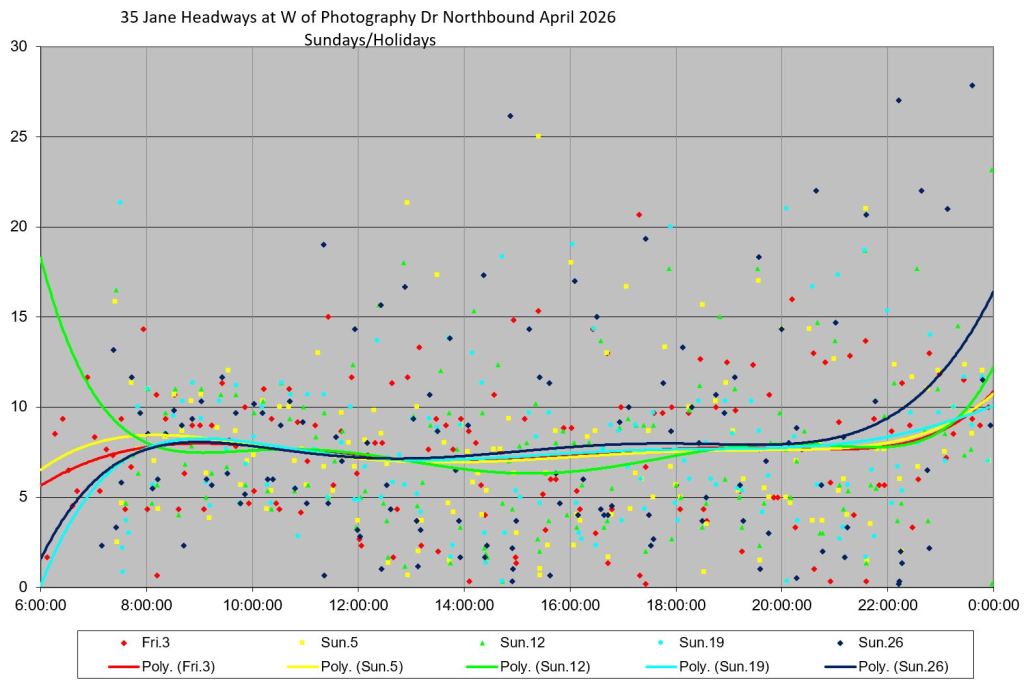
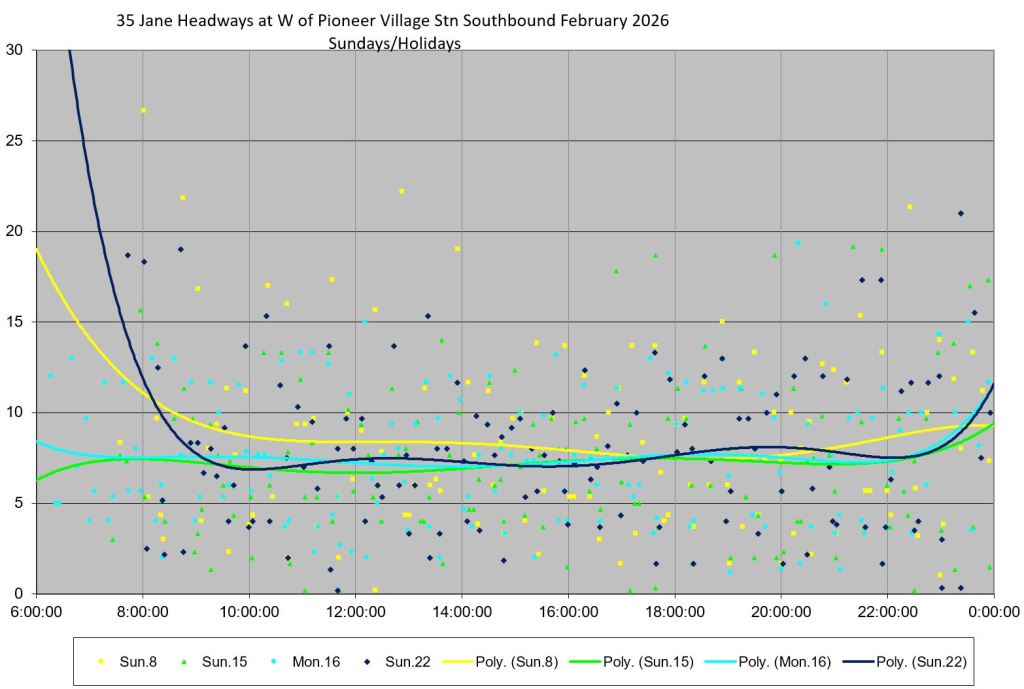
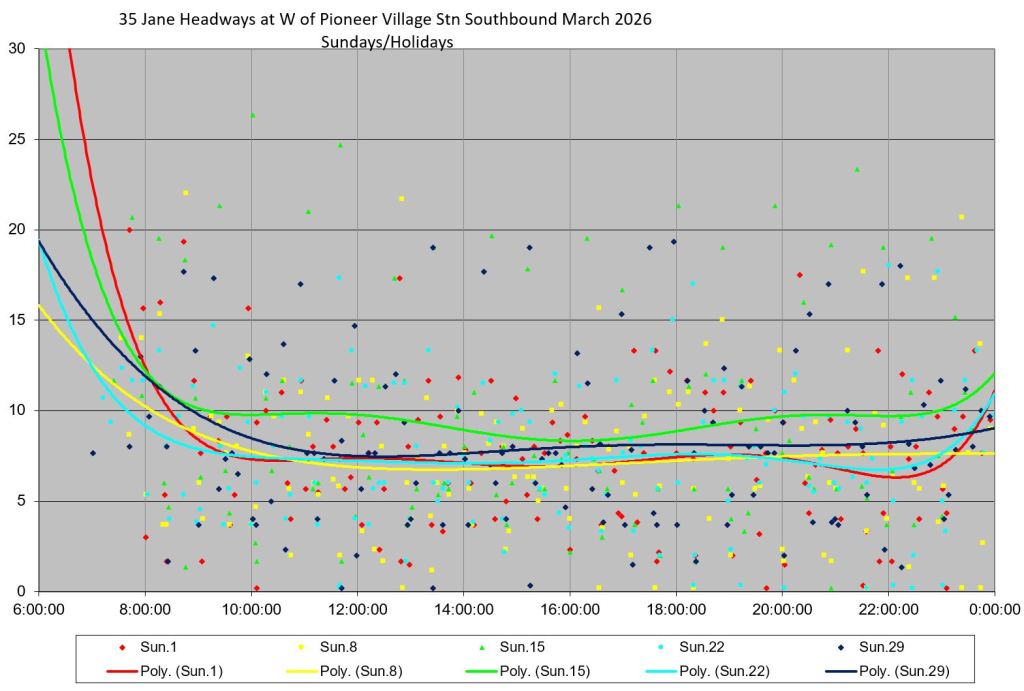
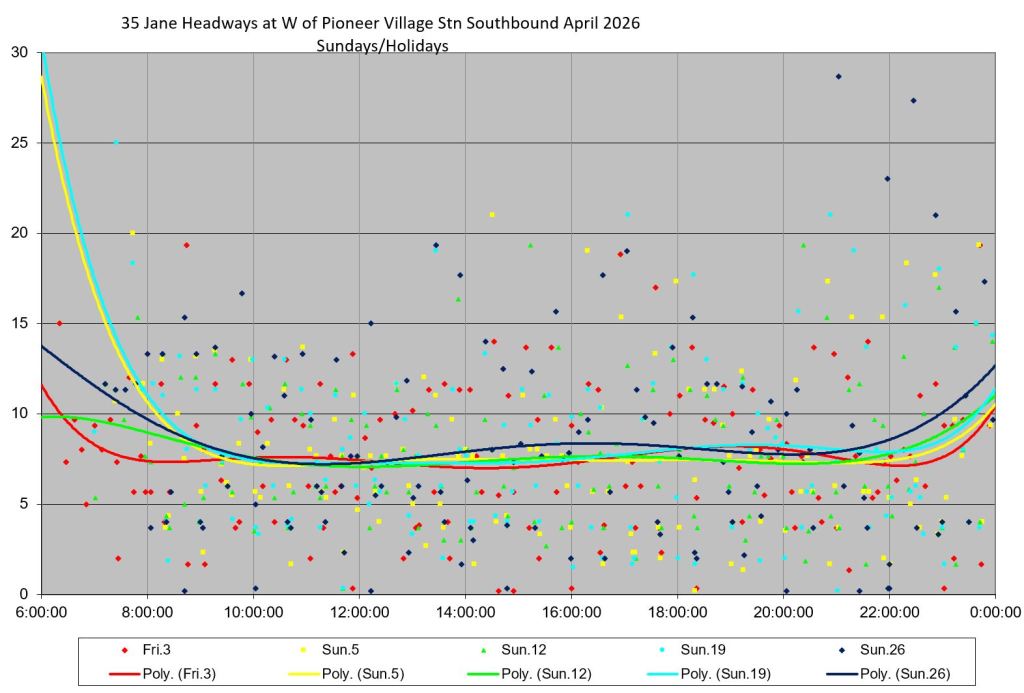
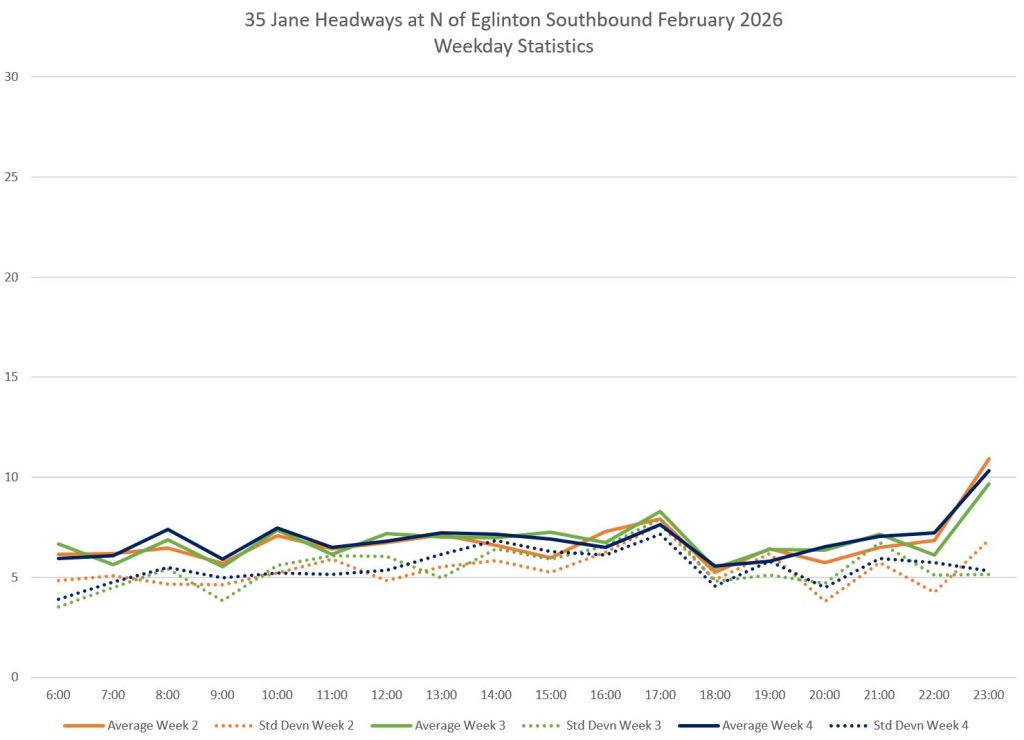
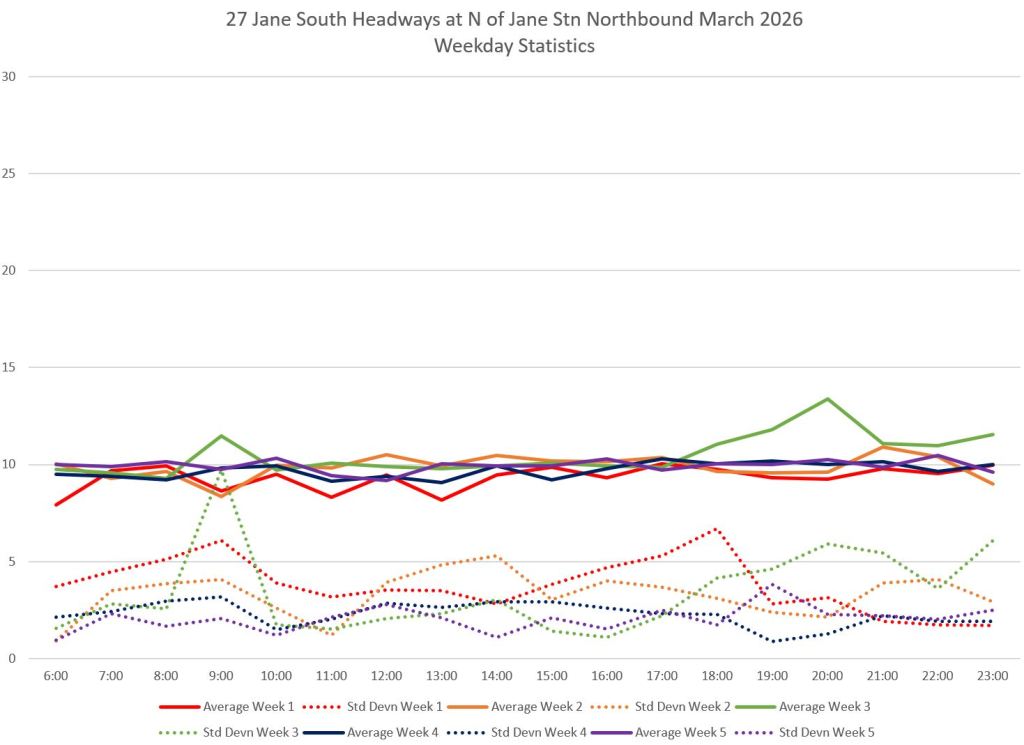
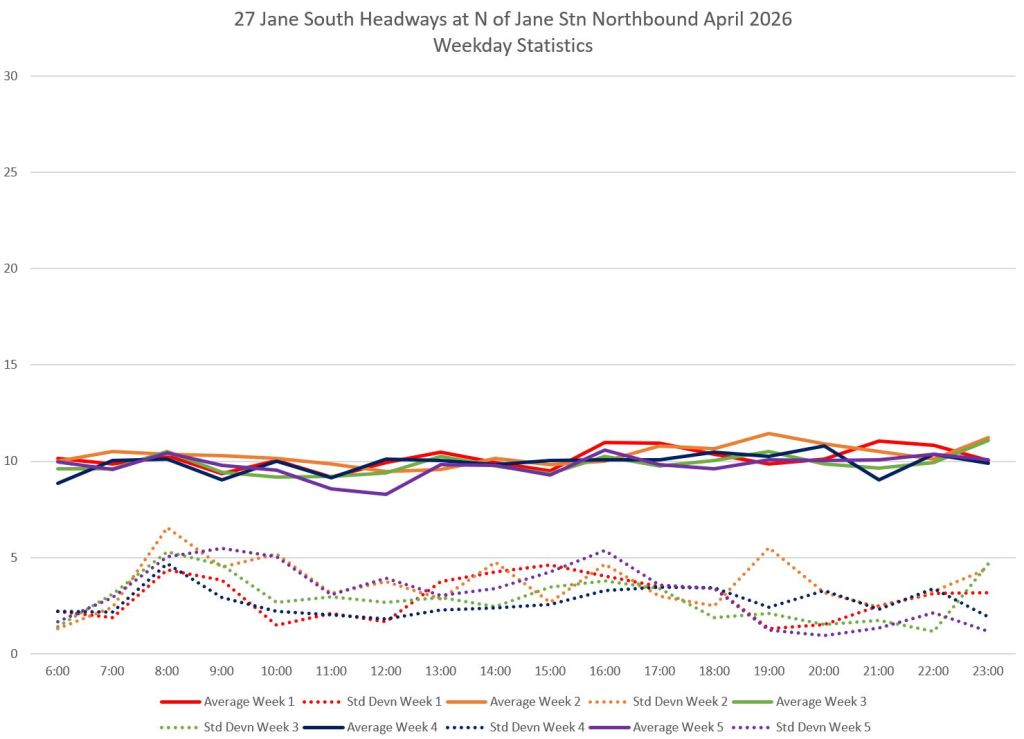
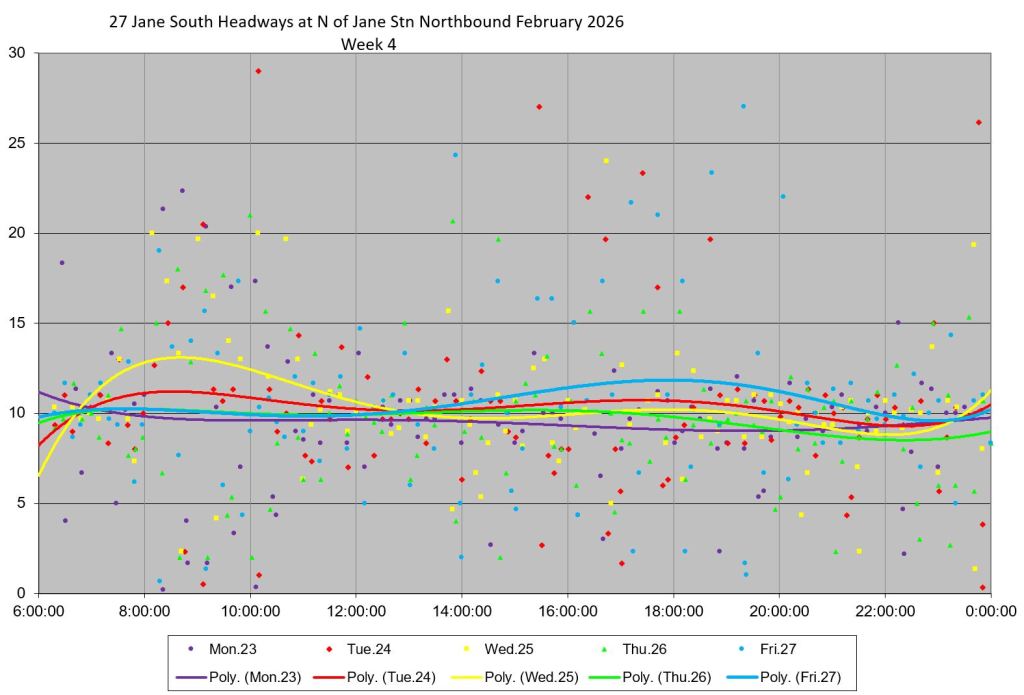
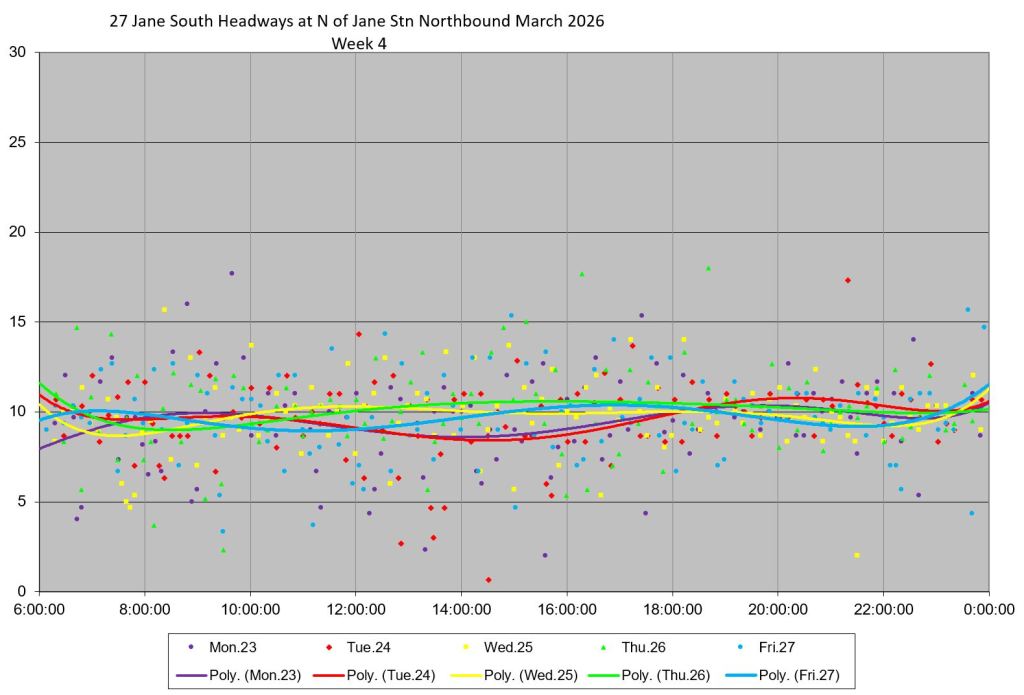
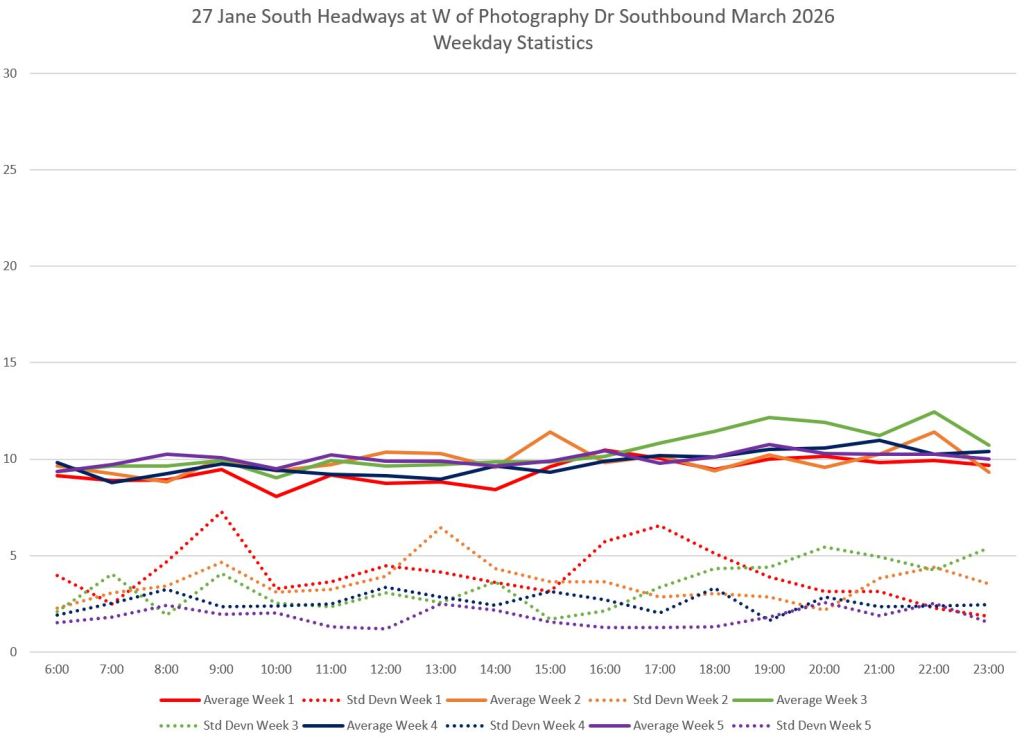
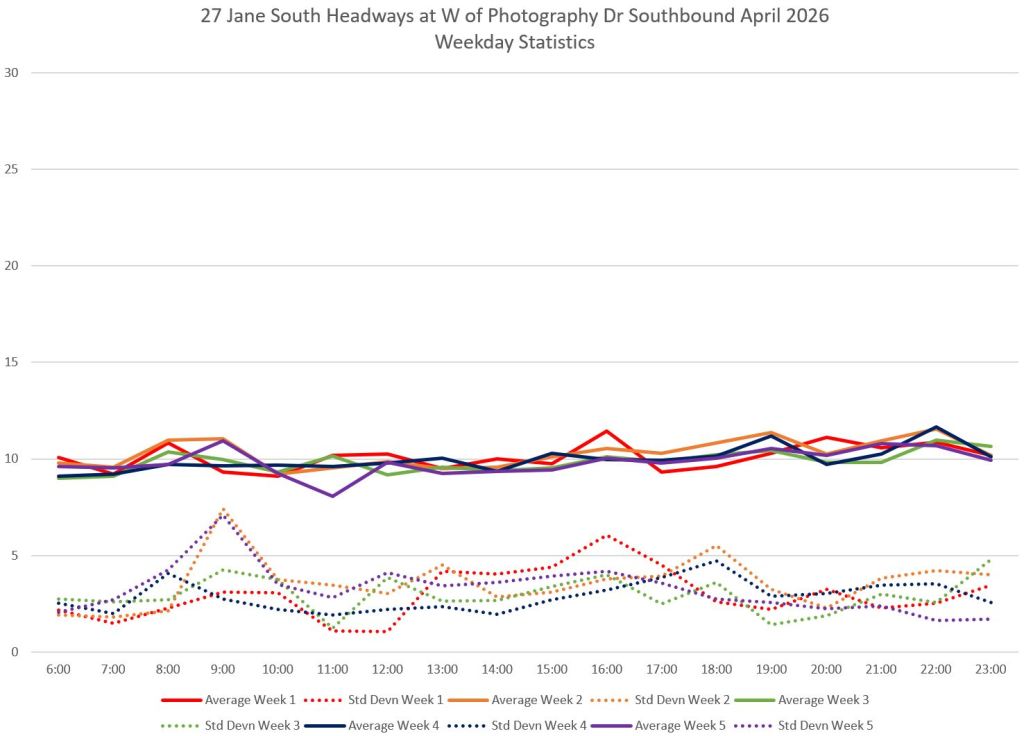
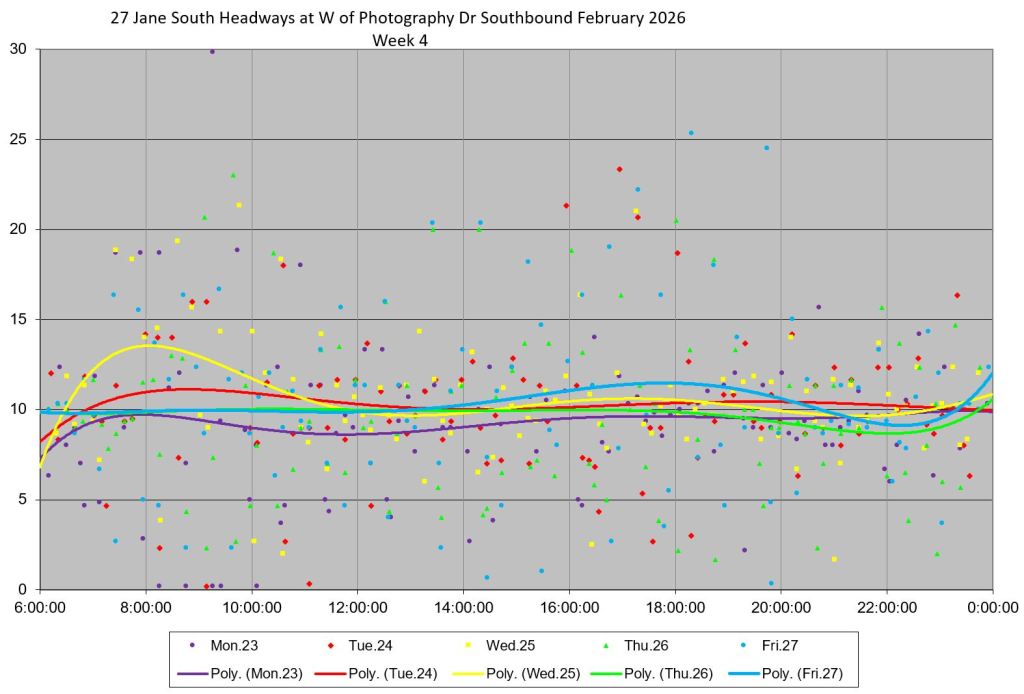
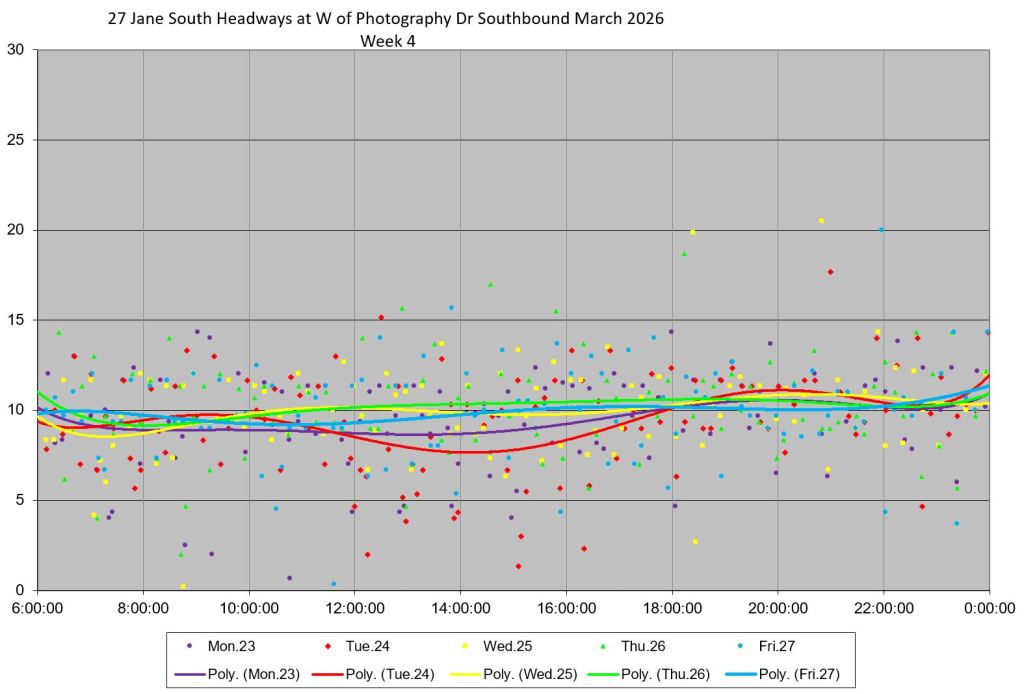
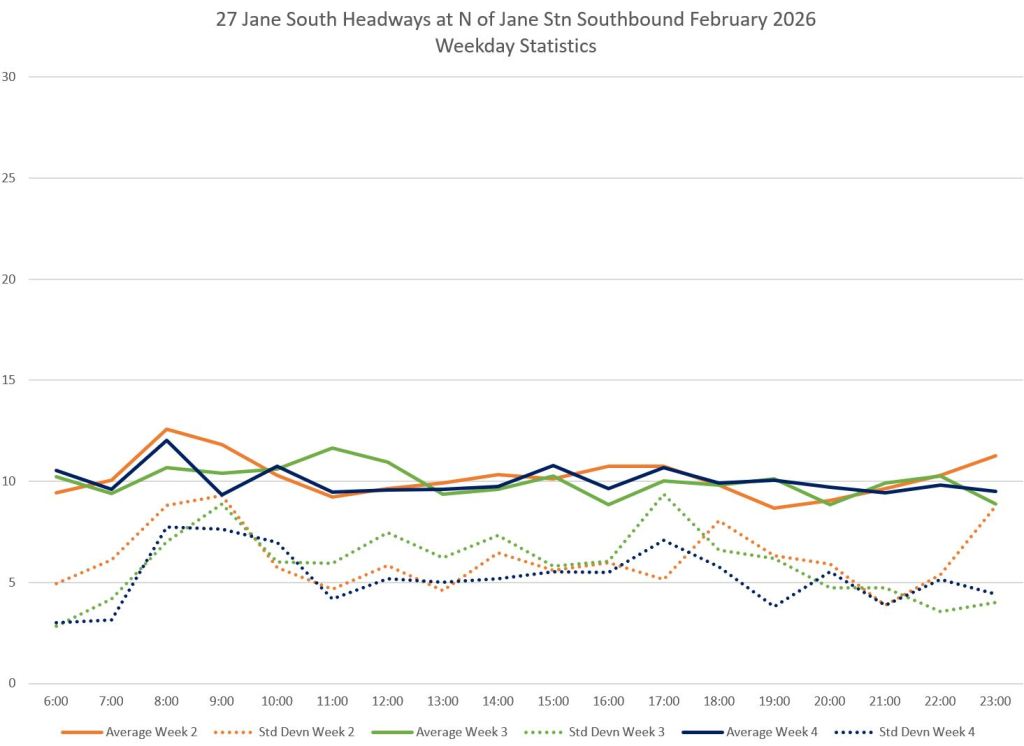
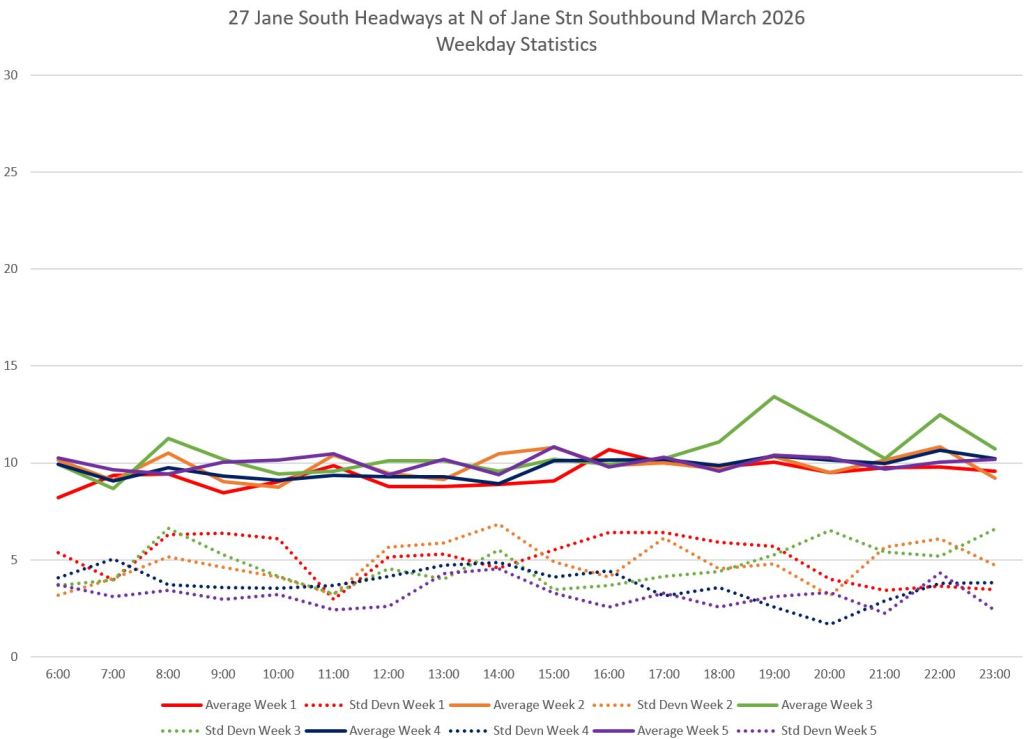
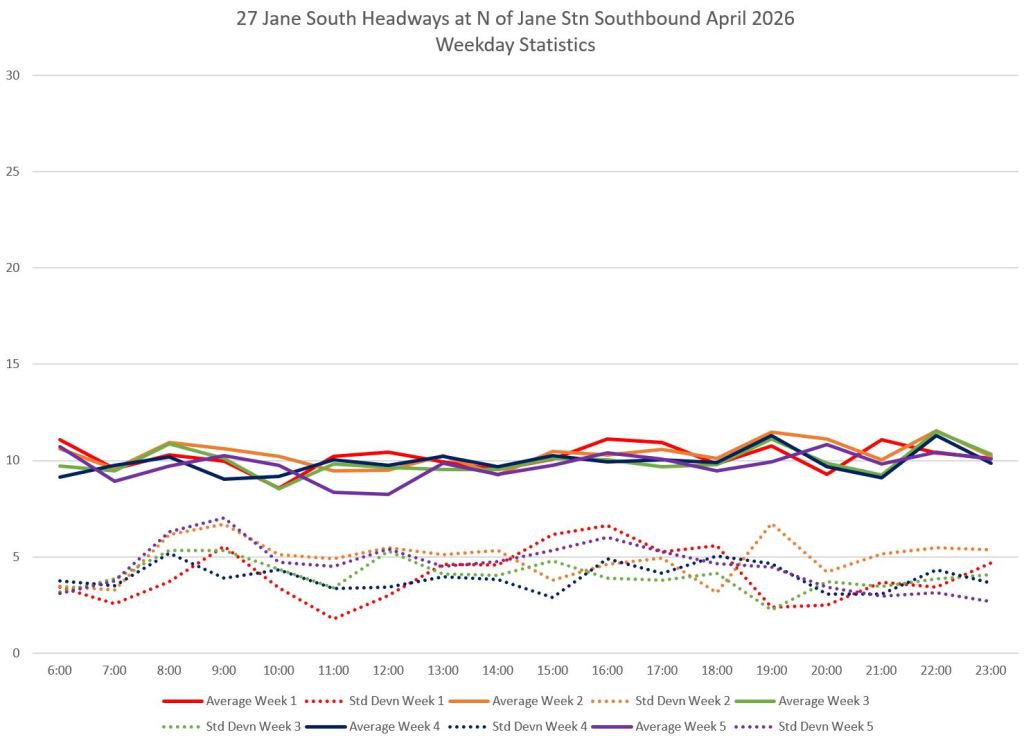
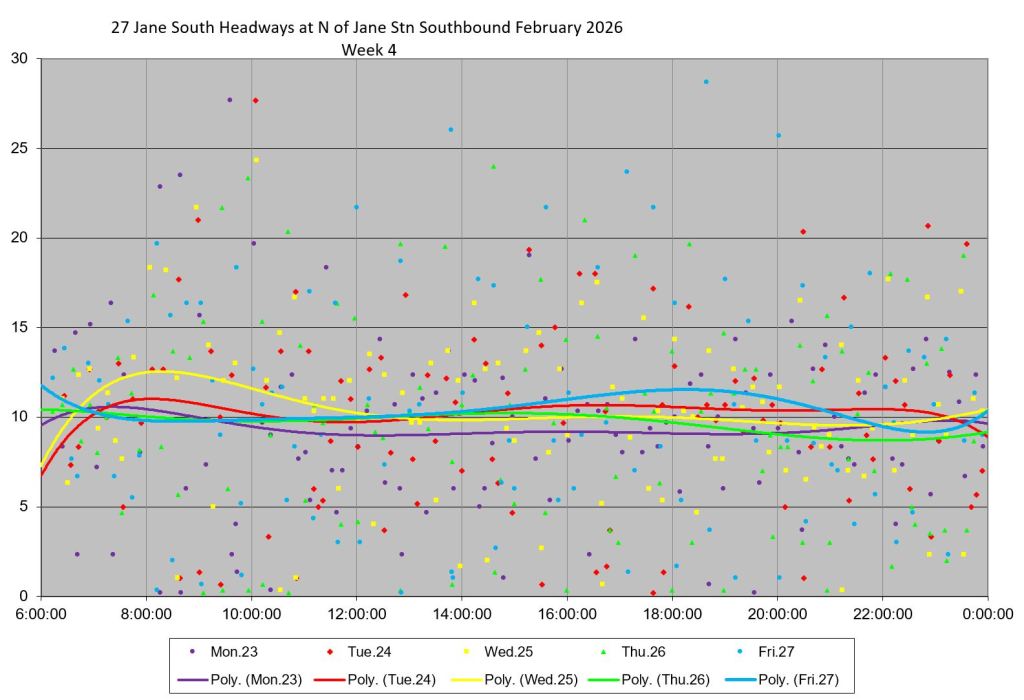
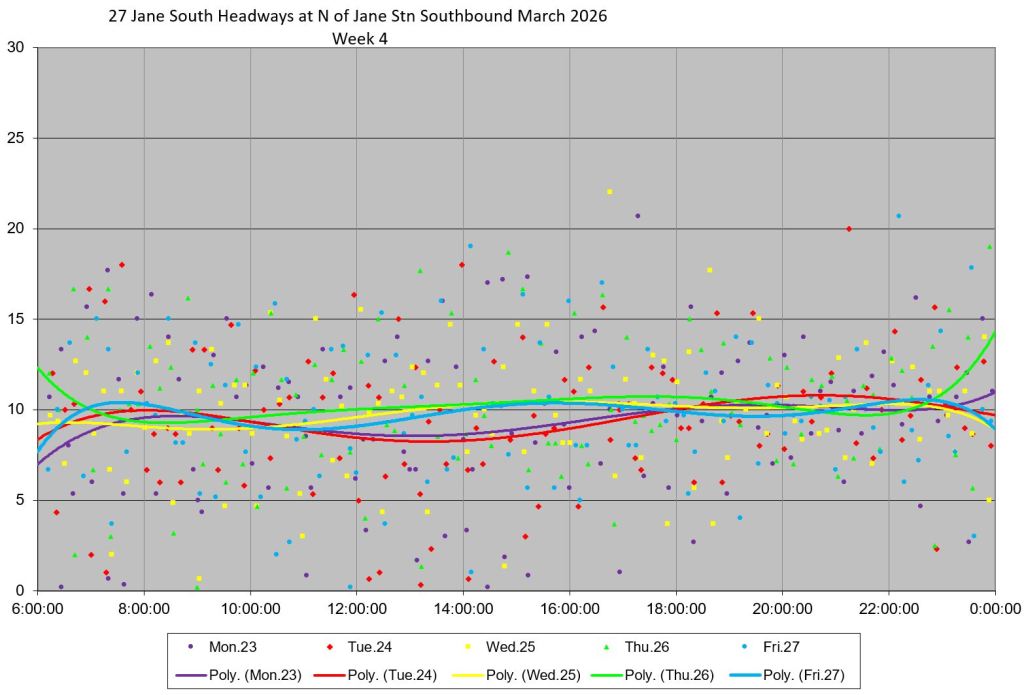
The charts in this section are arranged in three columns, one or each month from February to April 2026. There are four rows containing:
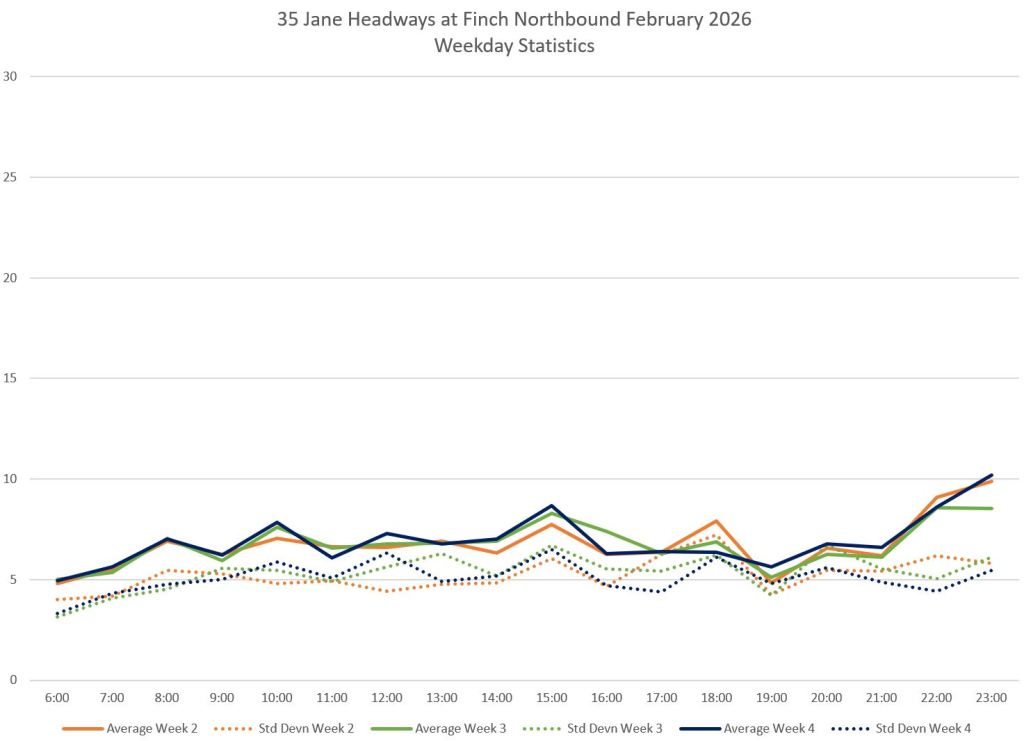
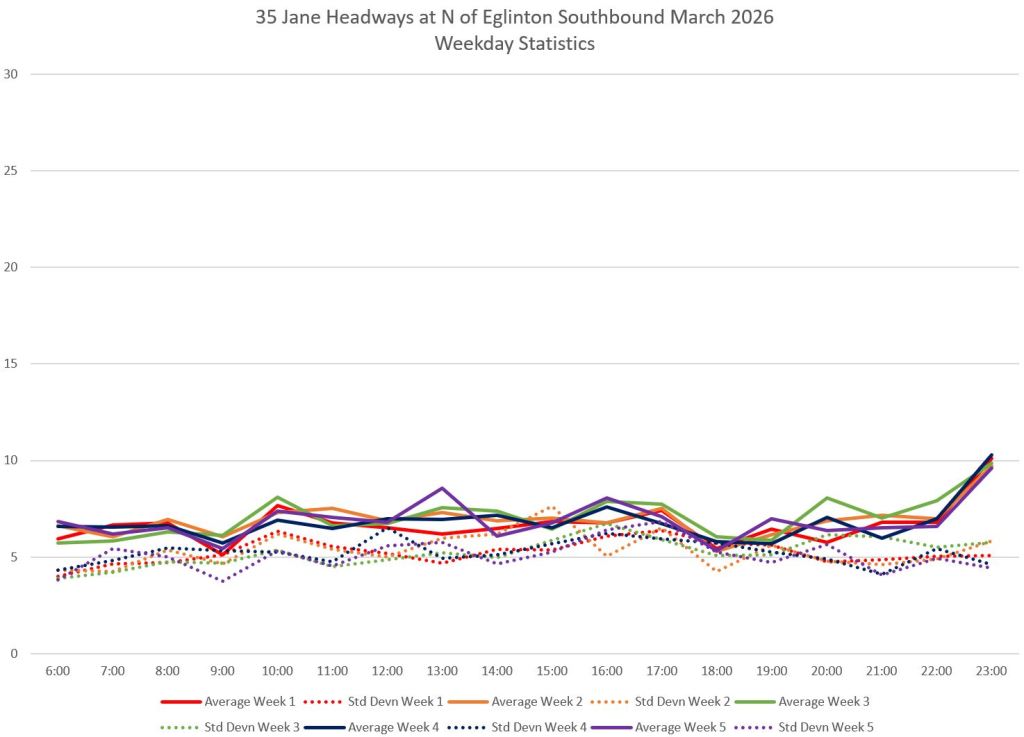
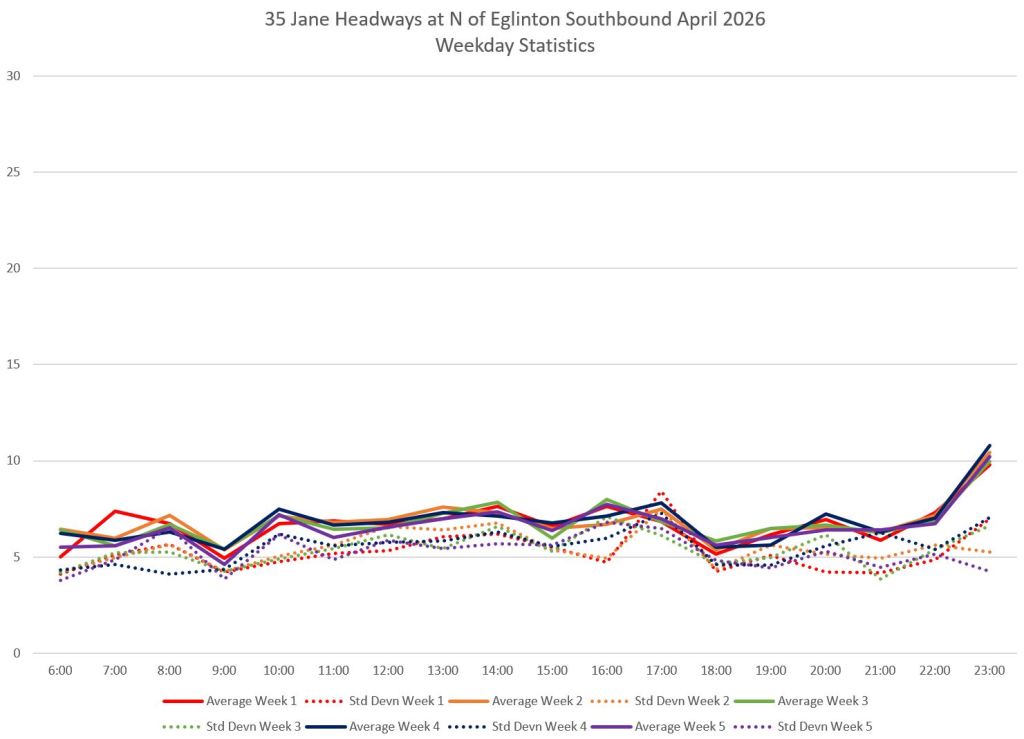
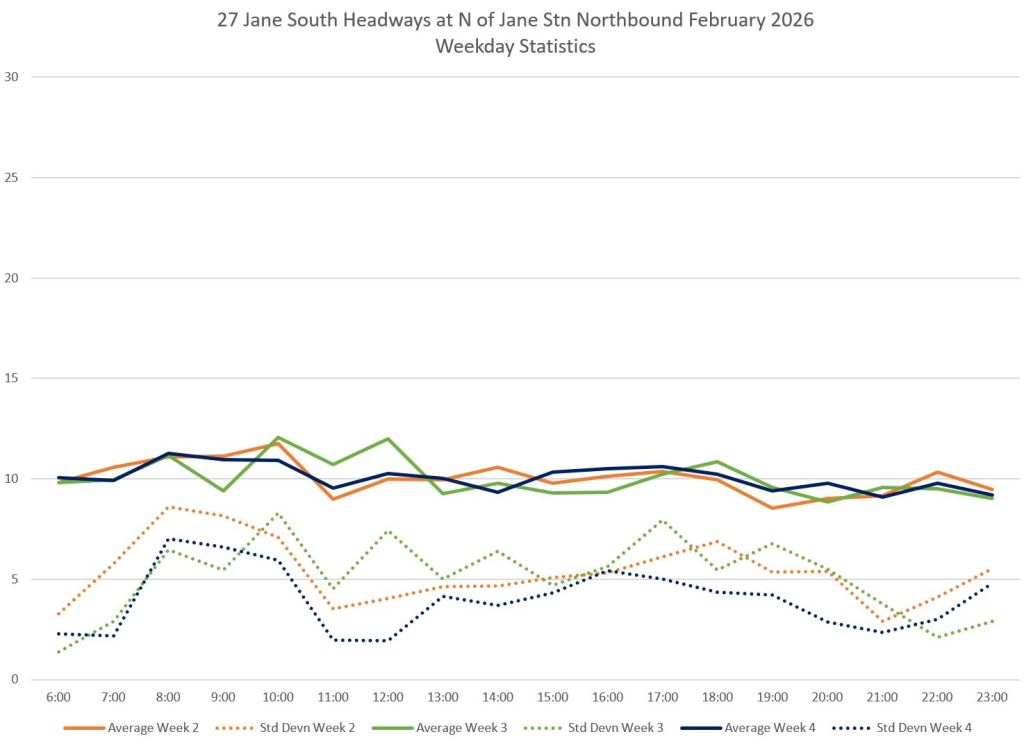
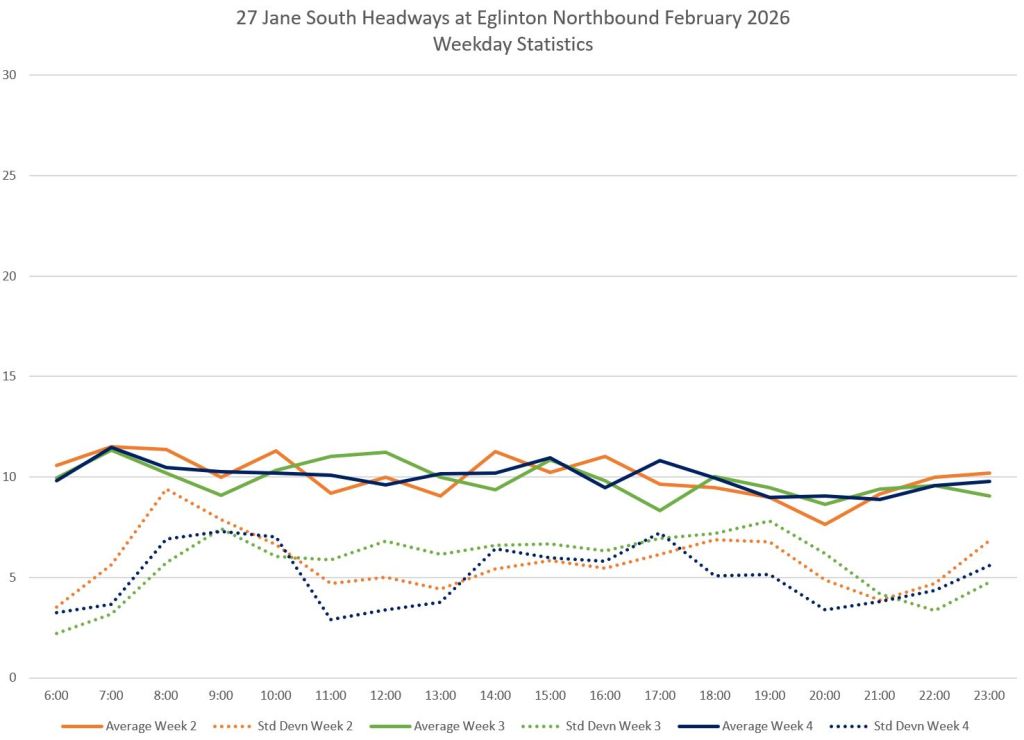
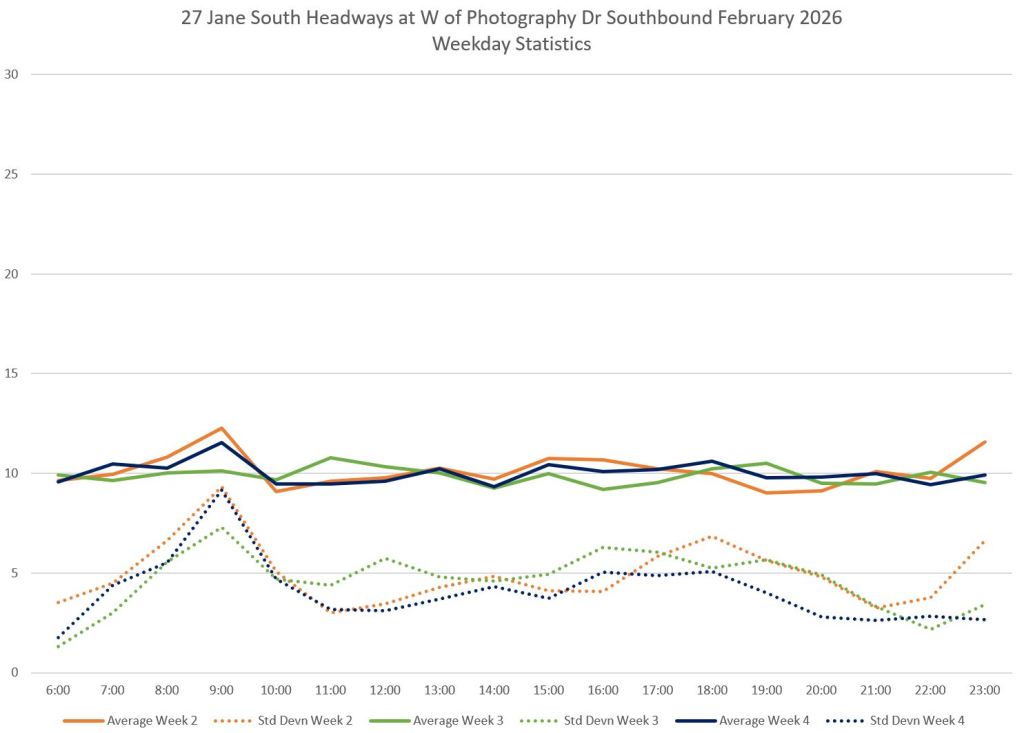
- Overall weekday statistics showing average headways by week and hour, and standard deviations (a measure of how scattered the values are).
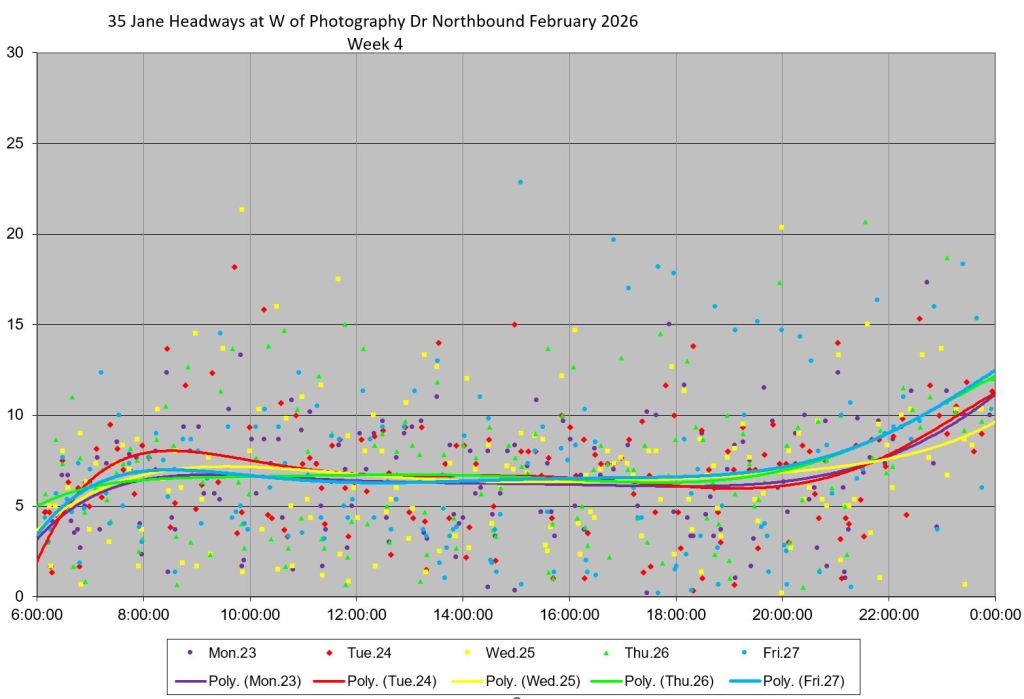
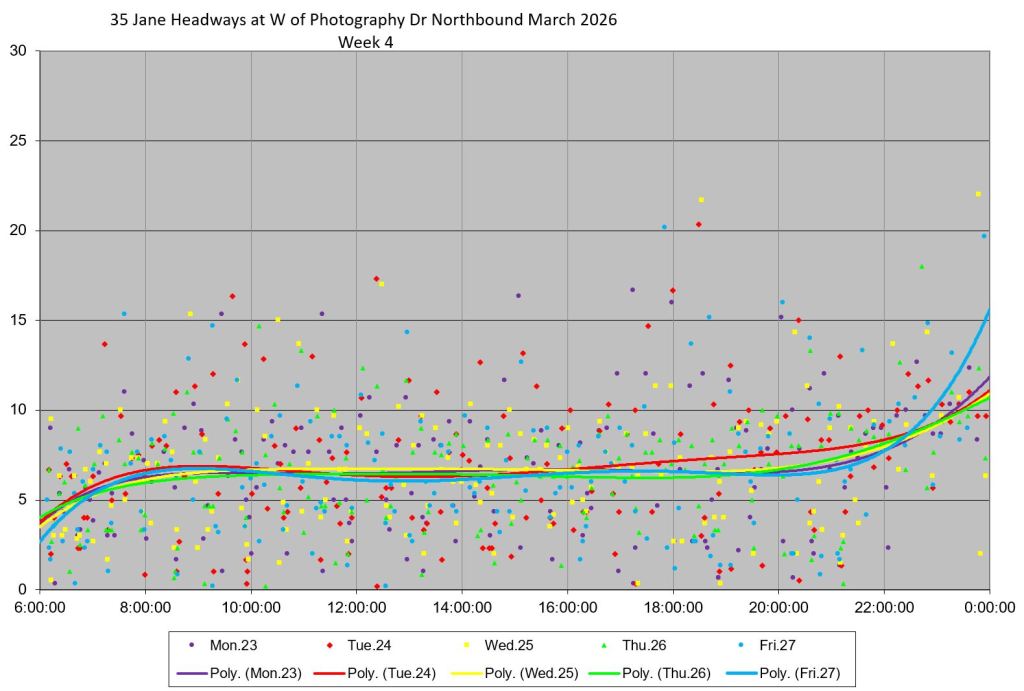
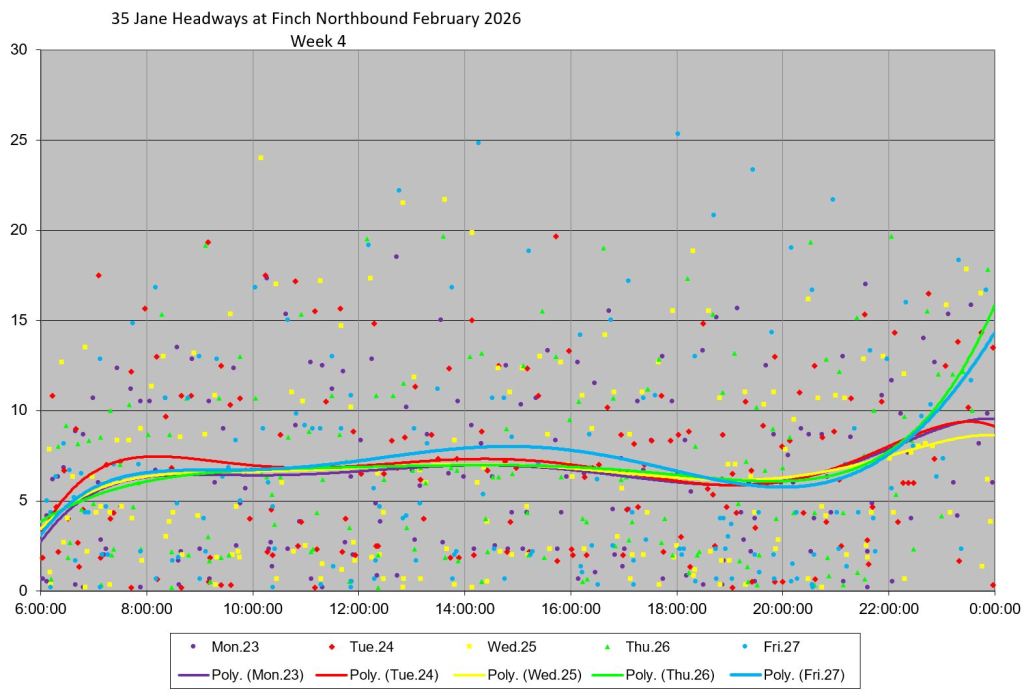
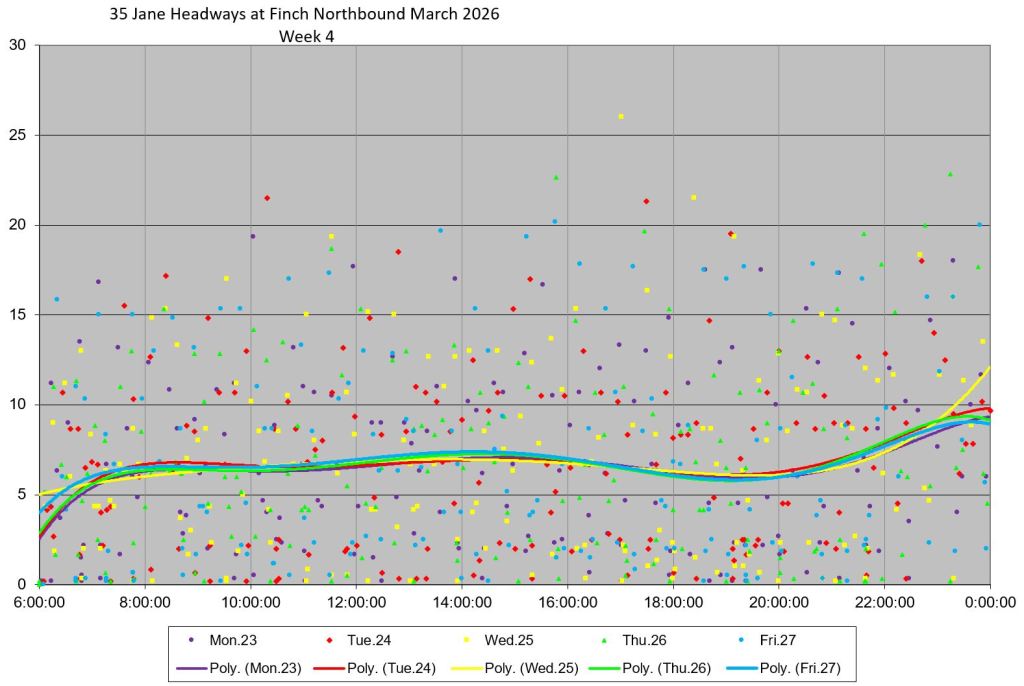
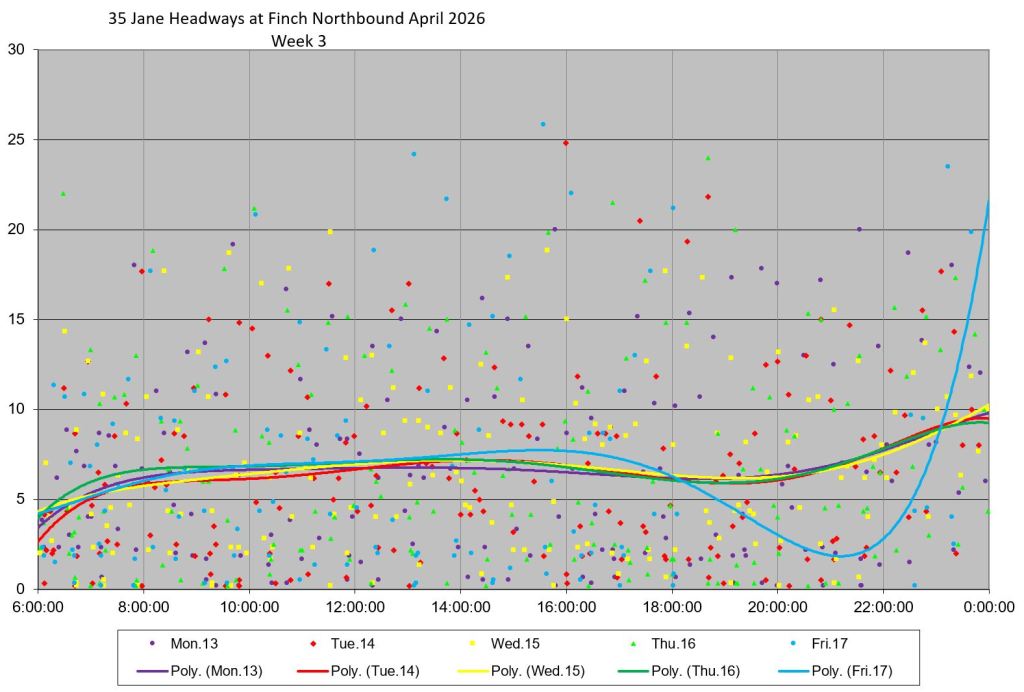
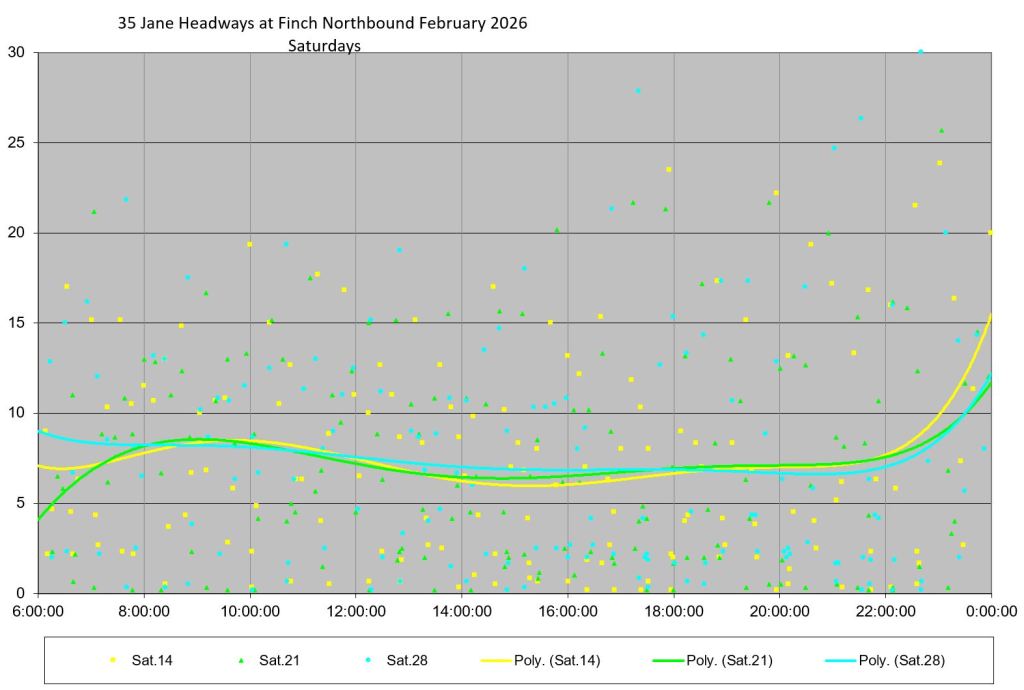
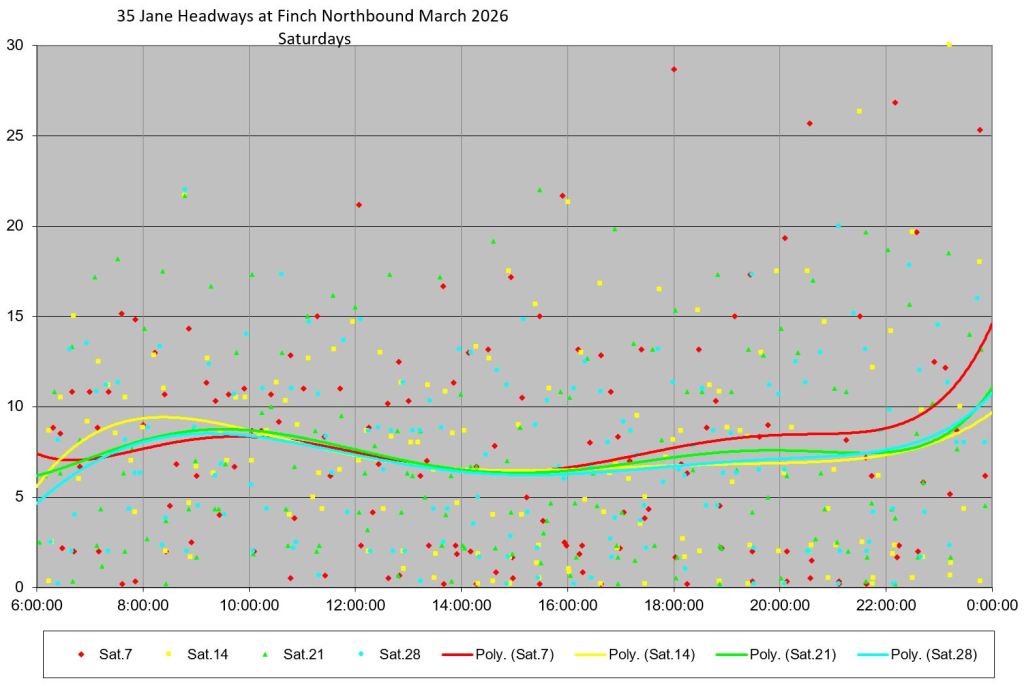
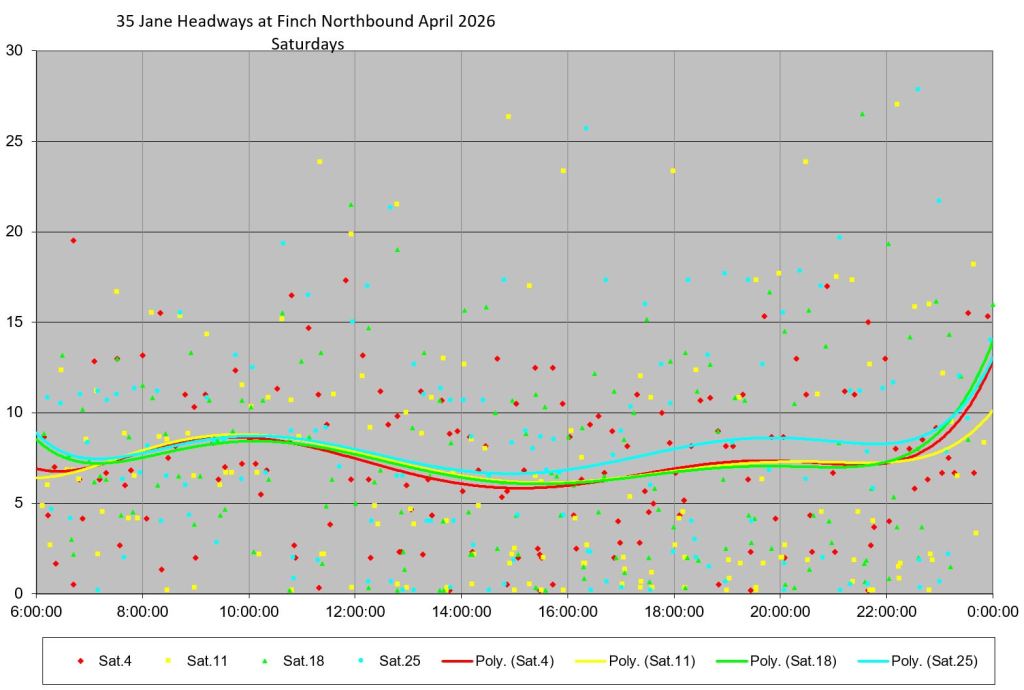
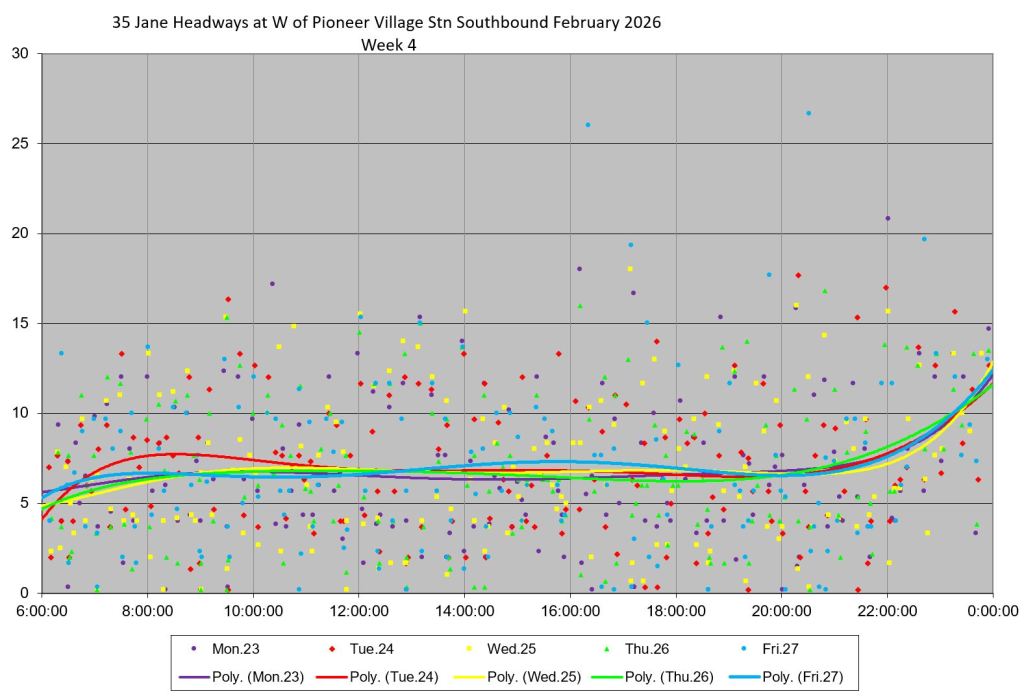
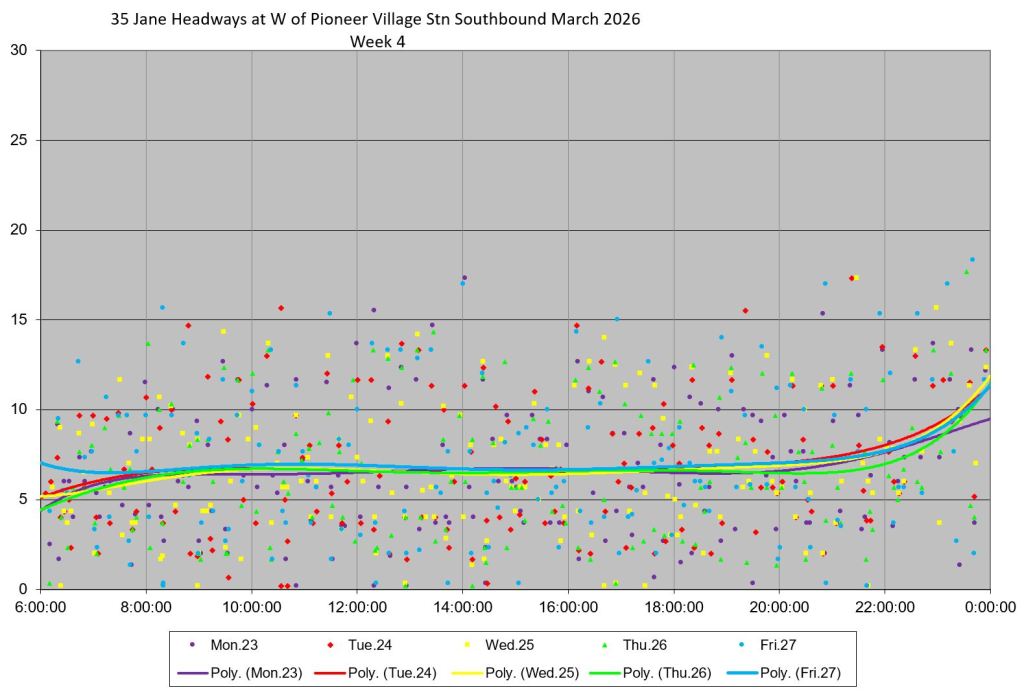
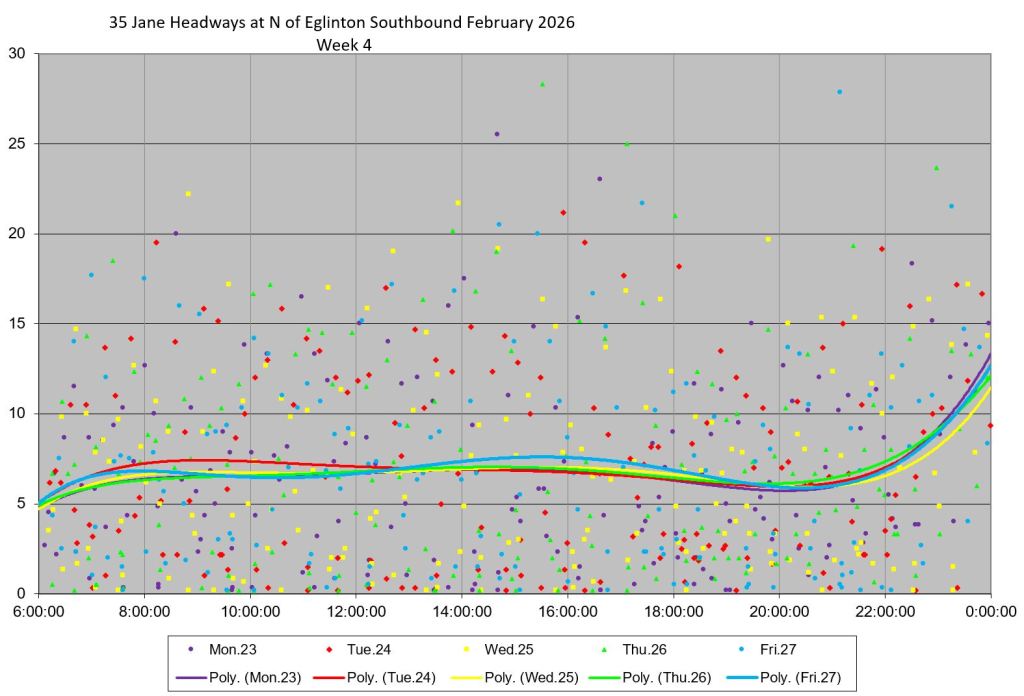
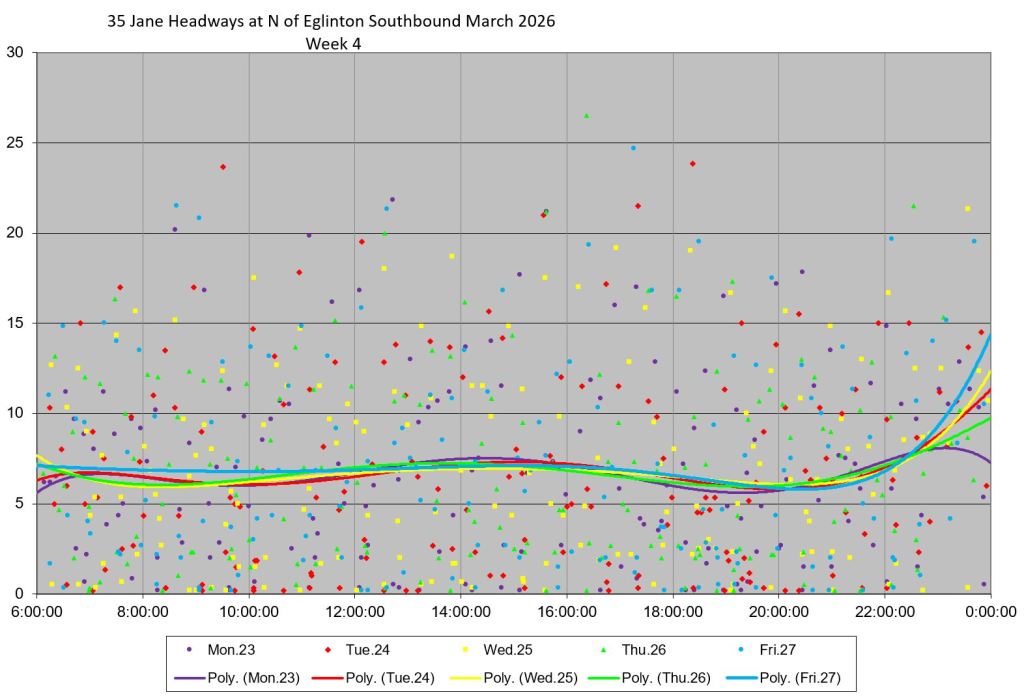
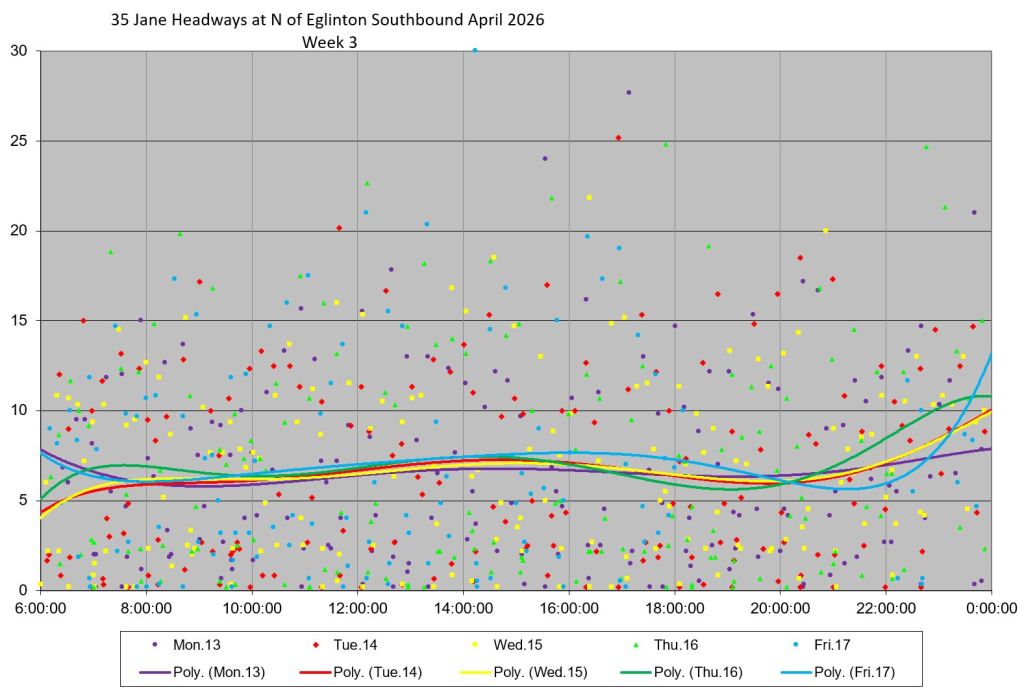
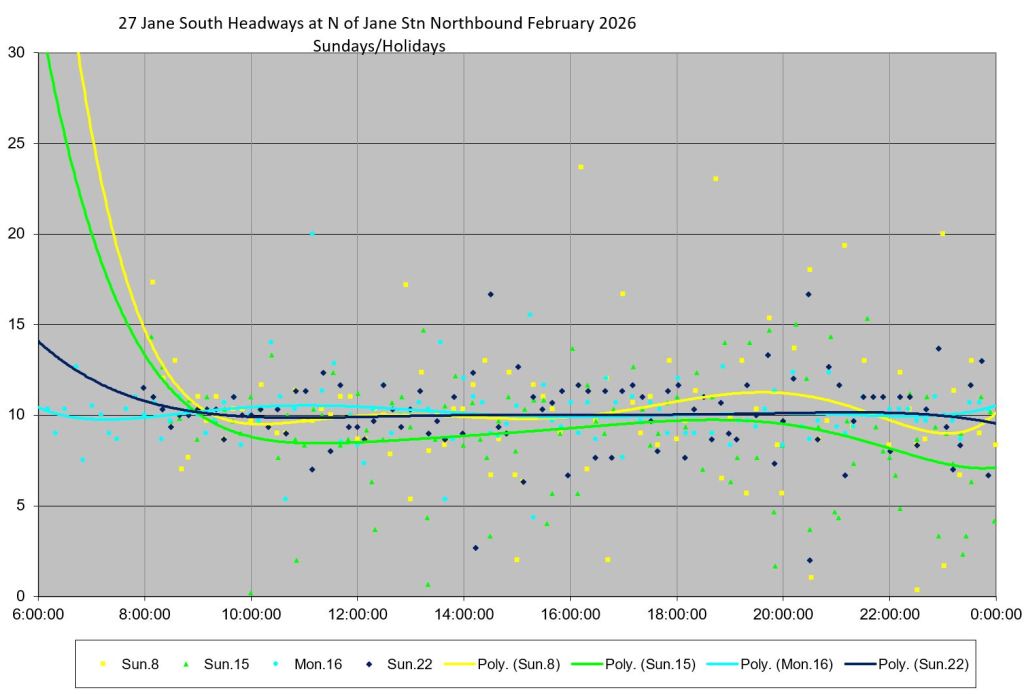
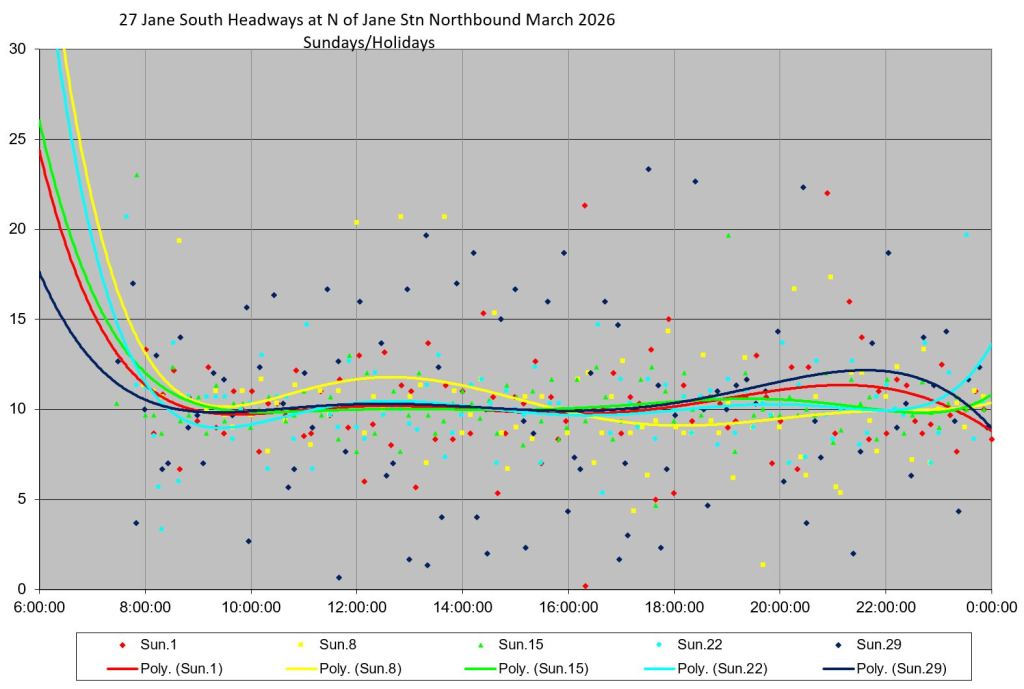
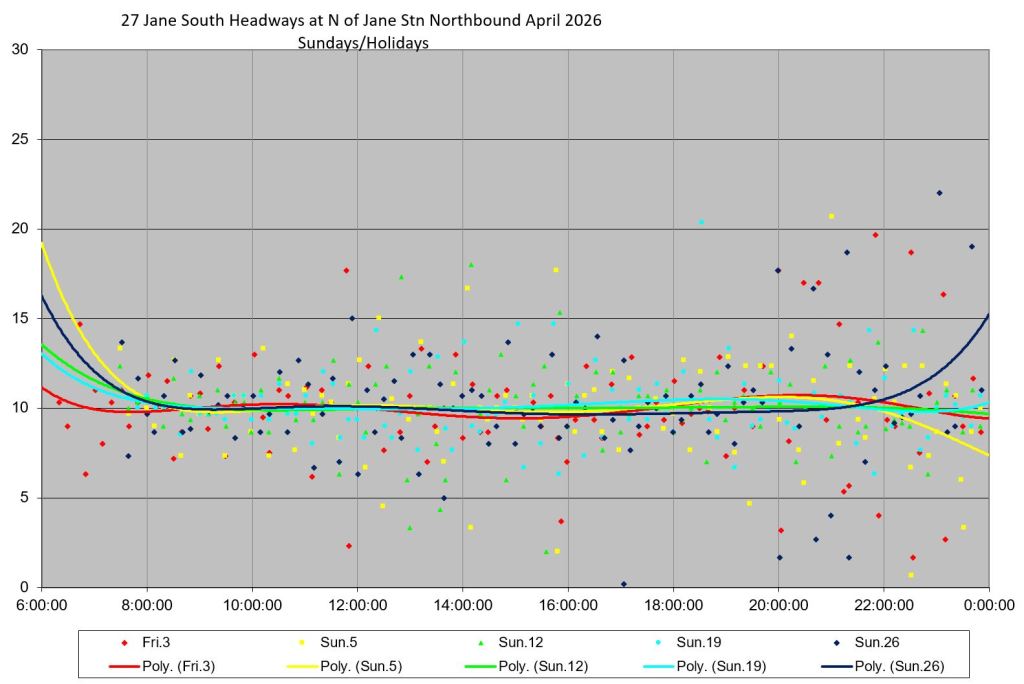
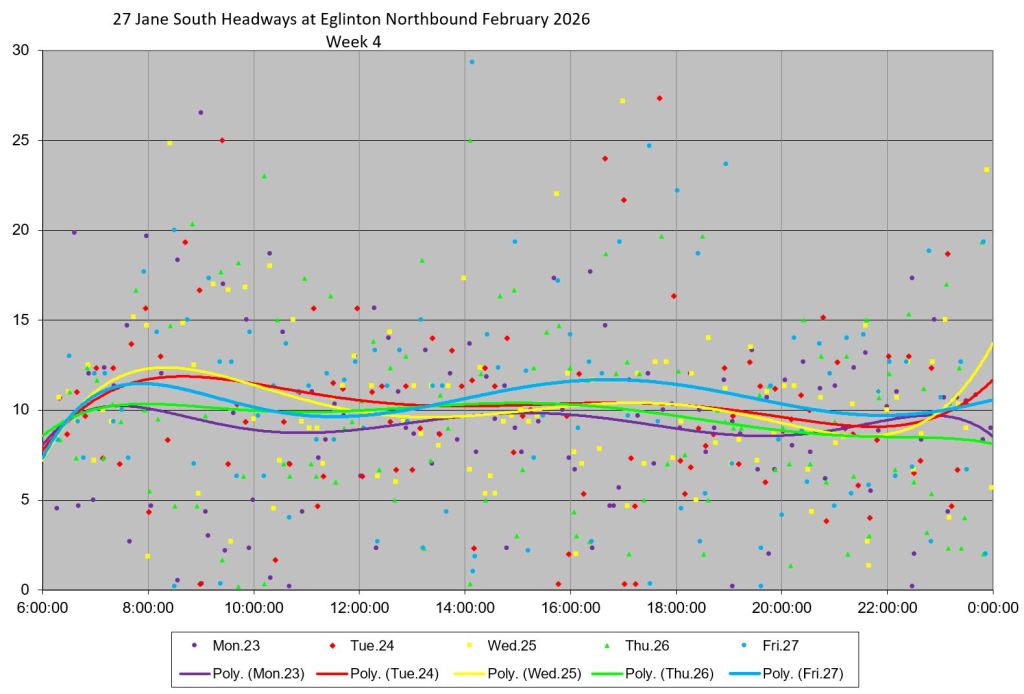
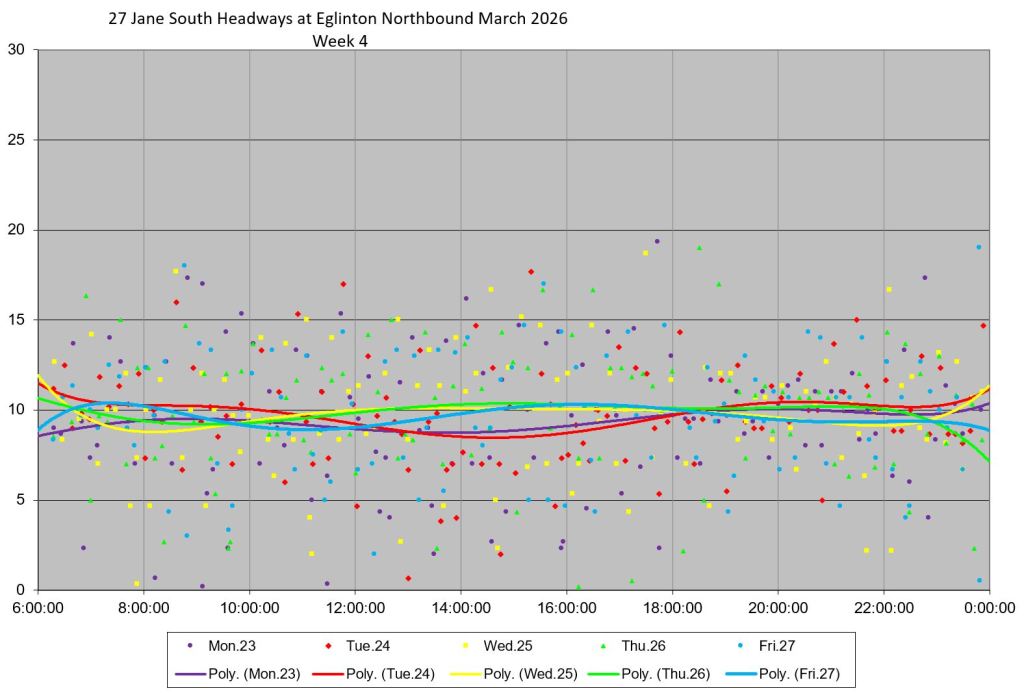
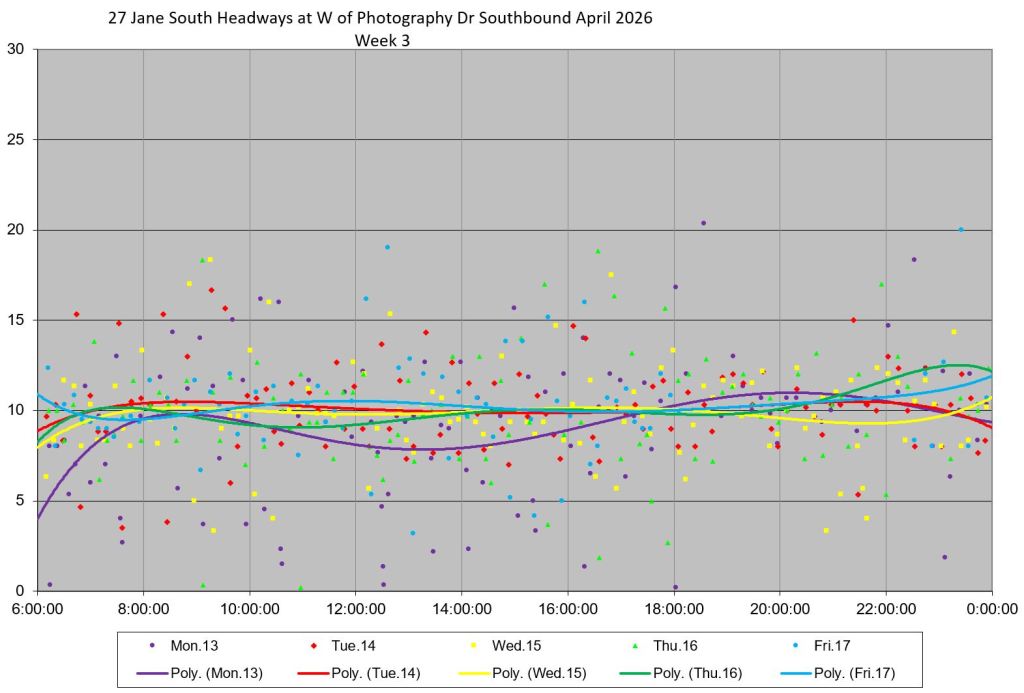
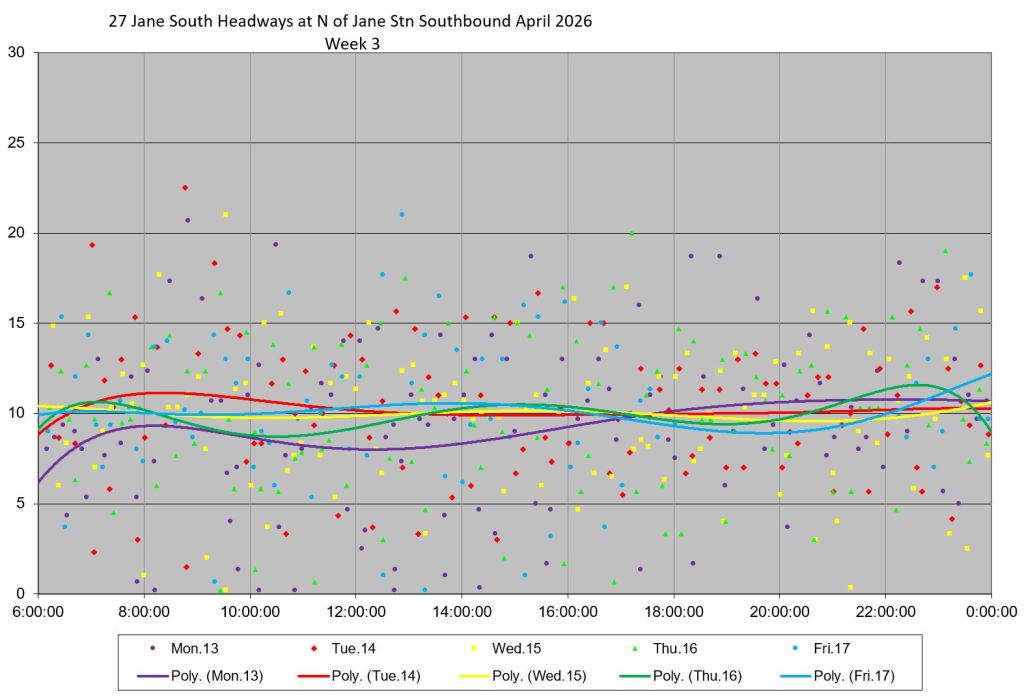
- A detailed chart showing headways in one week within the month. The weeks have been chosen to avoid statutory holidays (Family Day, Good Friday) and the mid-March break lull. Dots show individual trips and trend lines show the general movement of values.
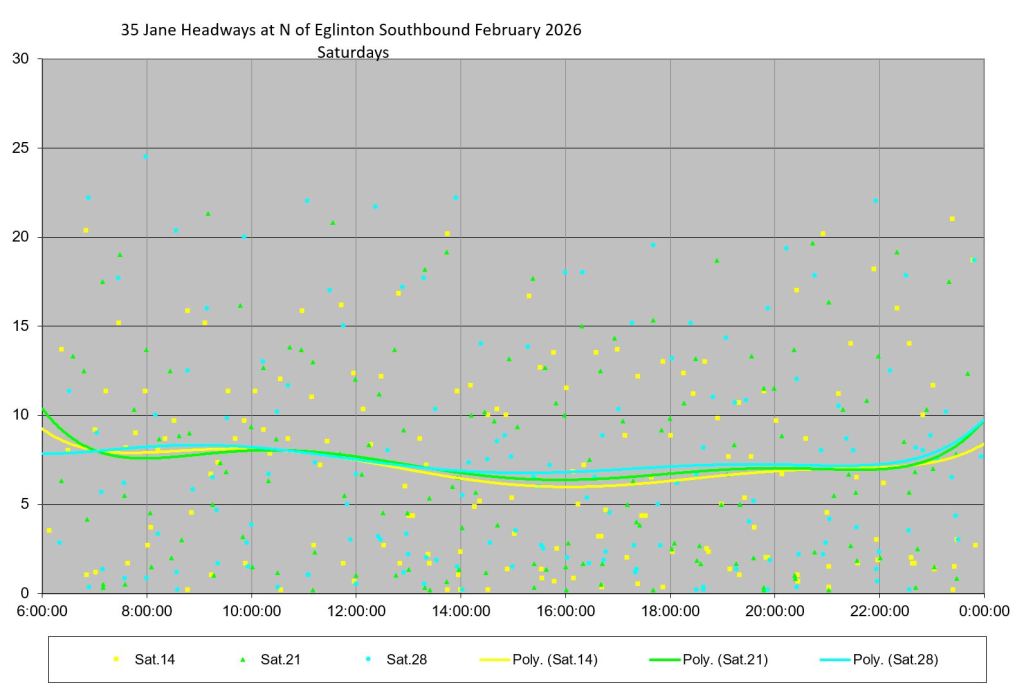
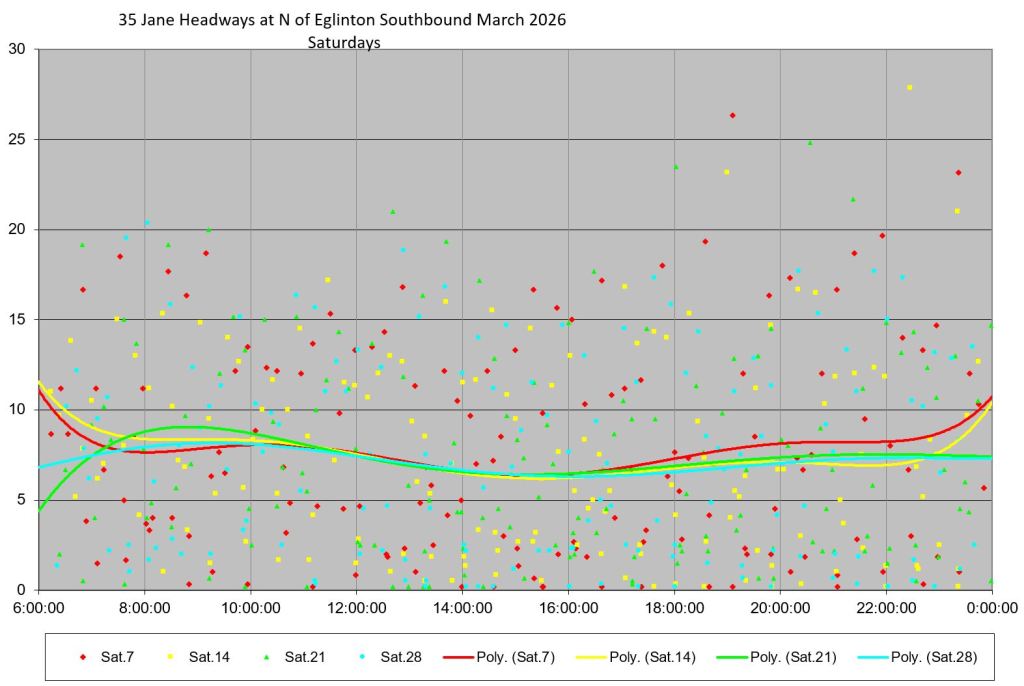
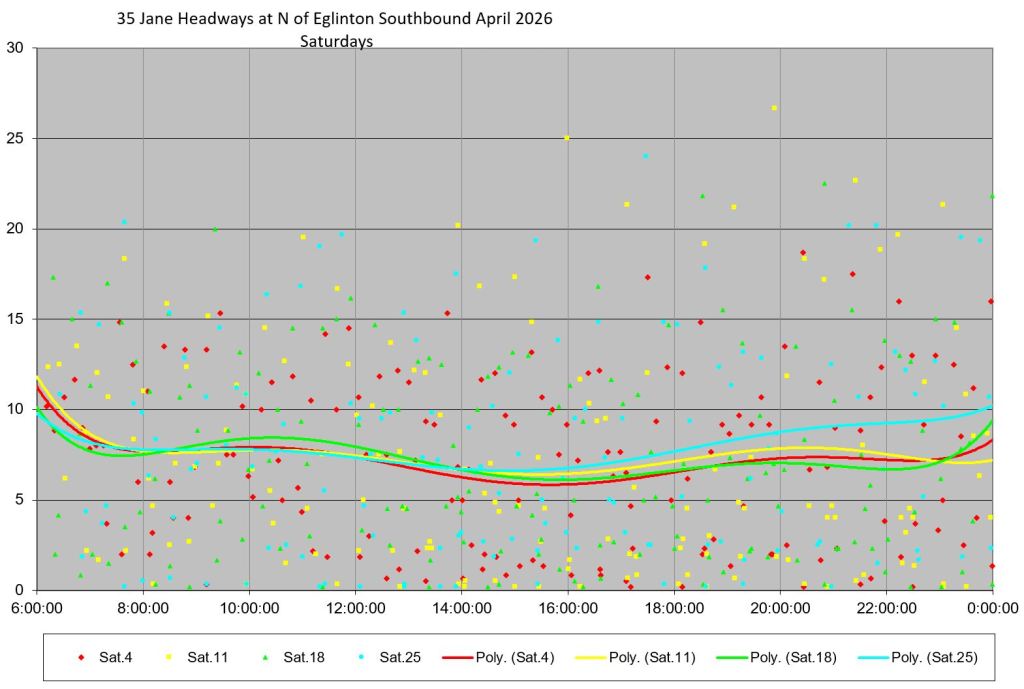
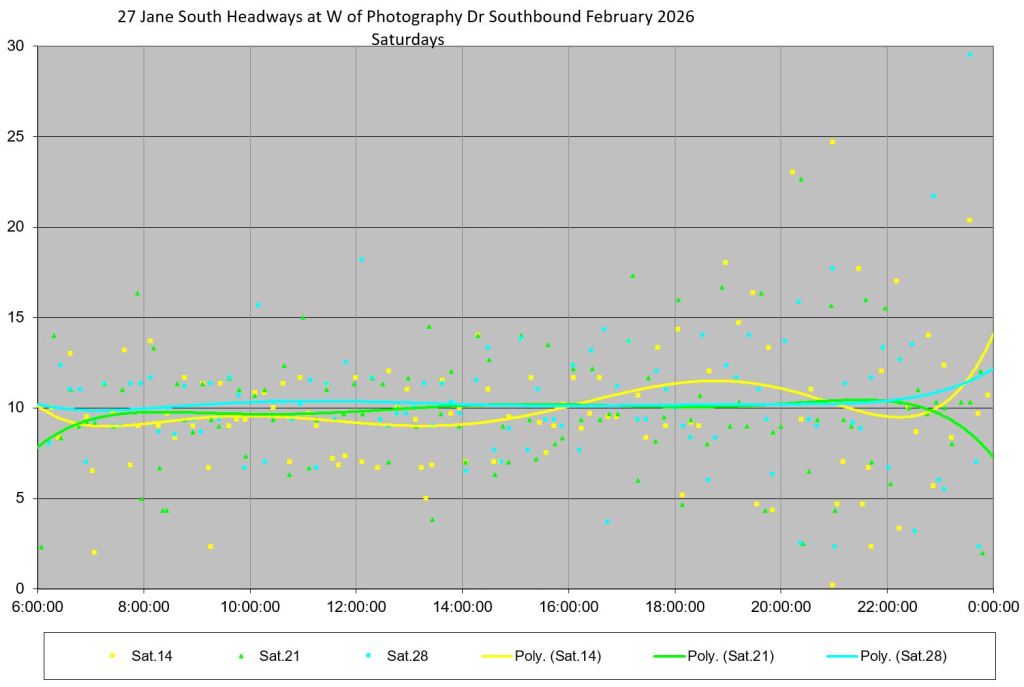
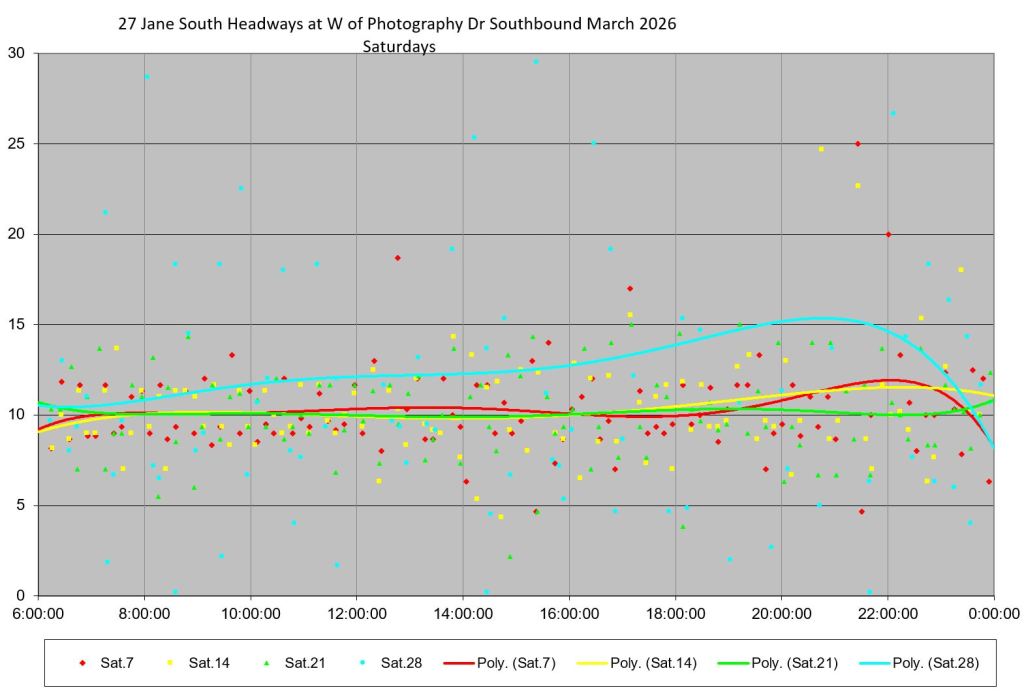
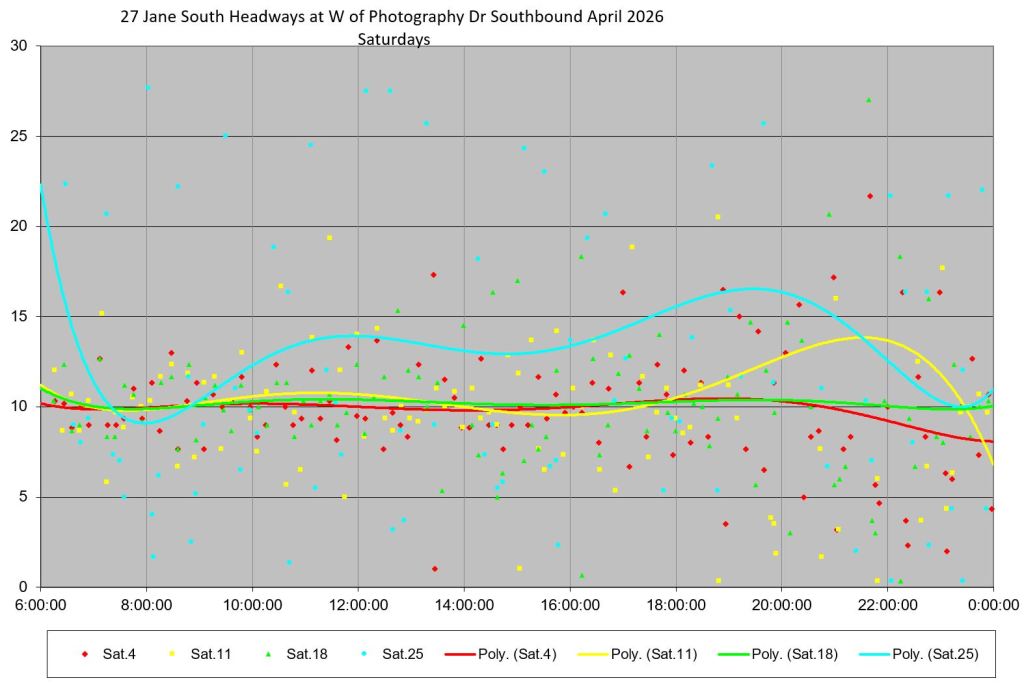
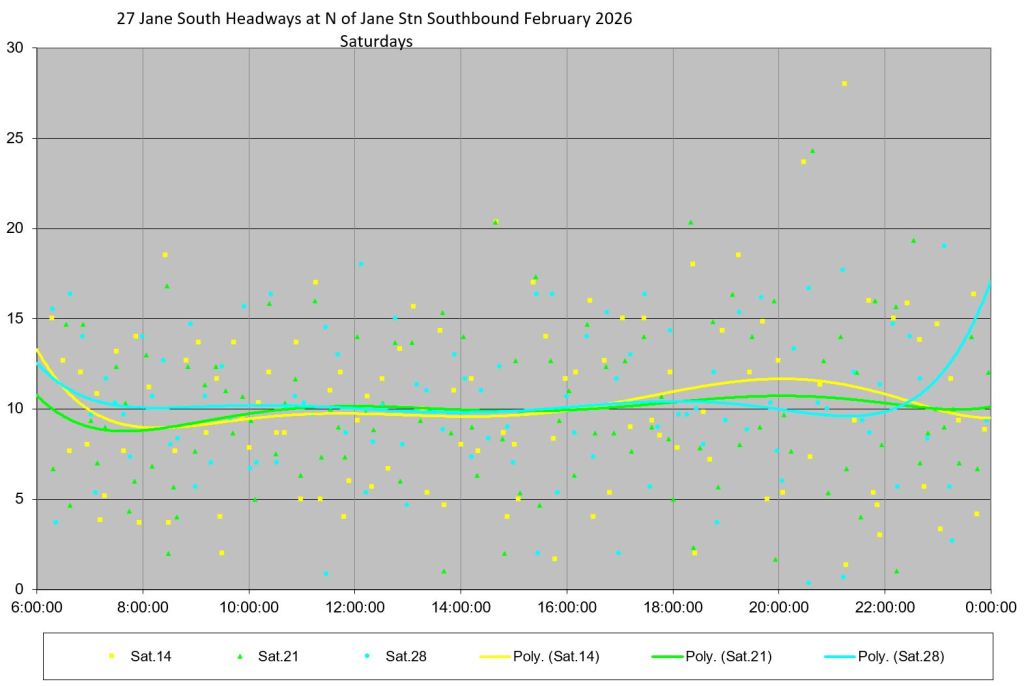
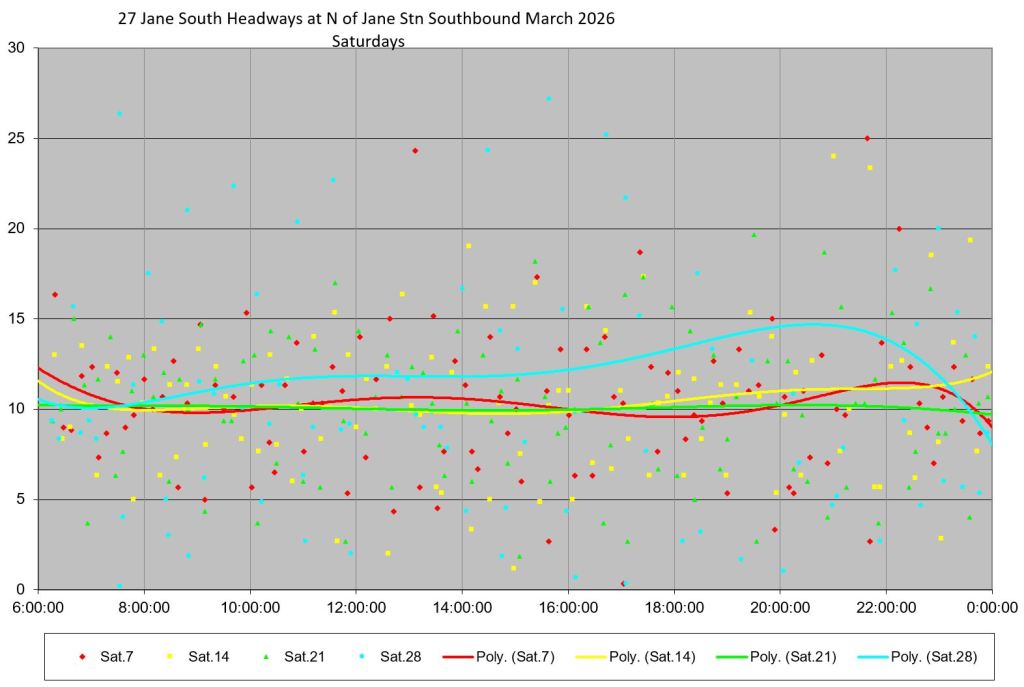
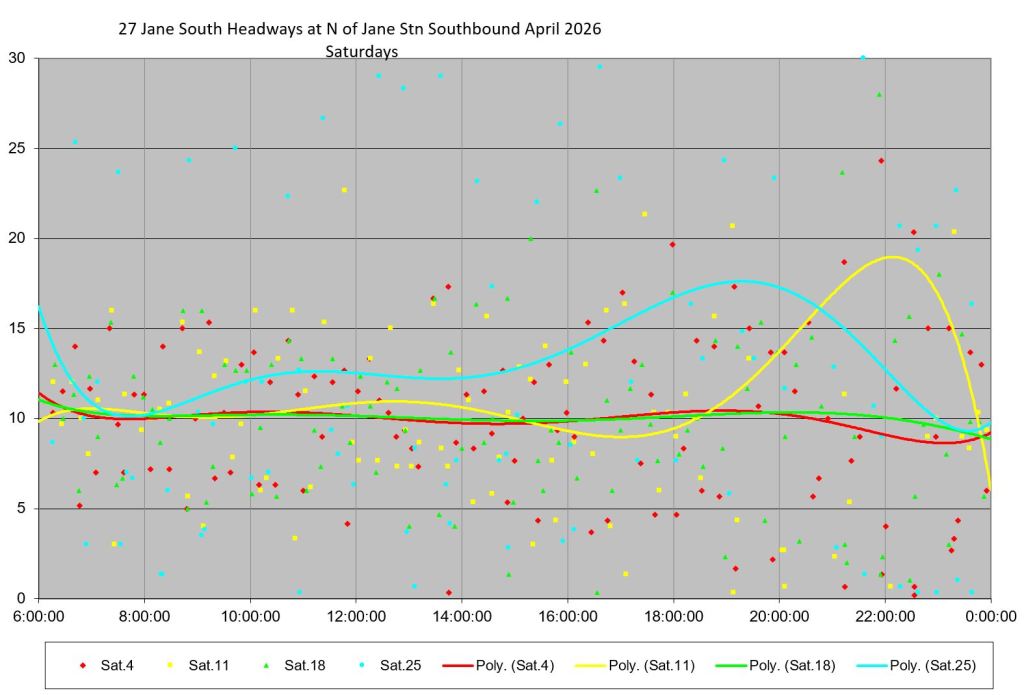
- A detailed chart showing Saturday headways in the same format as the weekday chart.
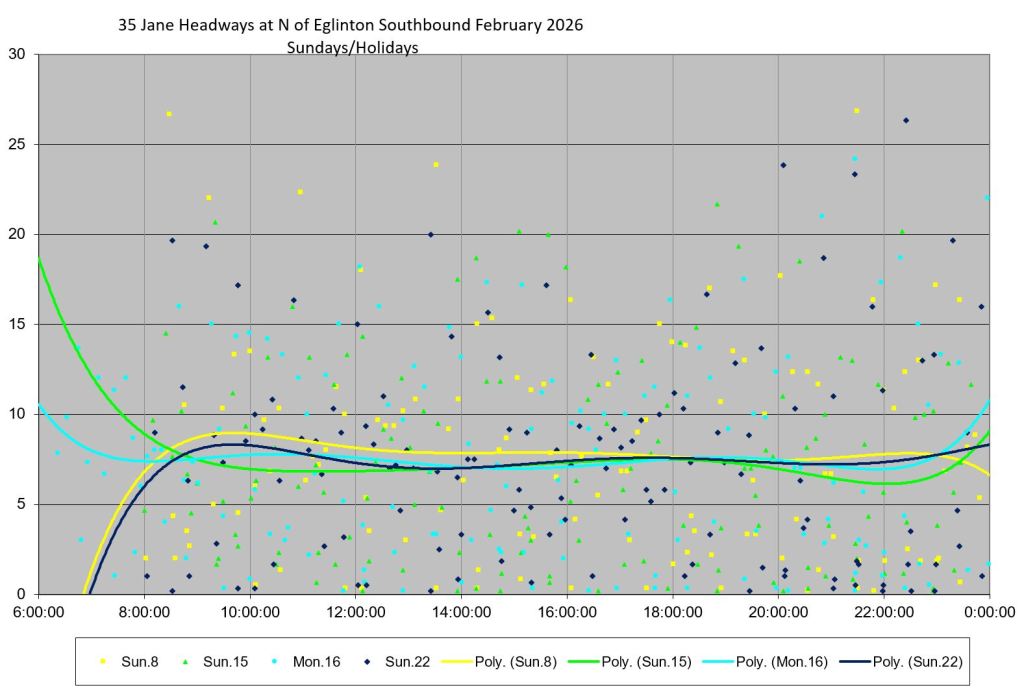
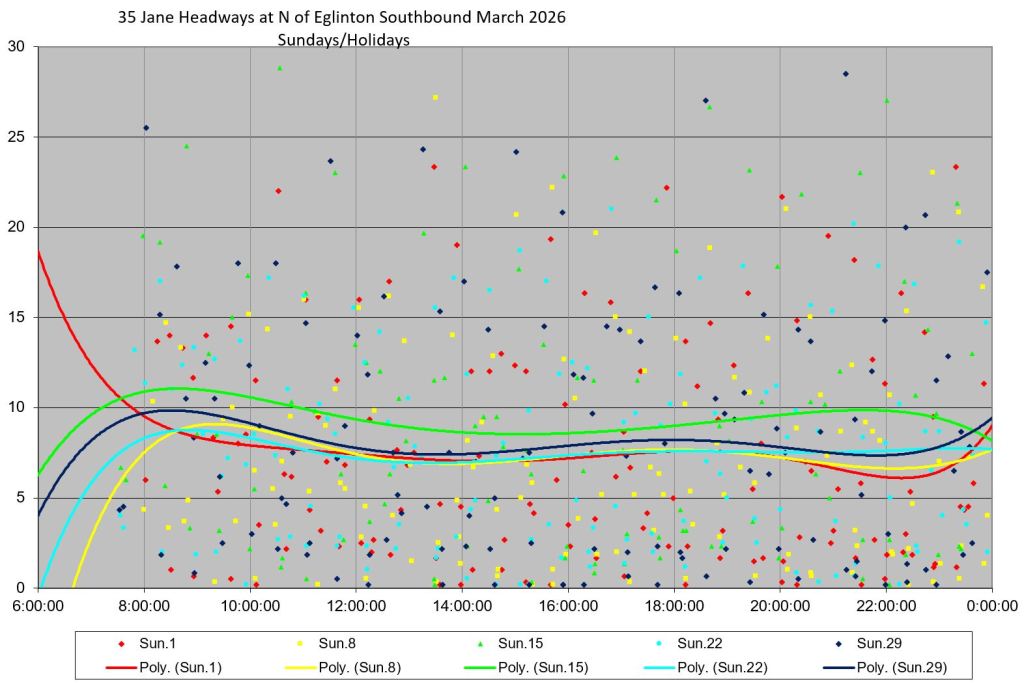
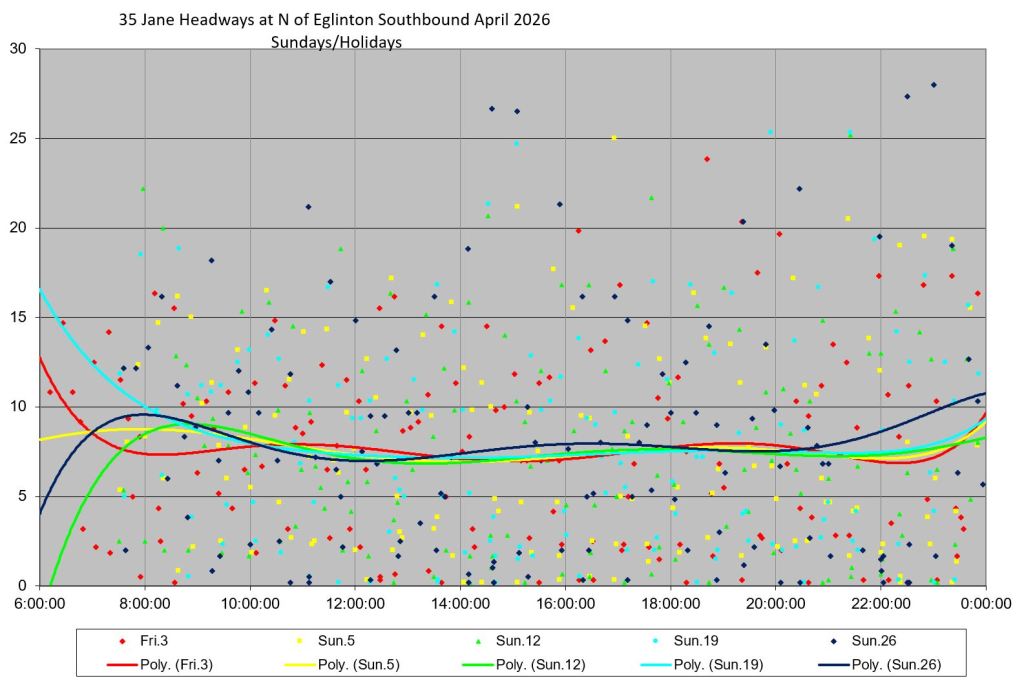
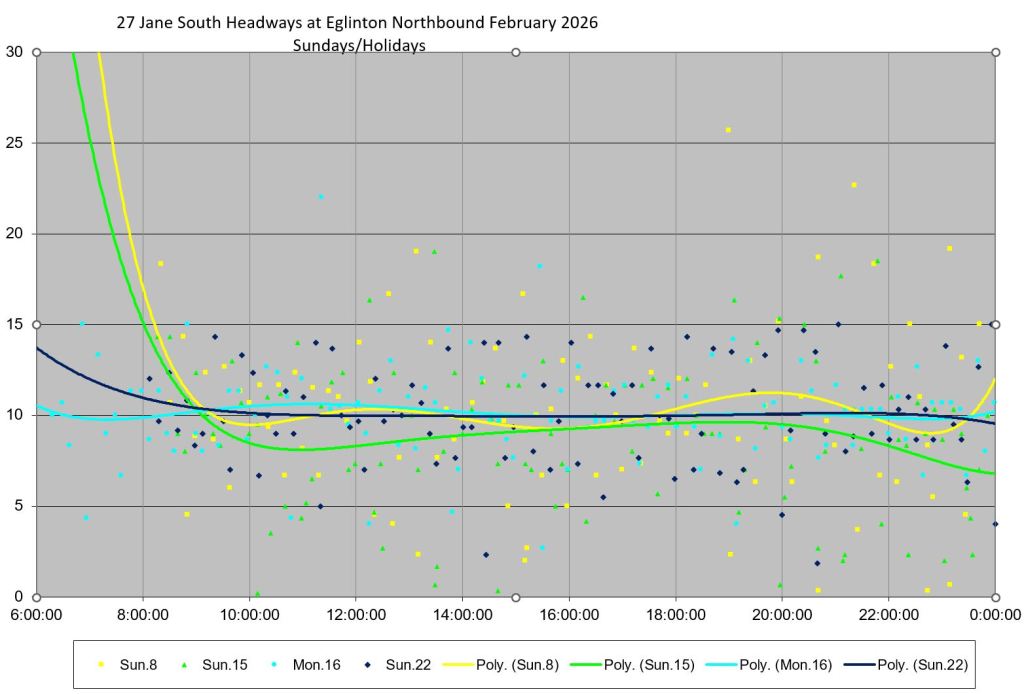
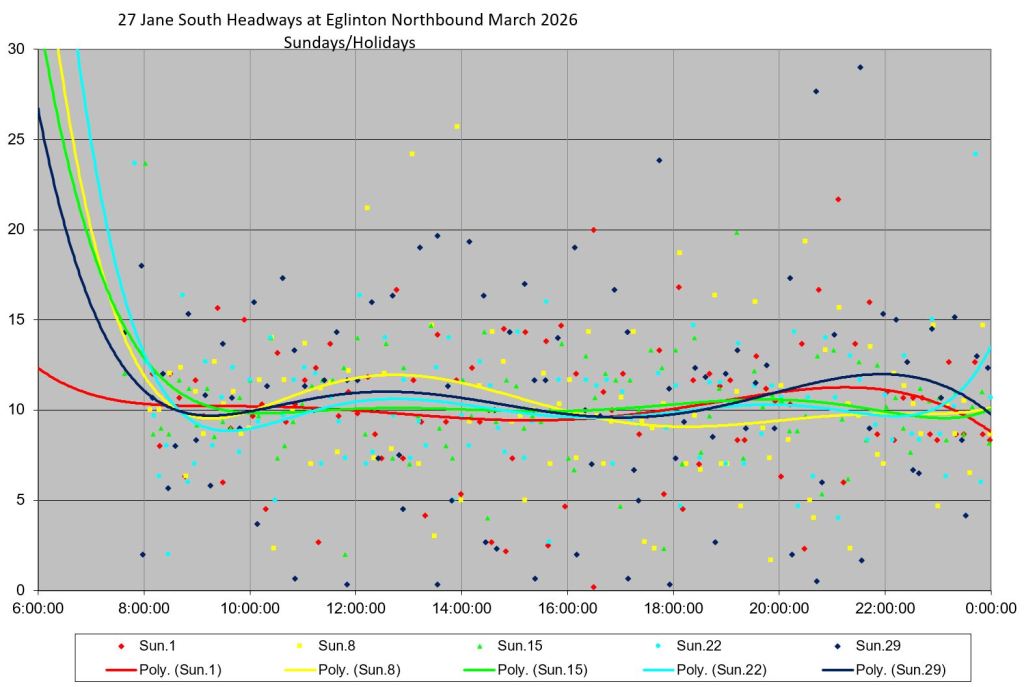
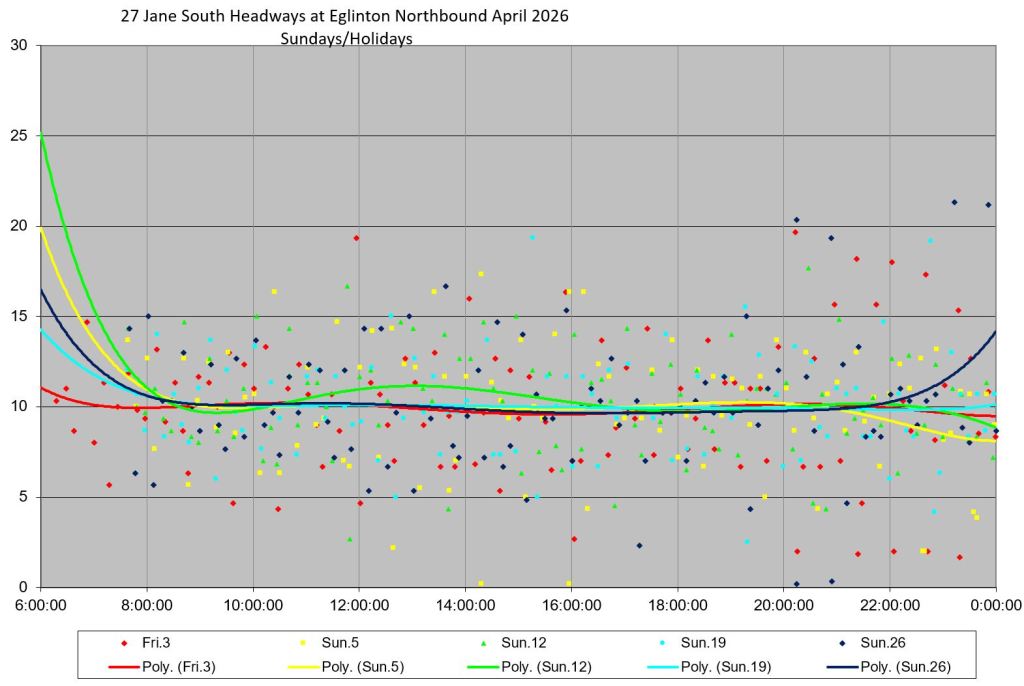
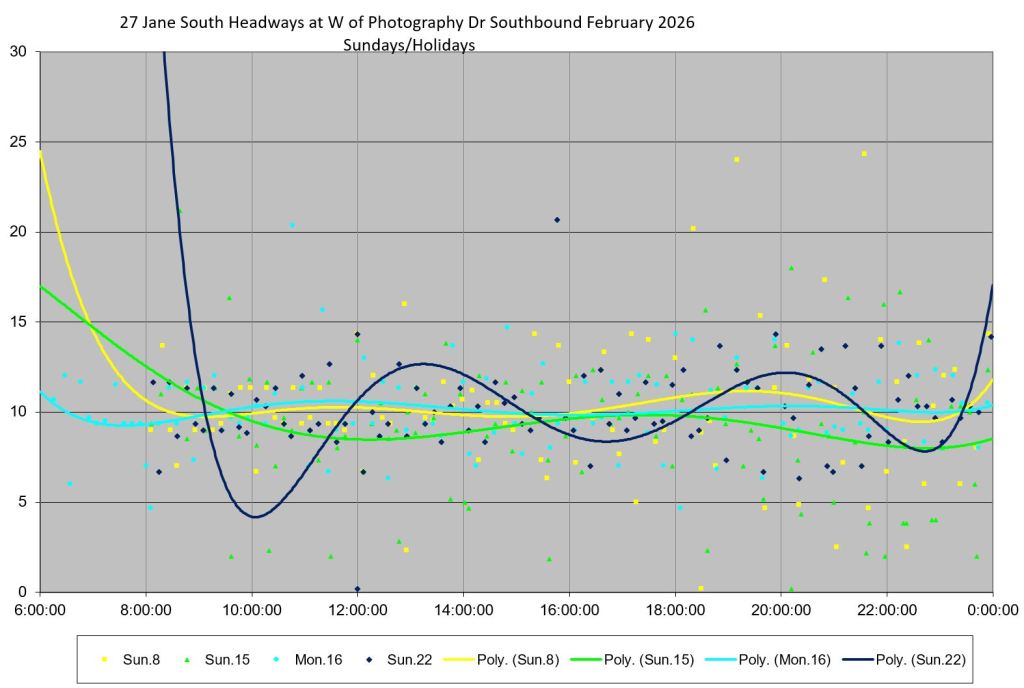
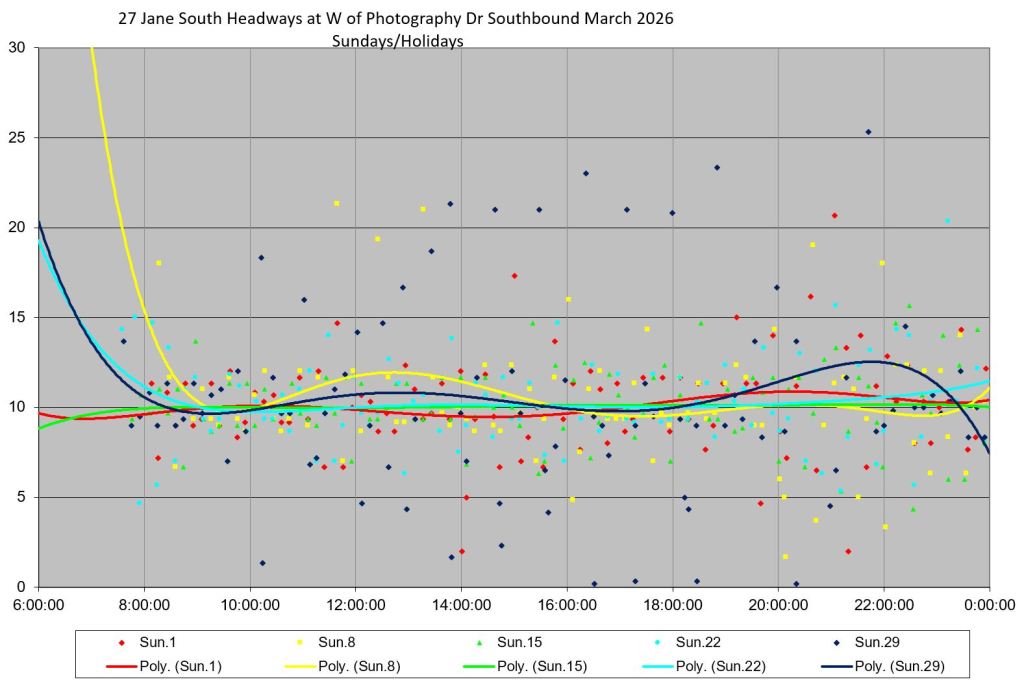
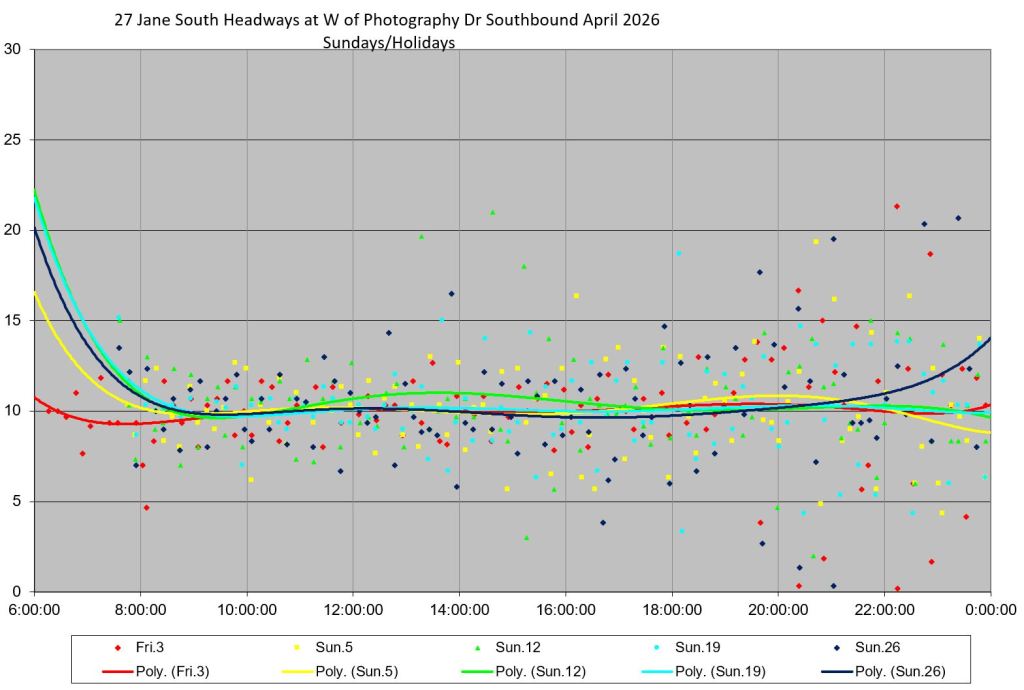
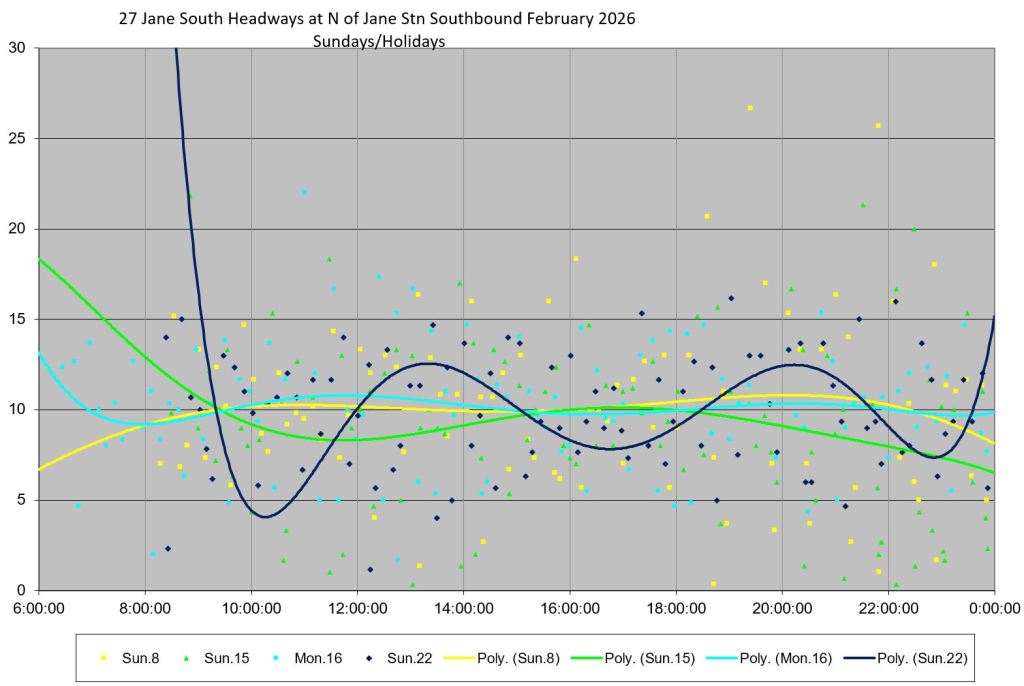
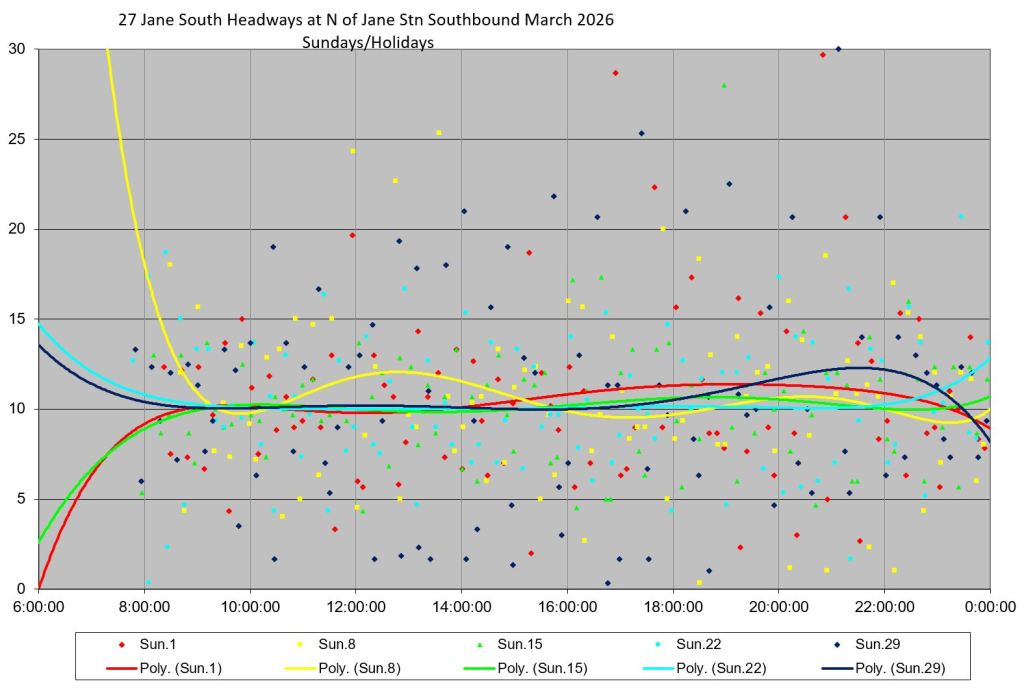
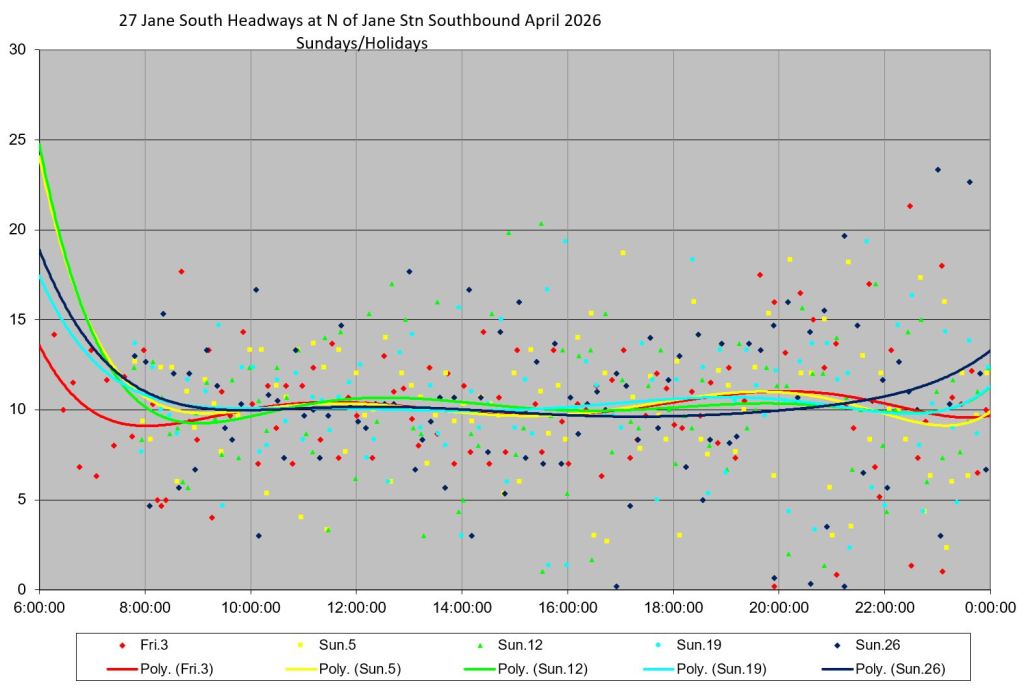
- A detailed chart showing Sunday/Holiday headways.
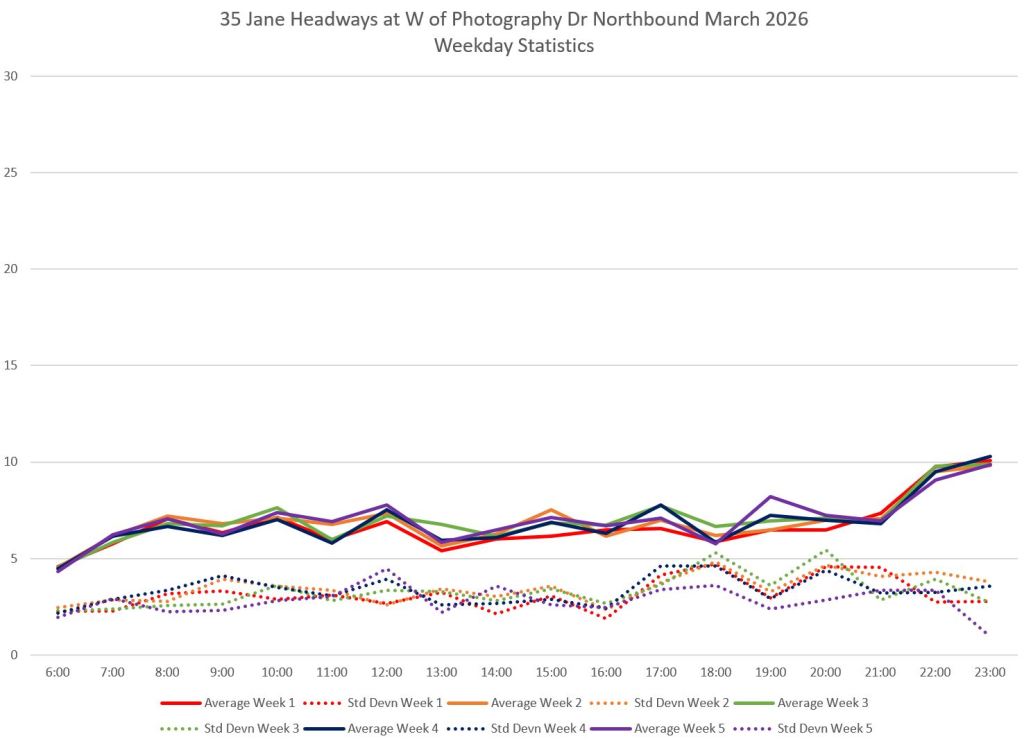
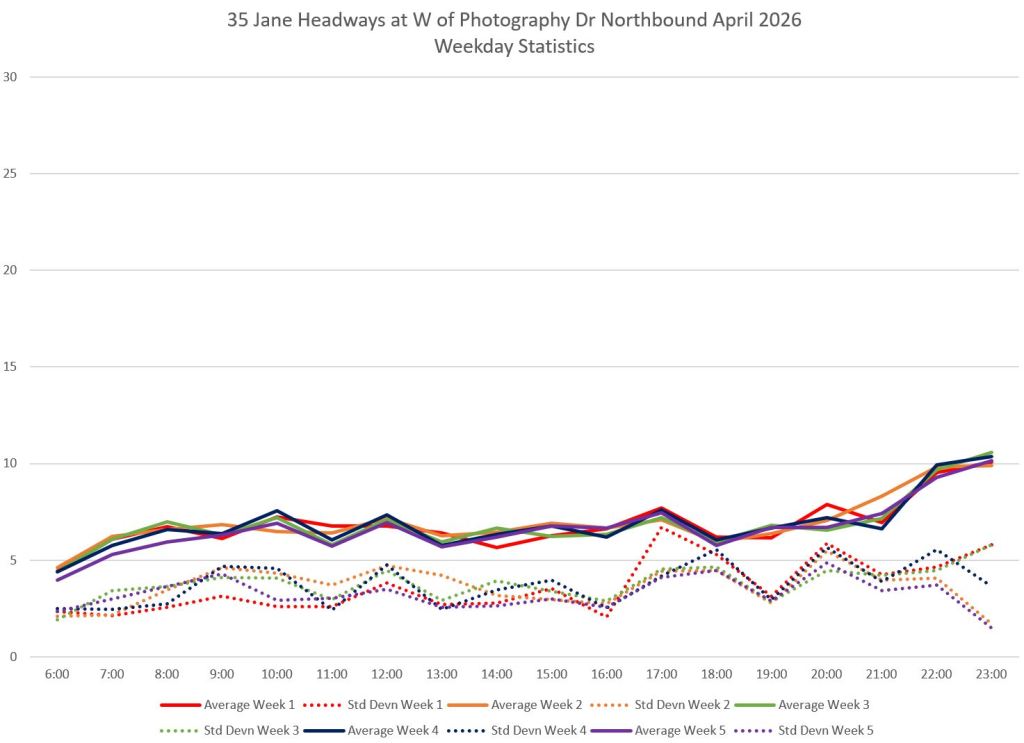
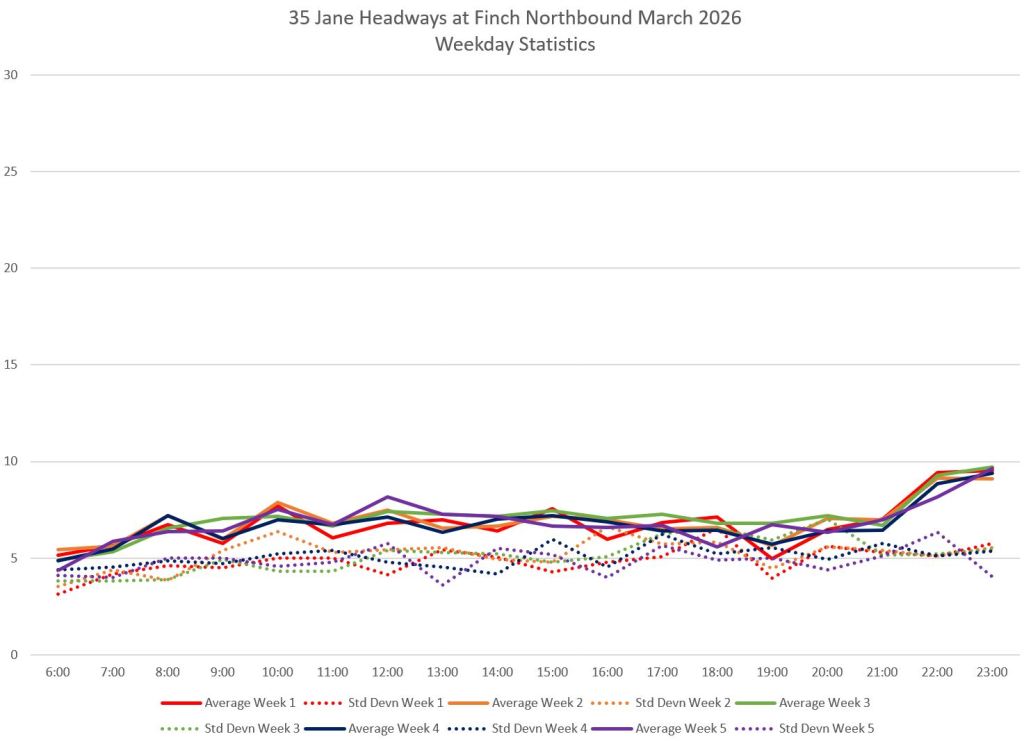
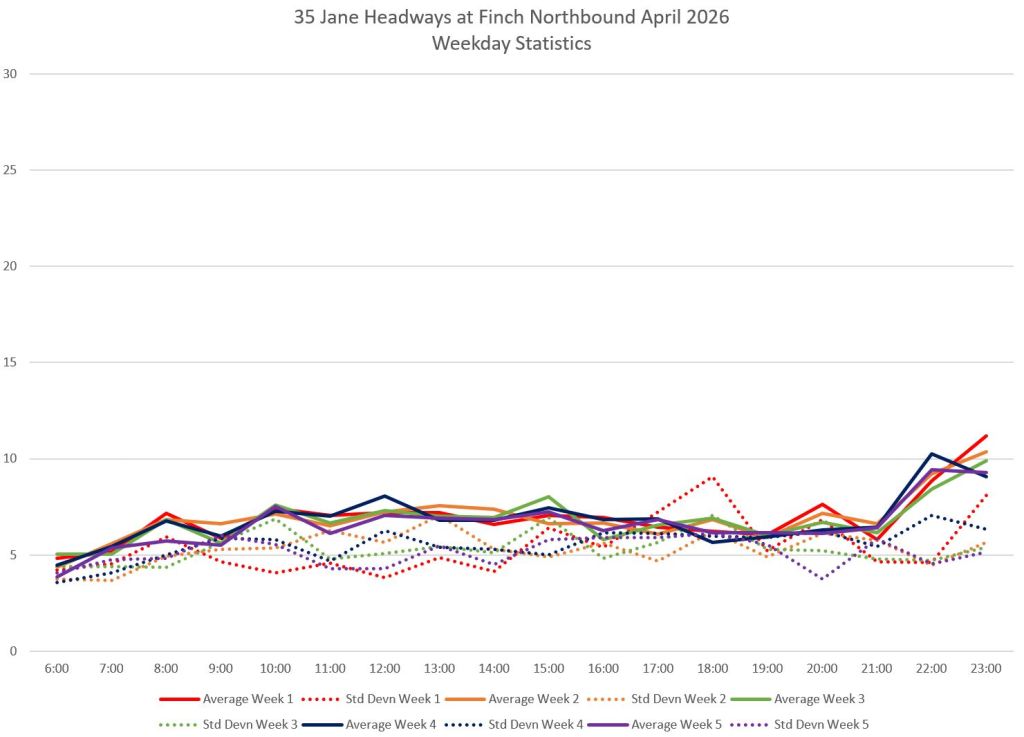
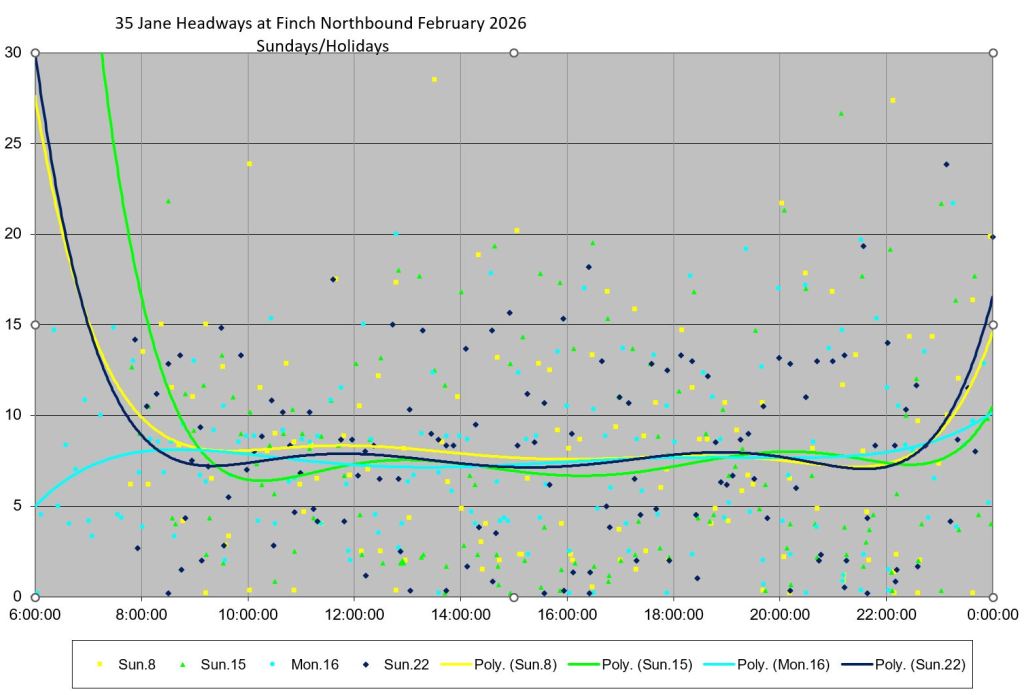
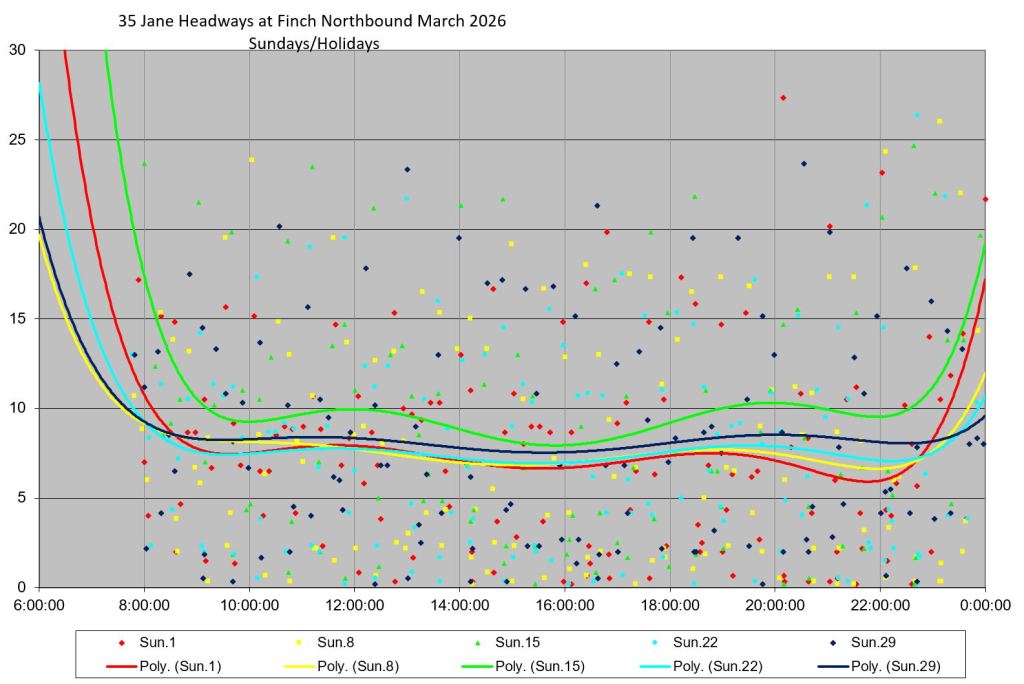
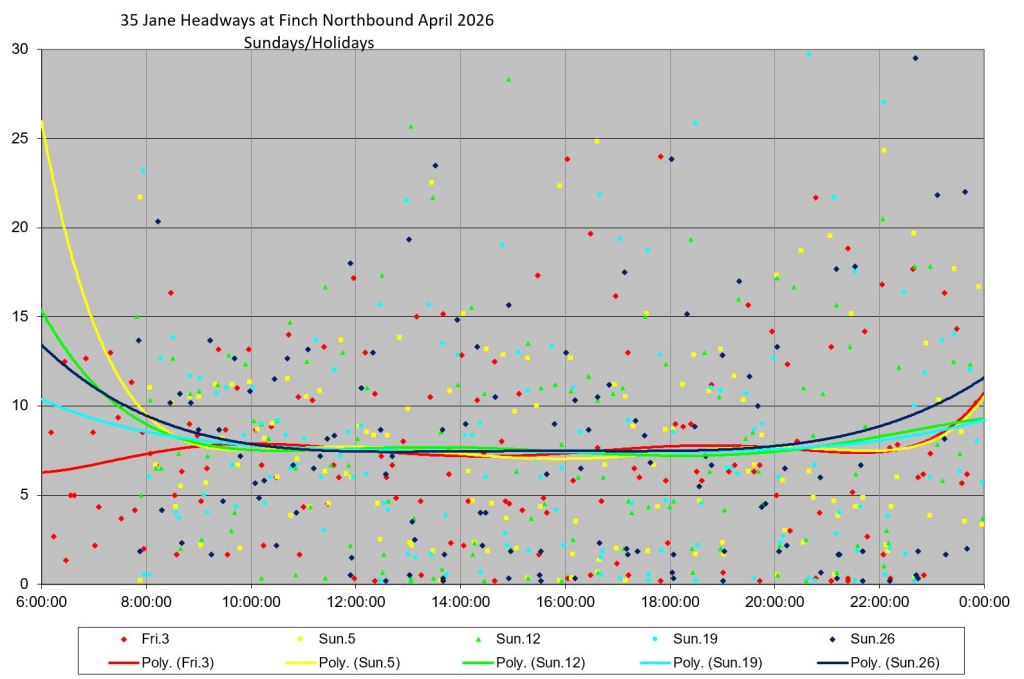
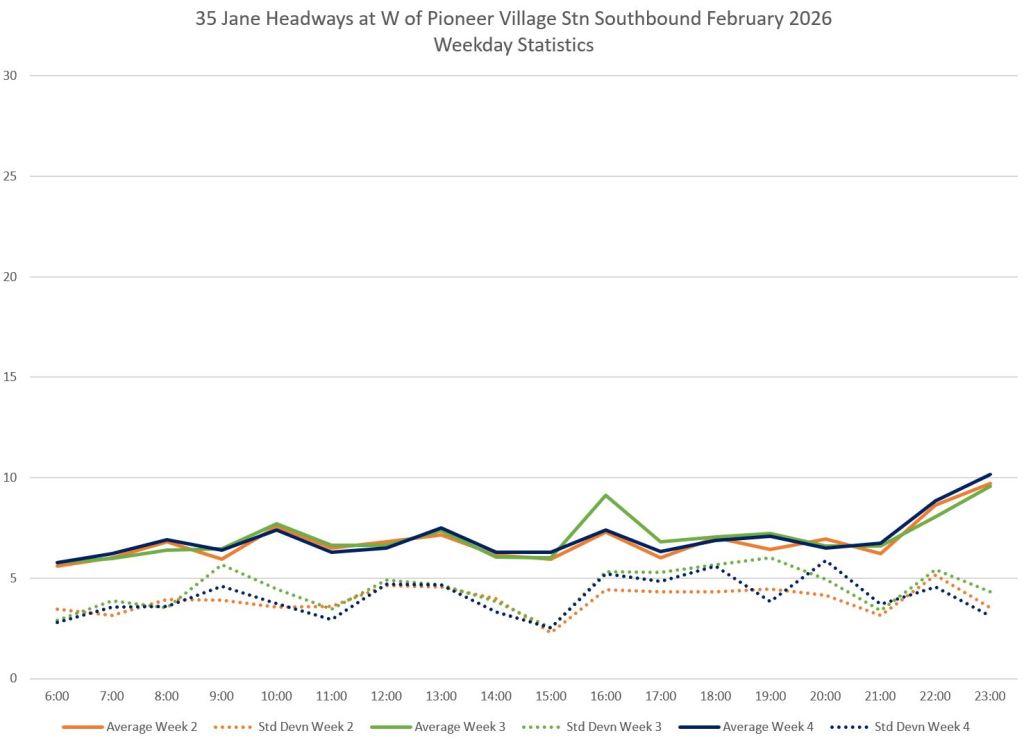
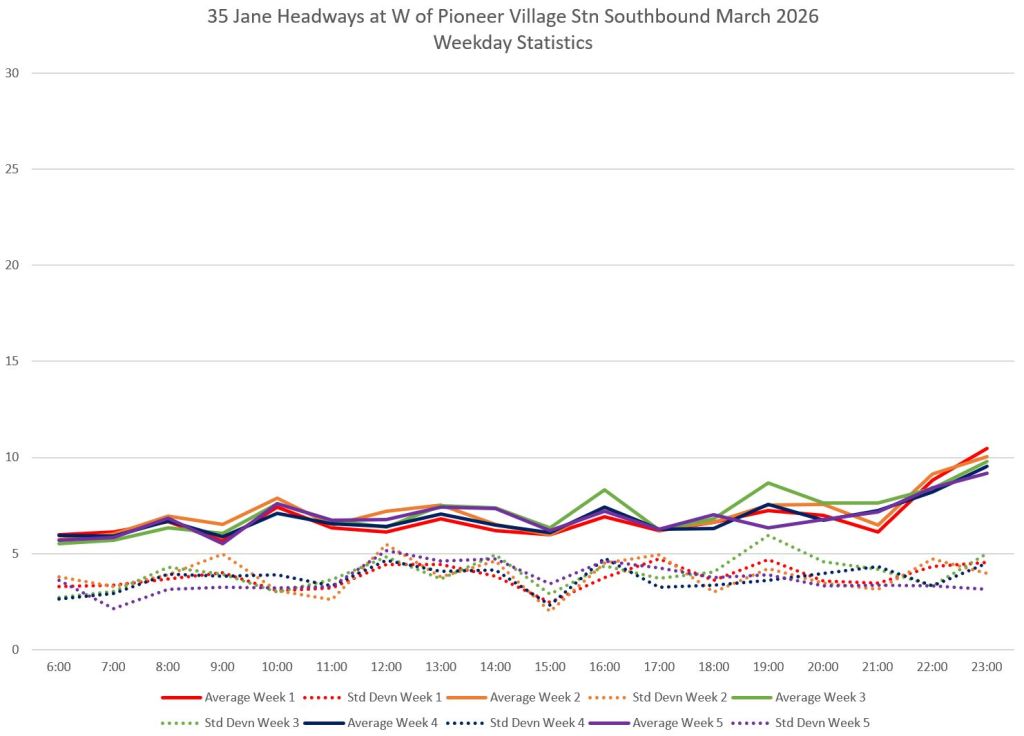
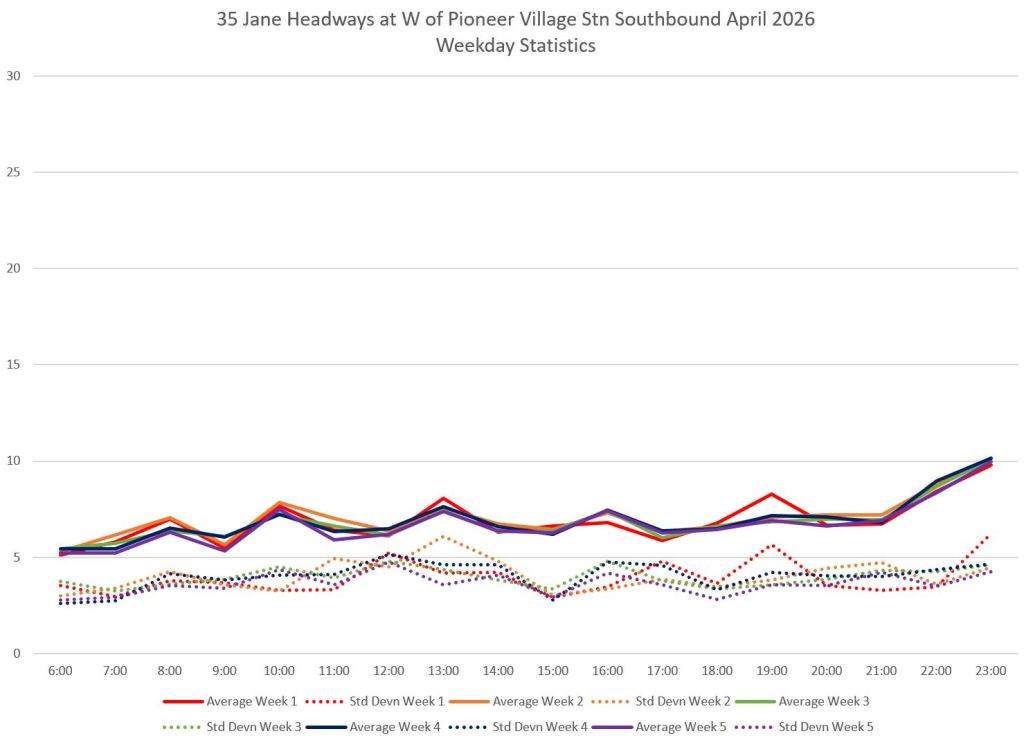
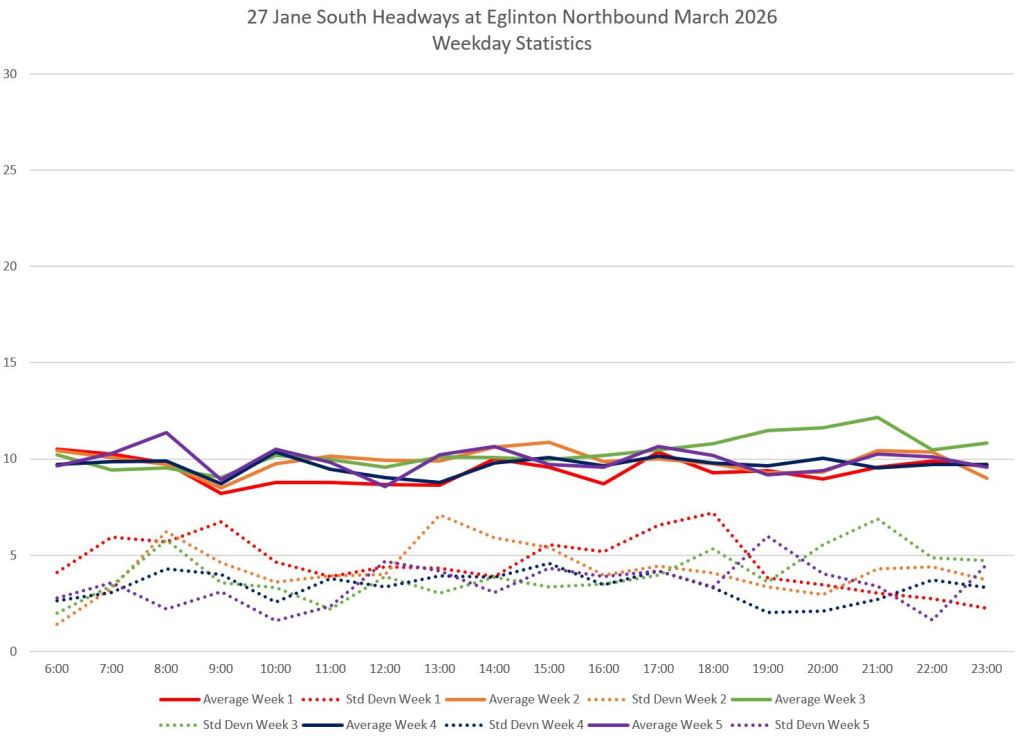
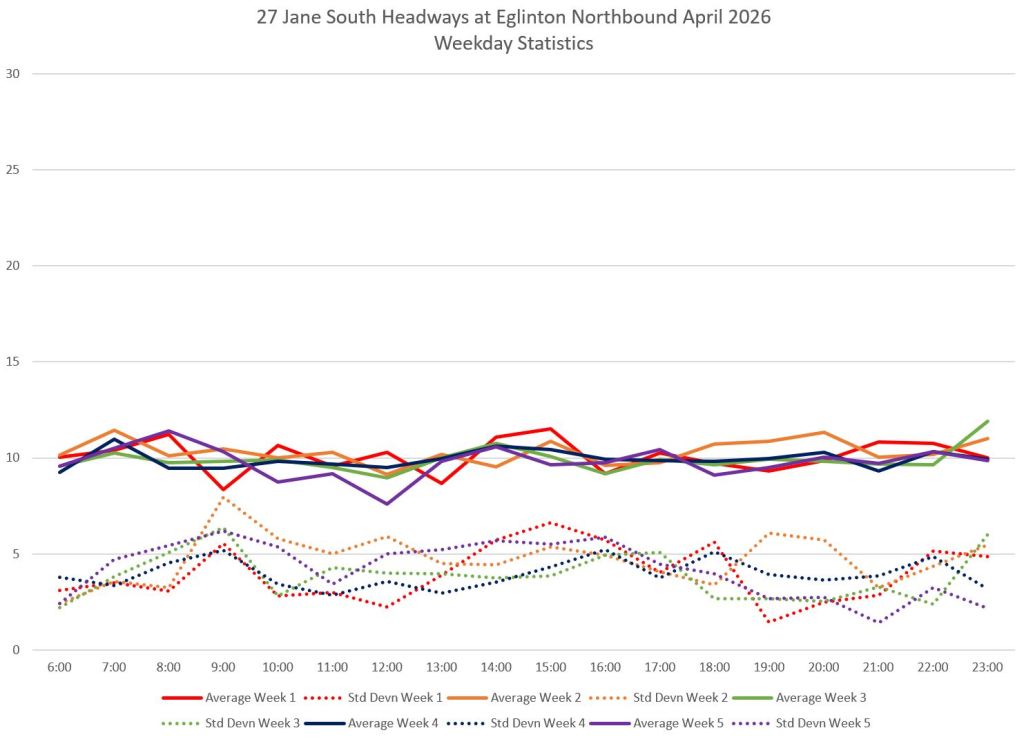
As a general observation, there is little difference as one moves across rows from February to April data. The measure of scatter in weekday headways, the standard deviation (dotted lines), is high even at terminals, and closes in on the average headway over the course of a journey. This indicates that service is already uneven leaving terminals, and bunching gets worse along the way. The absence of change over three months indicates that this is the accepted behaviour of service on these routes.
The average headways are close to the scheduled values. This indicates that all expected trips actually operated, although not on the regular spacing one might expect from the timetable. (If buses were missing, the averages would be higher than the scheduled service.)
TTC Service Standards dictate that terminal departures can be 1 minute early and up to five minutes late. In practice, the TTC measures itself against a range from 0 minutes early to five minutes late. The intent is to hit this range 90% of the time leaving terminals and 60% arriving.
For a 6 minute headway, this effectively allows a gap of 11 minutes with a bus leaving 5 minutes late behind one that is on time. For a 10 minute headway, a gap of 15 minutes would be allowed.
Headway standards work differently and are based on deviation from the scheduled spacing, not as an “on time” metric as riders on frequent services don’t care about the schedule, only the reliability.
For a 6 minute headway, the gap can range from 3 to 9 minutes. For a 10 minute headway, the gap can range from 5 to 15 minutes. The target is to stay within these limits 60% of the time.
It is self-evident that there is a lot of room here for service outside of the “standard” notably allowing 40% of buses to exceed the maximum allowed gap. In any event, the TTC does not report on headway adherence, and so the standard, such as it is, does nothing.
Scheduled Service
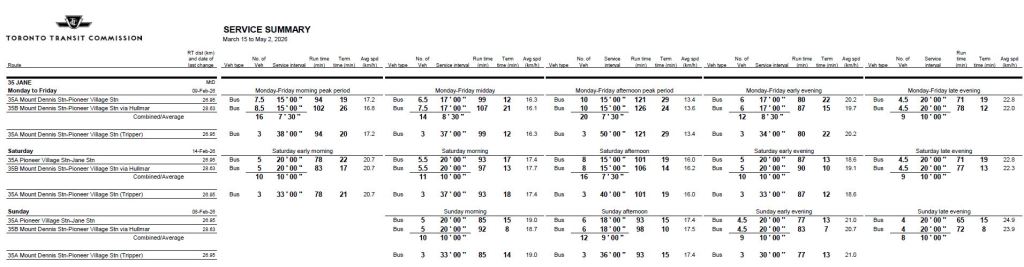
Service on 27 Jane South is scheduled at 10’00” at all times. On 35 Jane, service runs from every 7’30” to every 10’00”.
Trippers on 35 Jane are spare buses available for redeployment as shuttles in case of service interruptions on LRT lines. These were changed to 935 Jane Express trippers in May, but that is beyond the scope of this article.

35 Jane Service Northbound From Mount Dennis Stn
Leaving Mount Dennis
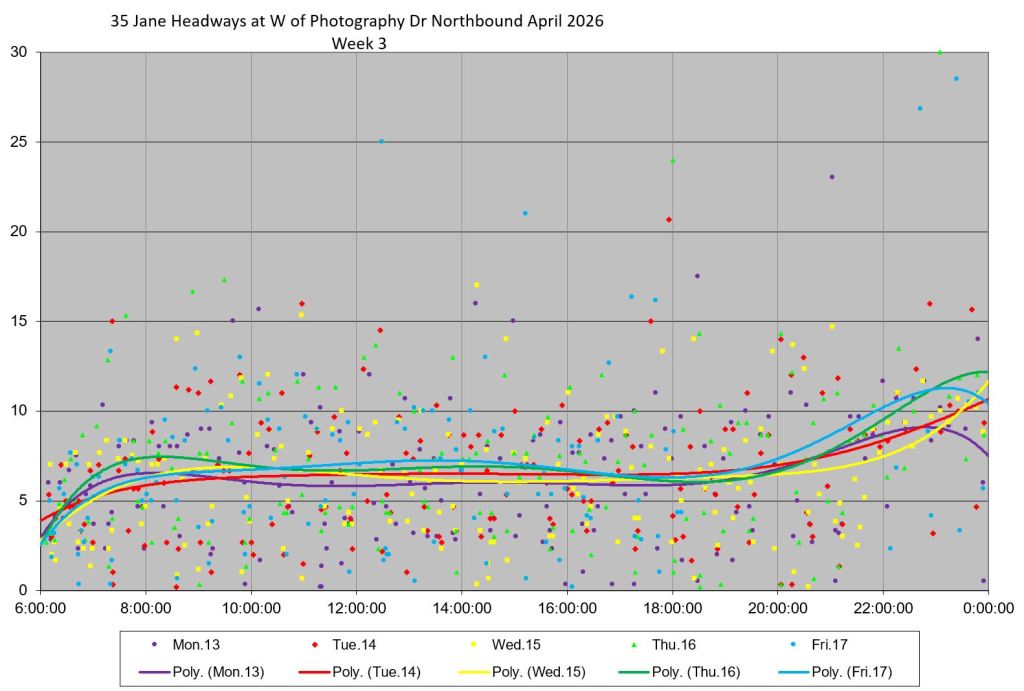
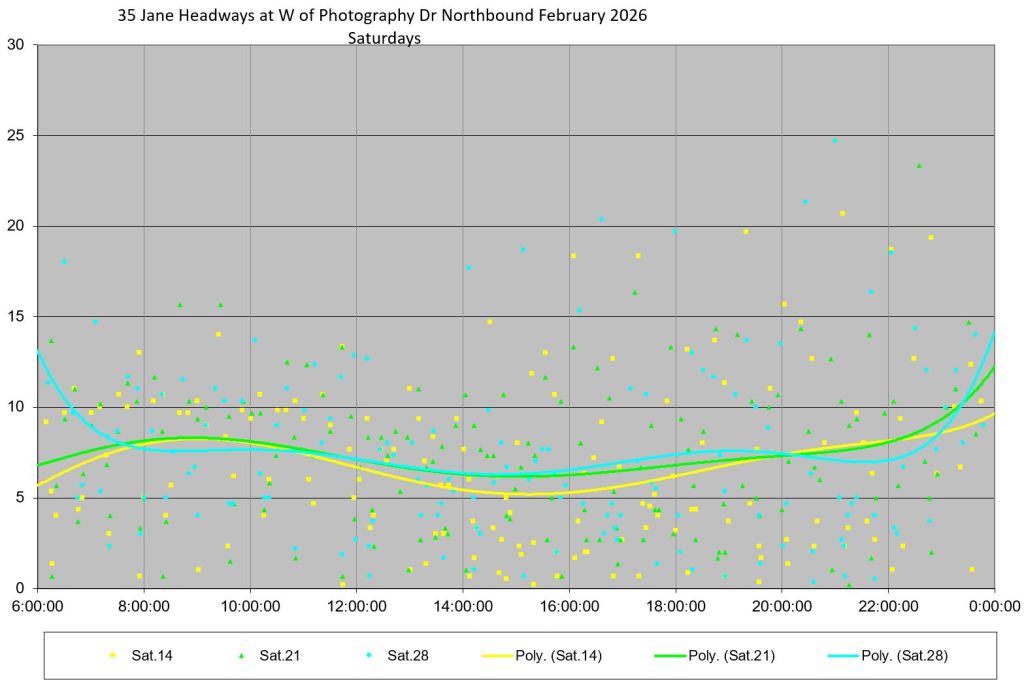
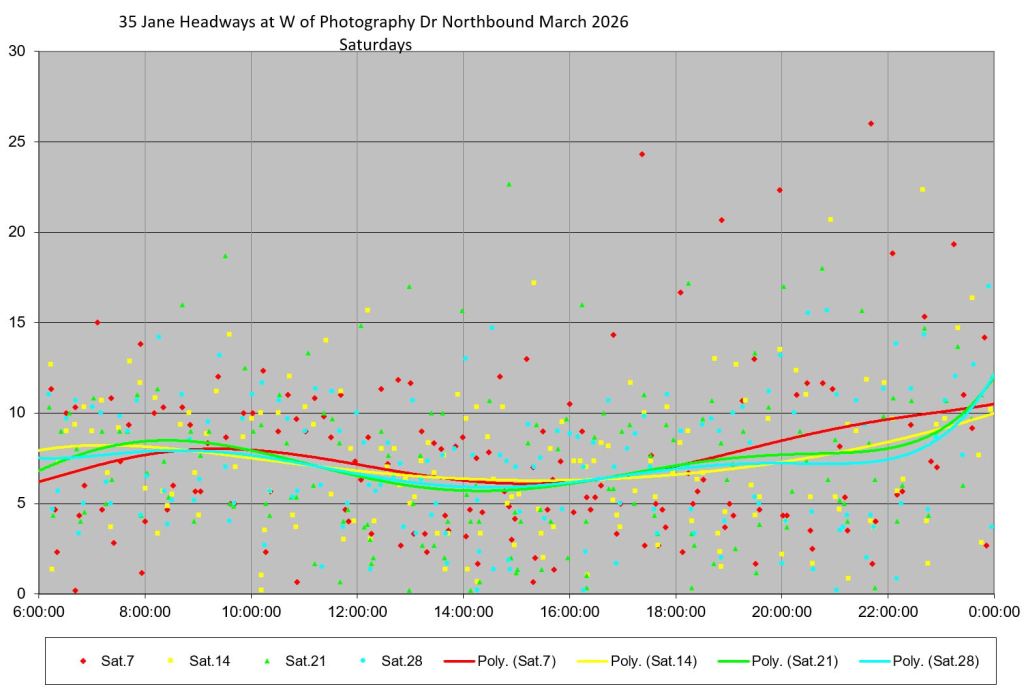
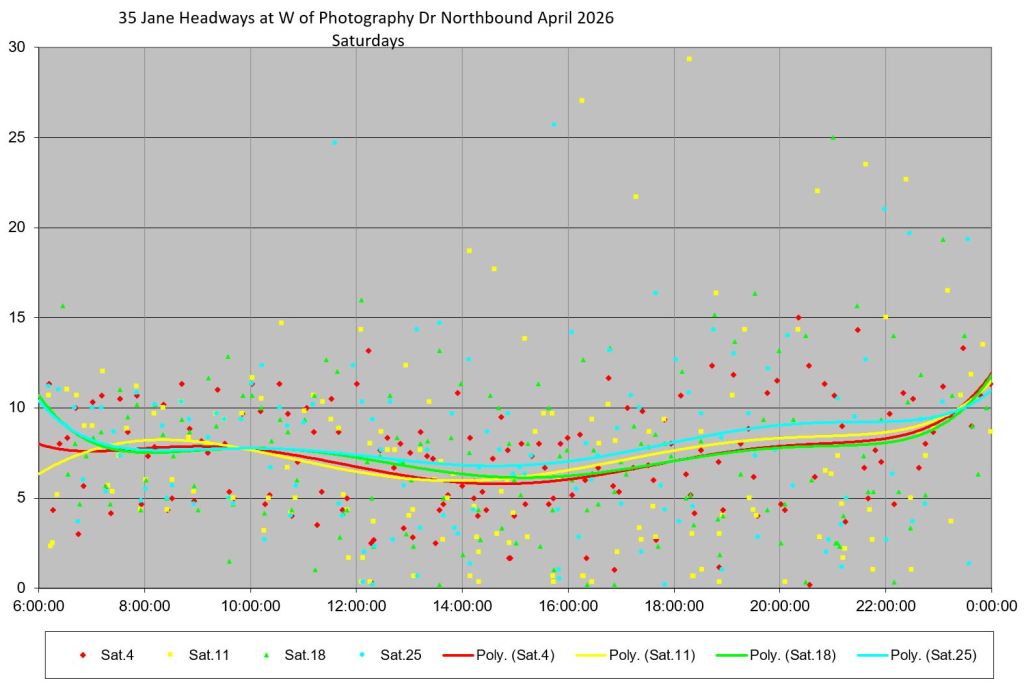
The headways leaving Mount Dennis northbound show a quite similar pattern over three months with a fairly uniform scatter of data points between zero and ten minutes all day. It is simply not possible that this meets the +0/-5 window cited by Service Standards. The situation is worse on weekends, particularly on Sundays.
Northbound at Finch
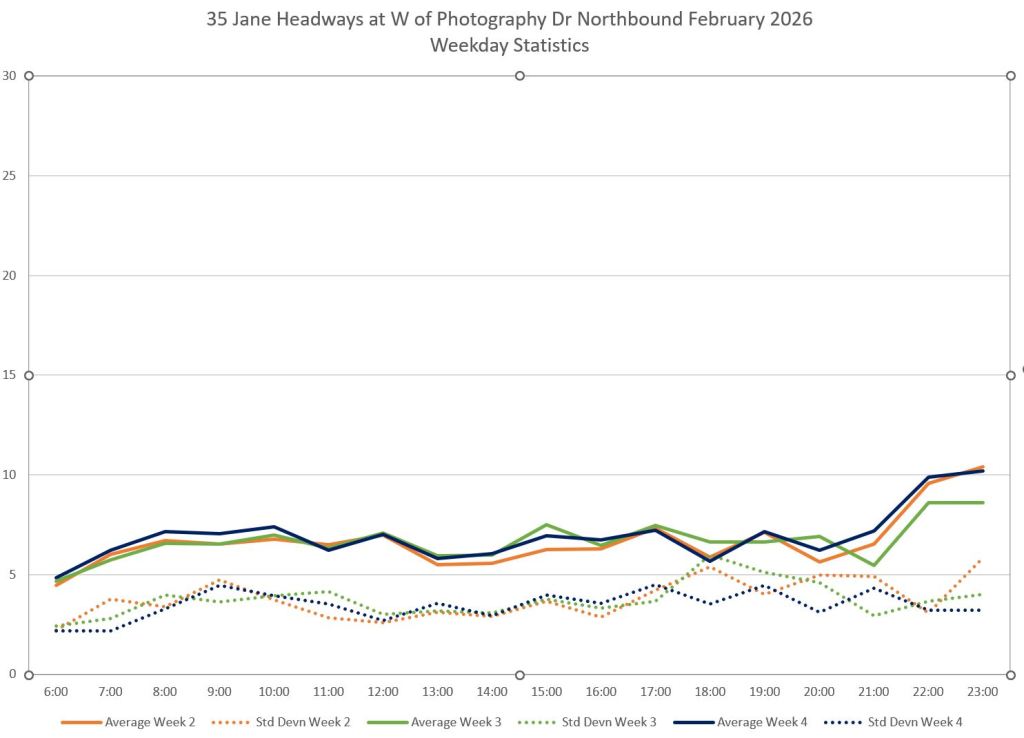
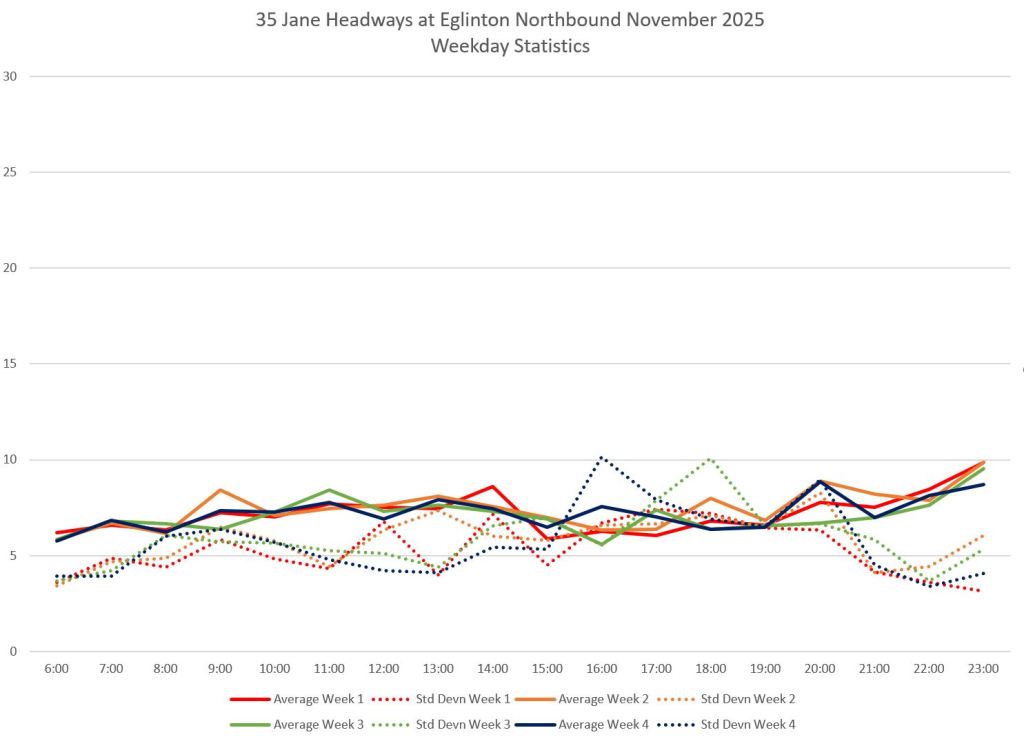
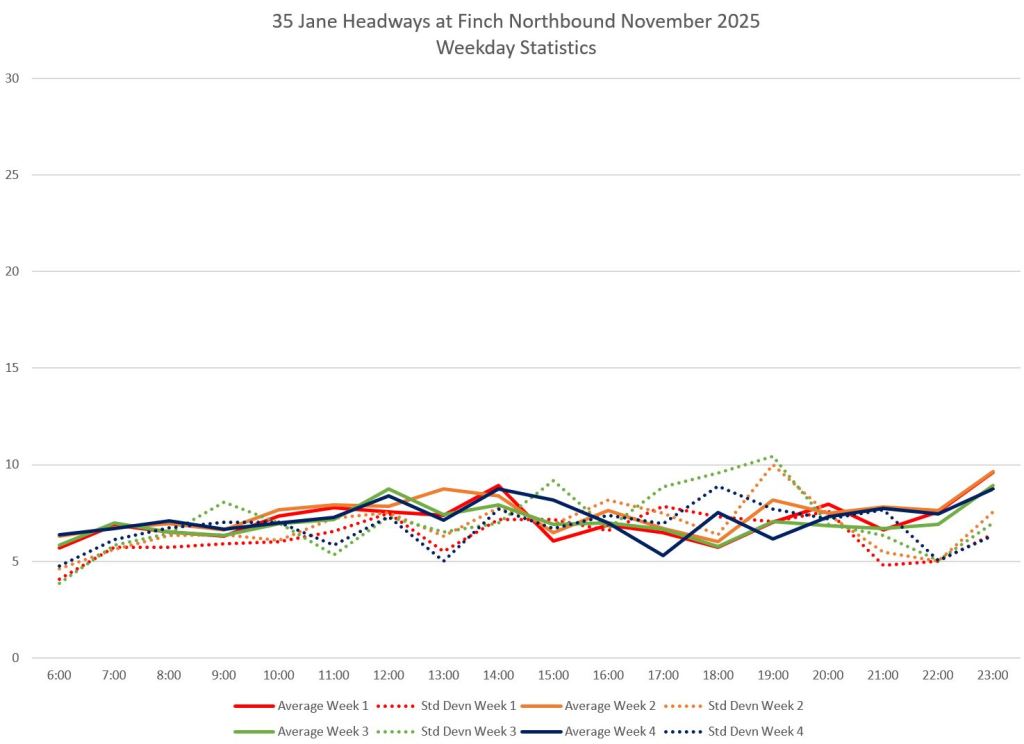
By the time the service reaches Finch (south of the top end split loop), the standard deviation values (dotted) are close to the same values as the average headways indicating extensive bunching. This does not vary by time of day and there is no visible peak period effect in the weekday data. Headway values from 0 to 20 minutes are common.
35 Jane Service Southbound From Pioneer Village Stn
Southbound Leaving Pioneer Village Stn
As with the northbound service, departure headways are already spread over a range of values from 0 to 15 minutes on weekdays, with higher values on weekends.
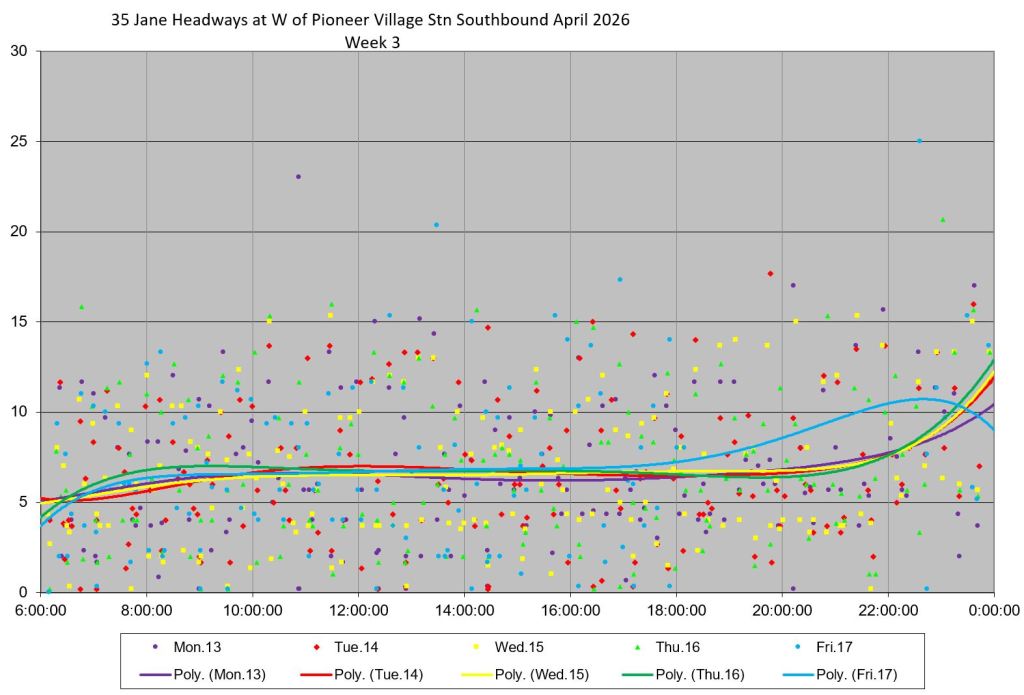
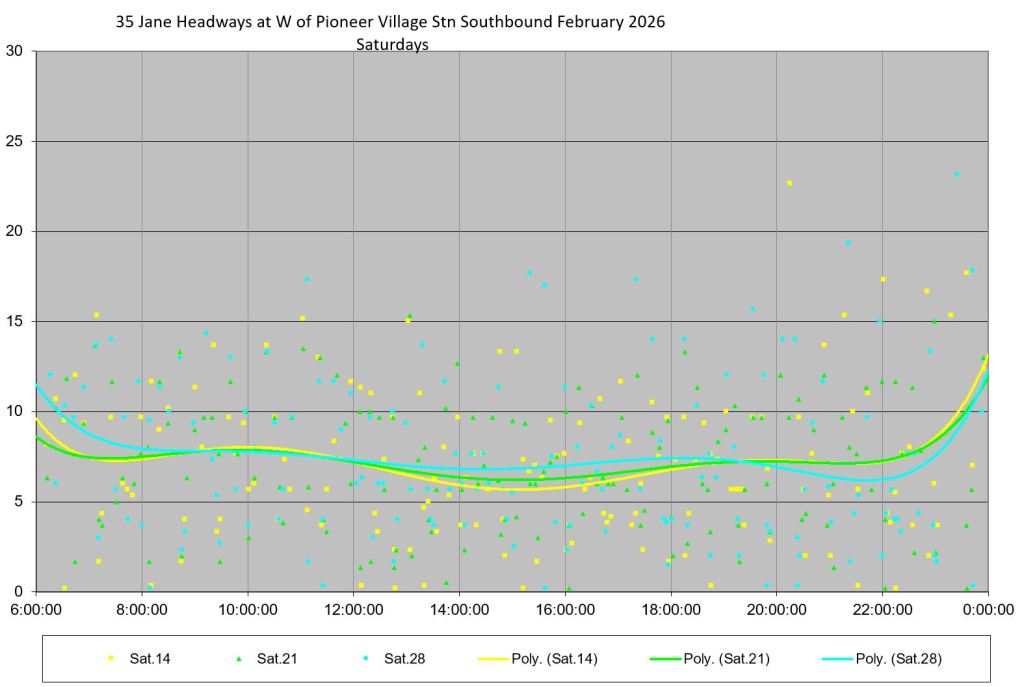
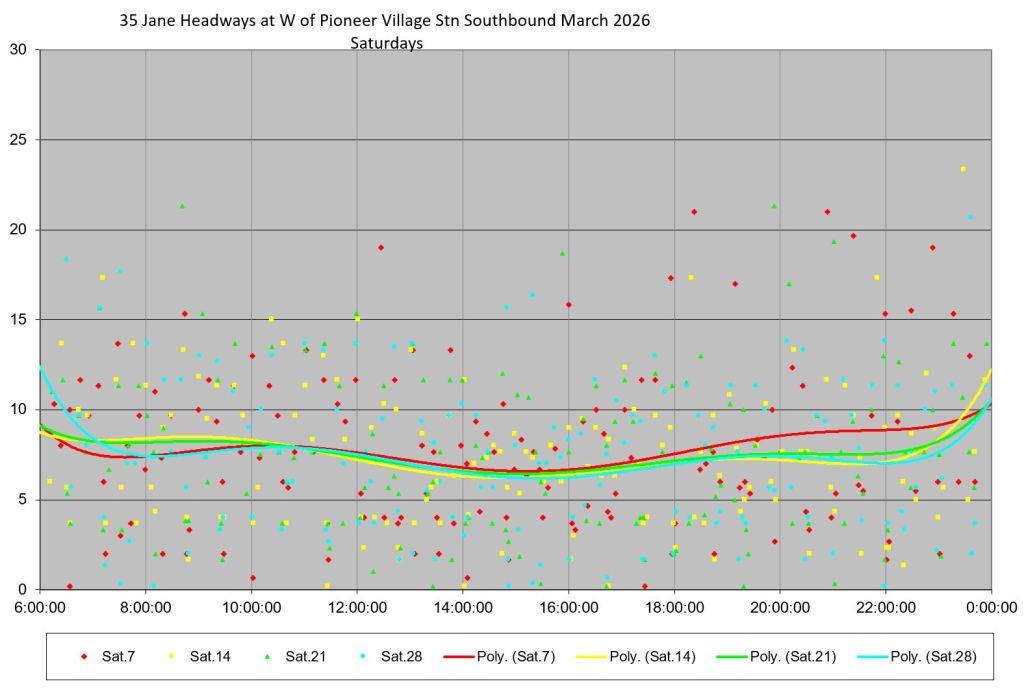
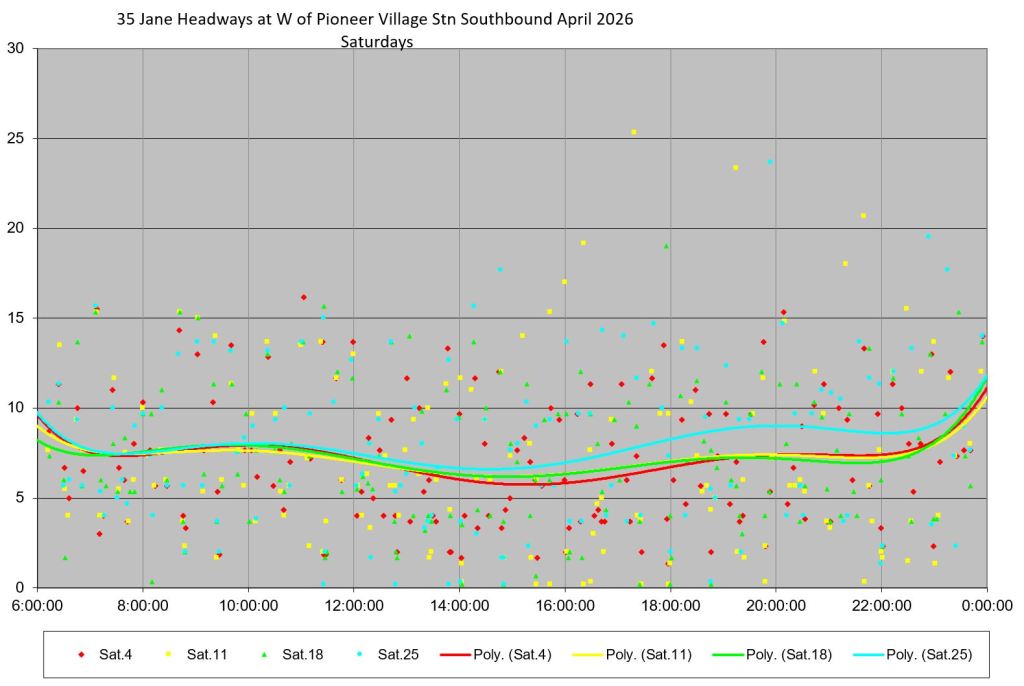
Southbound at Eglinton
Southbound at Eglinton shows the same pattern as northbound at Finch with headways from 0 to 20 minutes all day, and many points in the 20-30 minute range on Sunday.
27 Jane South Service Northbound from Jane Station
Northbound from Jane Station
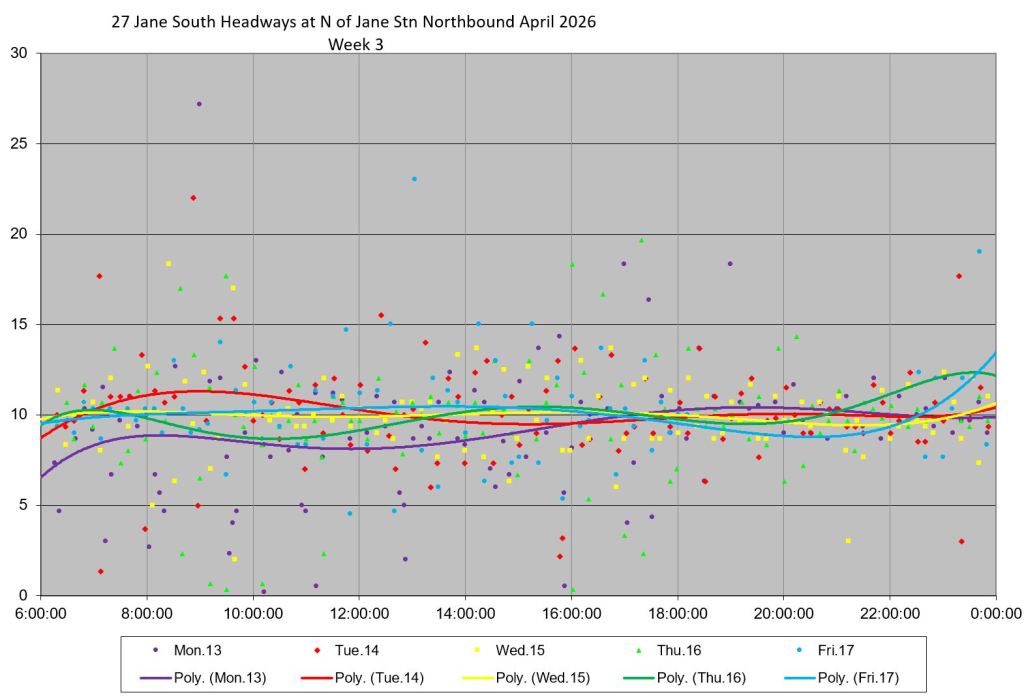
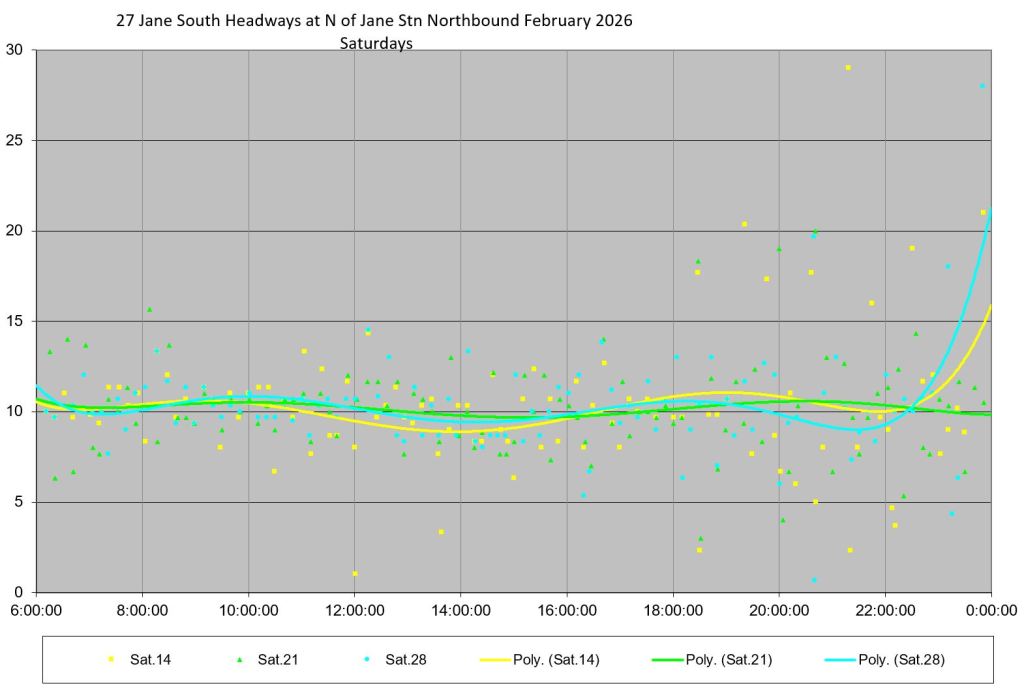
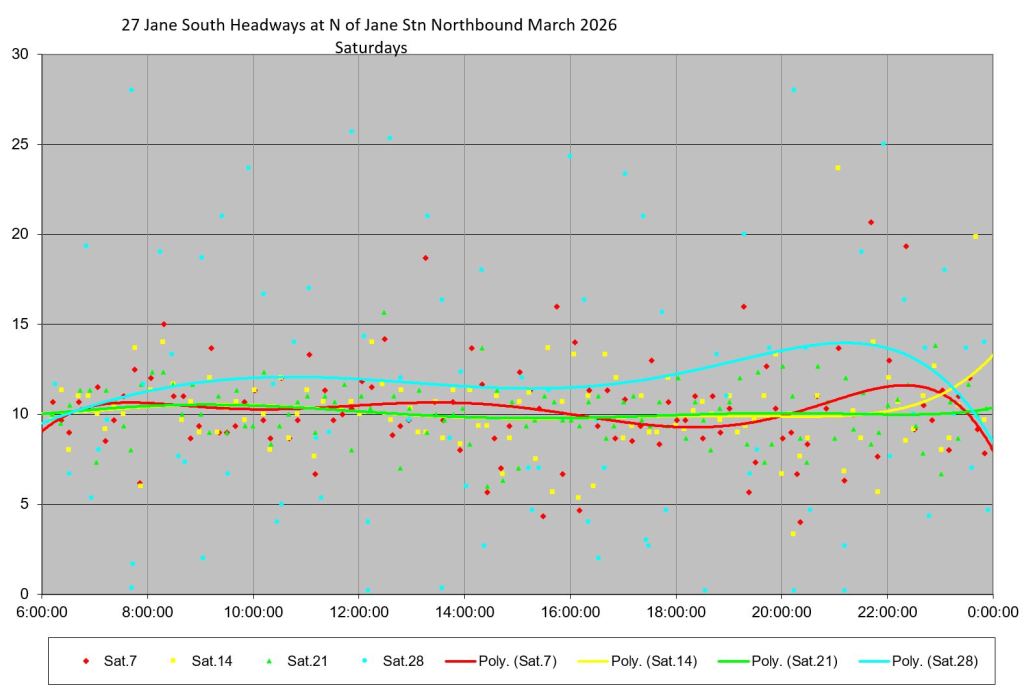
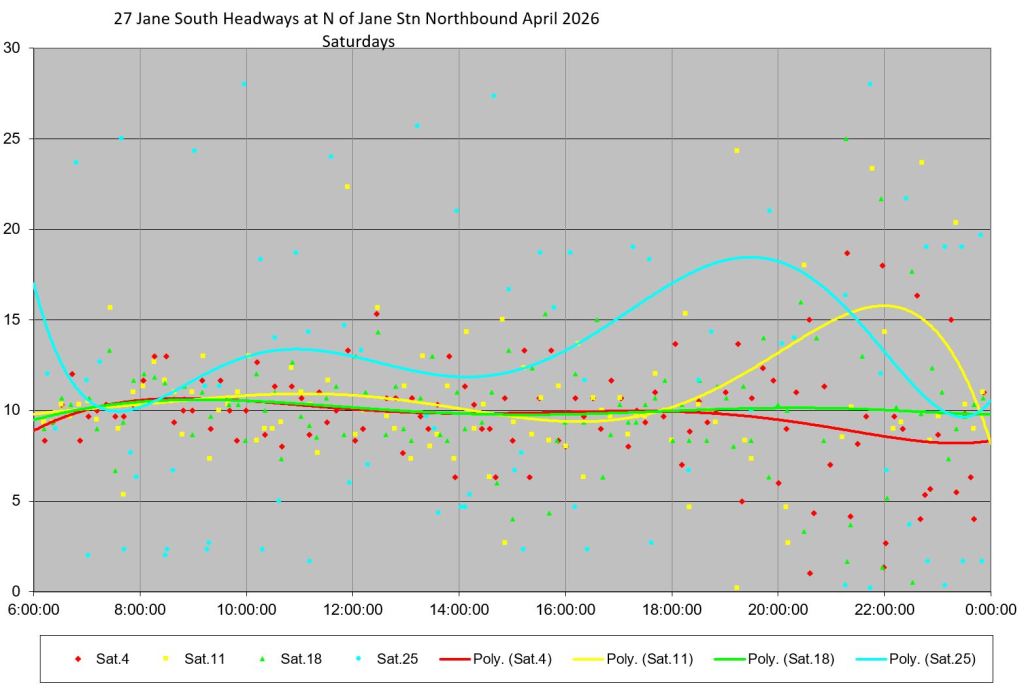
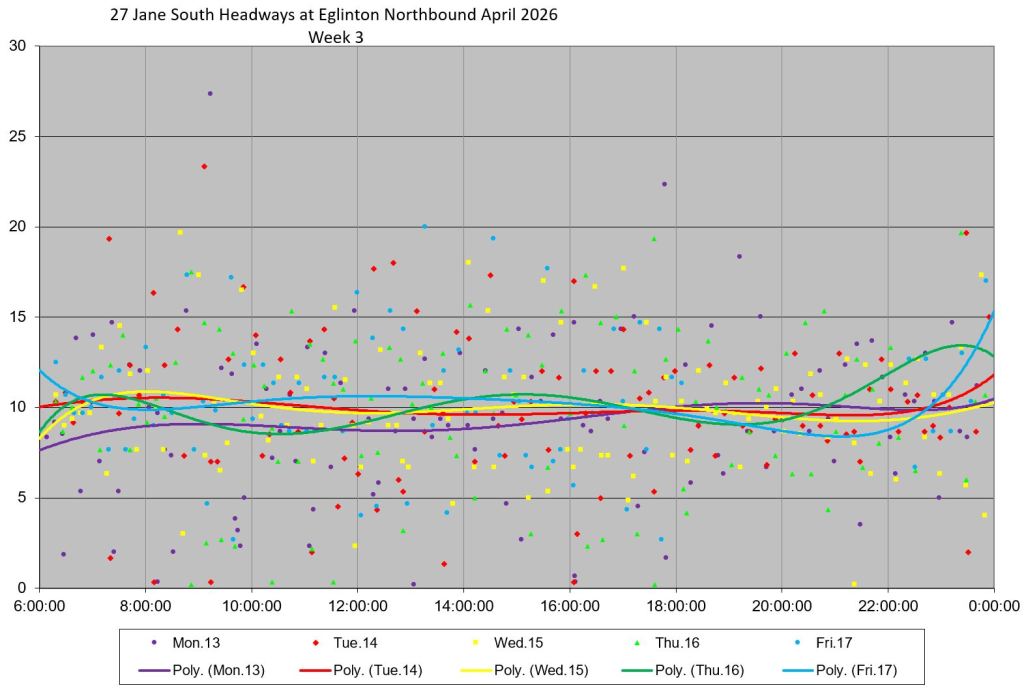
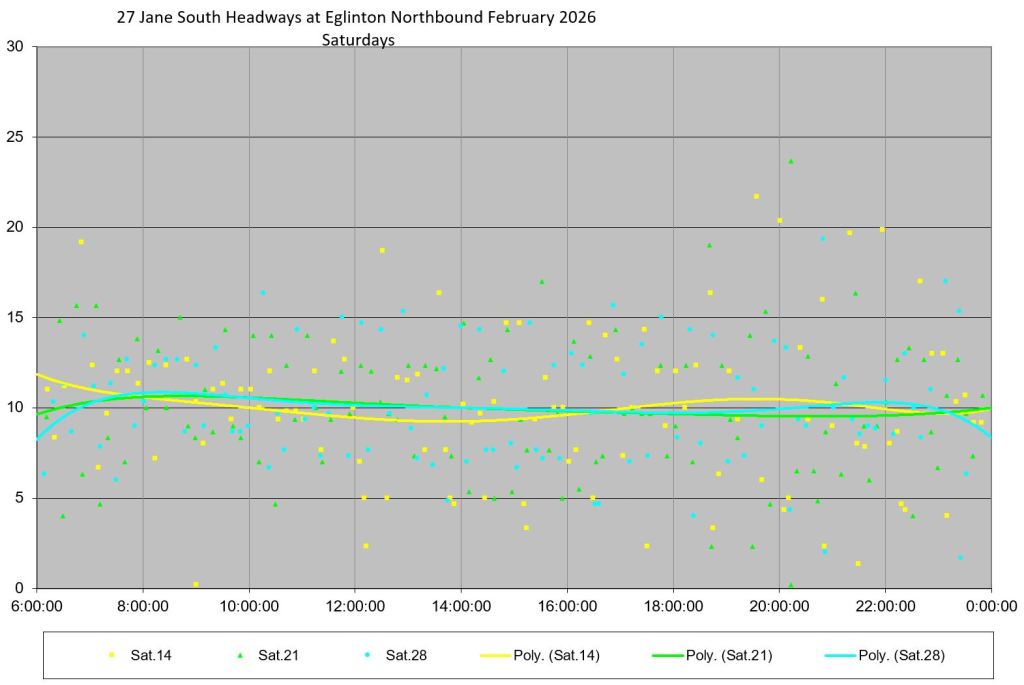
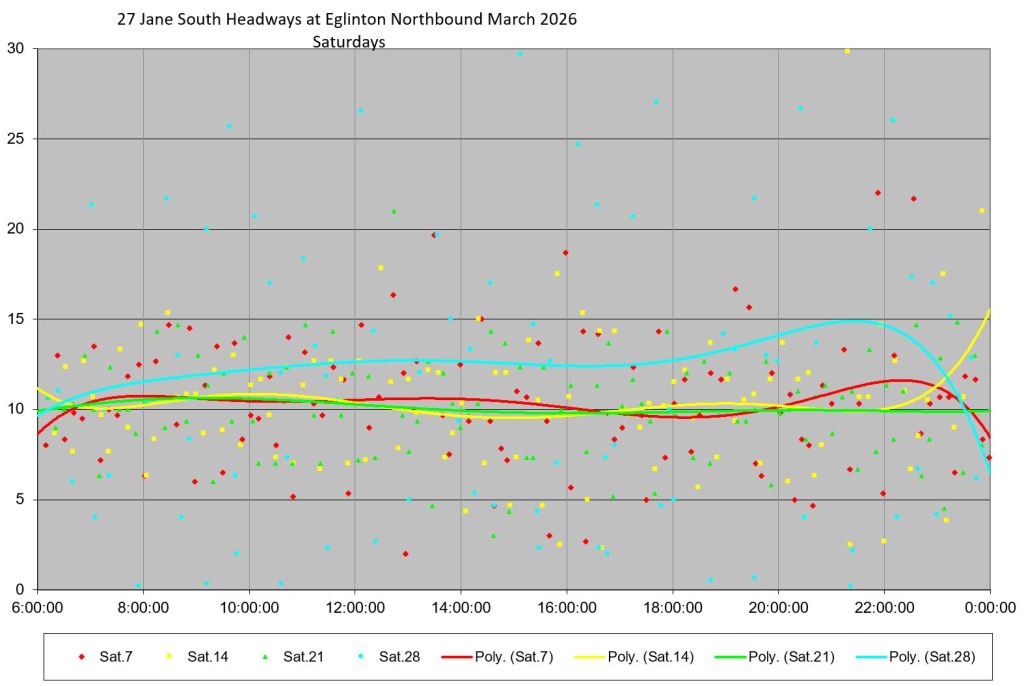
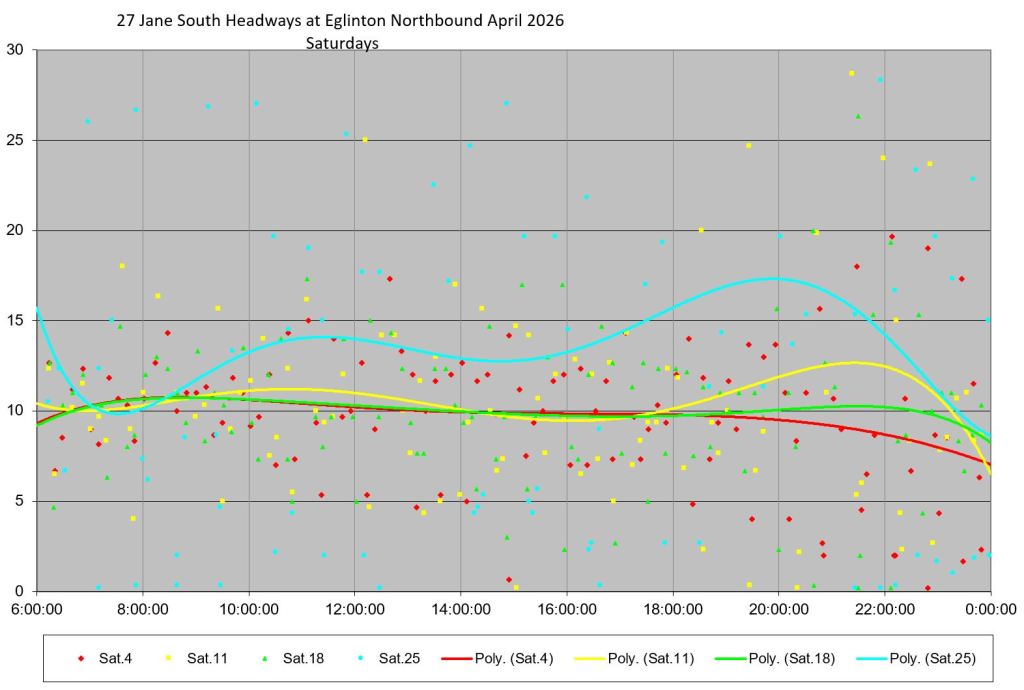
Service leaving Jane Station was noticeable more scattered in February with SD values over 5 minutes. Things improved slightly in March and April, but there remains a fairly wide spread in headway values.
Note that at a 10 minute headway, the Service Standards allow gaps up to 15 minutes. Whether the service shown here would be considered “good” by riders is another matter.
Northbound at Eglinton
At Eglinton, the spread in headway values widens with many points lying beyond the 15 minute bound. However, the target is to only hit that 60% of the time, and this allows much erratic service to be claimed as “within Board approved standards”.
27 Jane South Service Southbound from Mount Dennis
Southbound leaving Mount Dennis Station
During February, service southbound from Mount Denns was extremely erratic with many headways over 15 minutes. Things improved in March and April, relatively speaking, but the spread in values was still high for a point close to the terminus.
Southbound at Jane Station
Service arriving at Jane Station shows a similar pattern to other locations with a wide dispersion of headways particularly on Sunday in March.
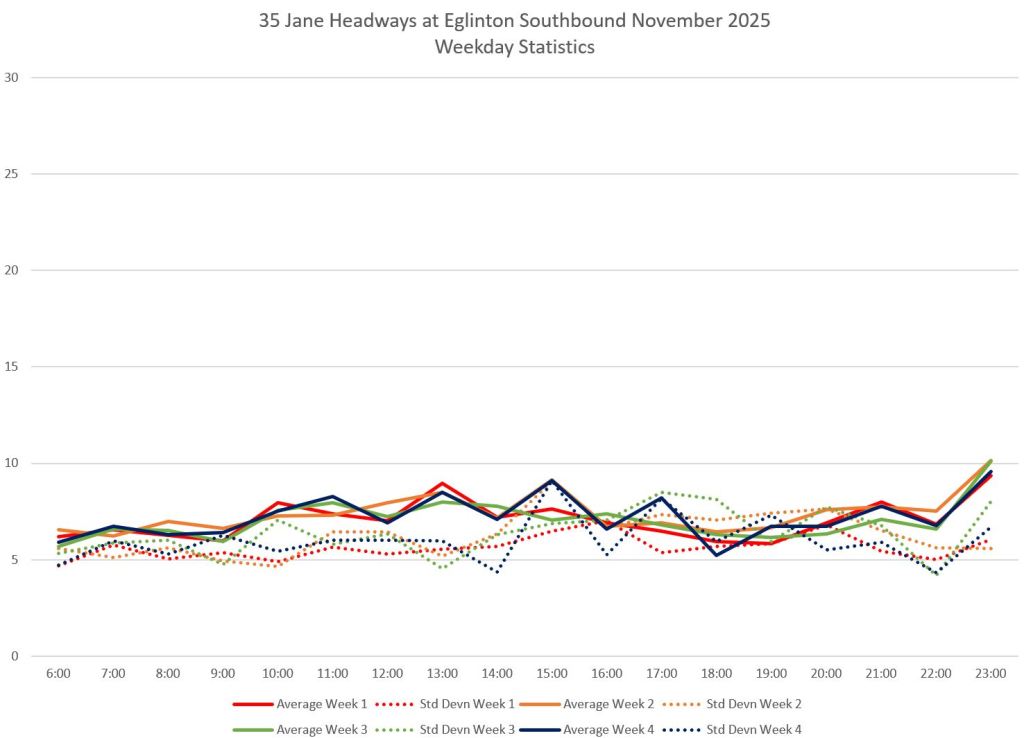
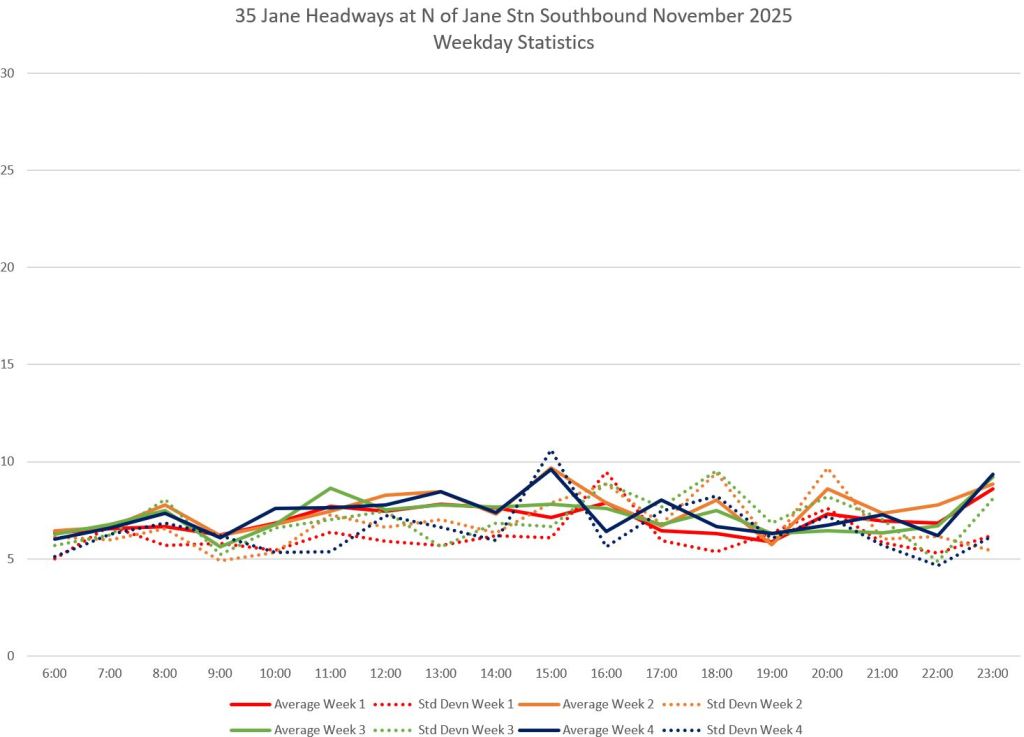
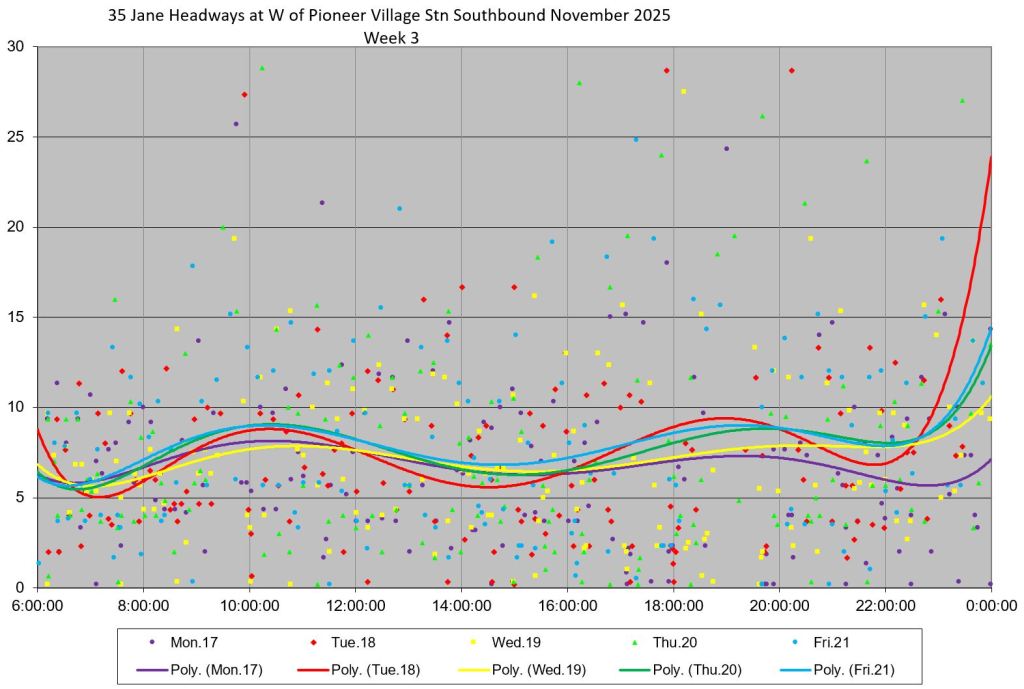
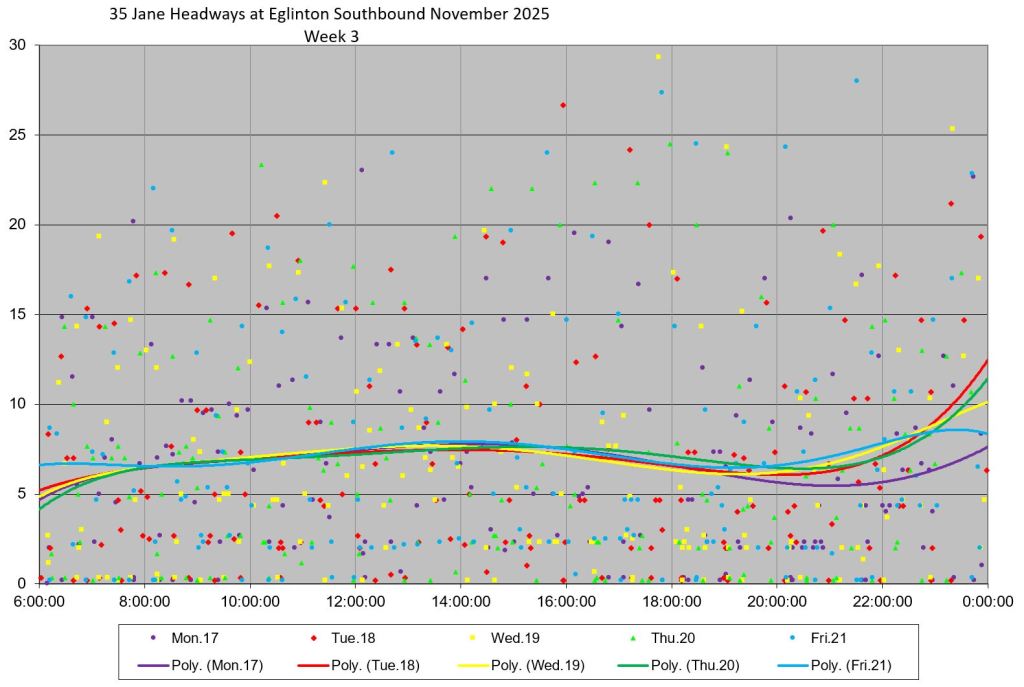
Service on 35 Jane in November 2025
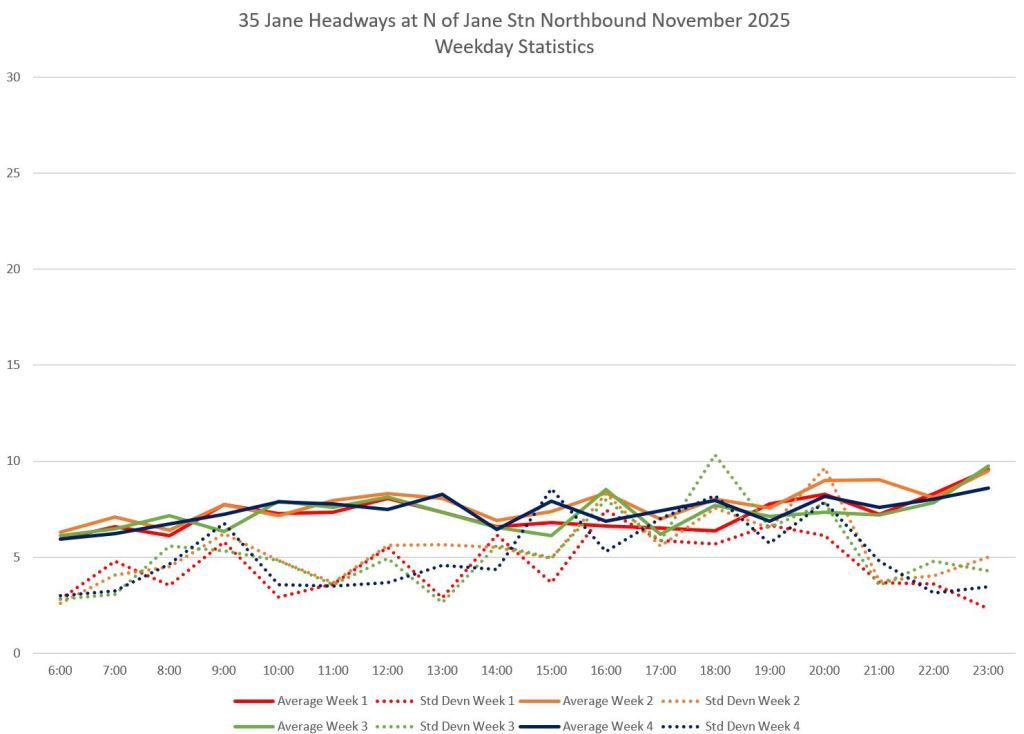
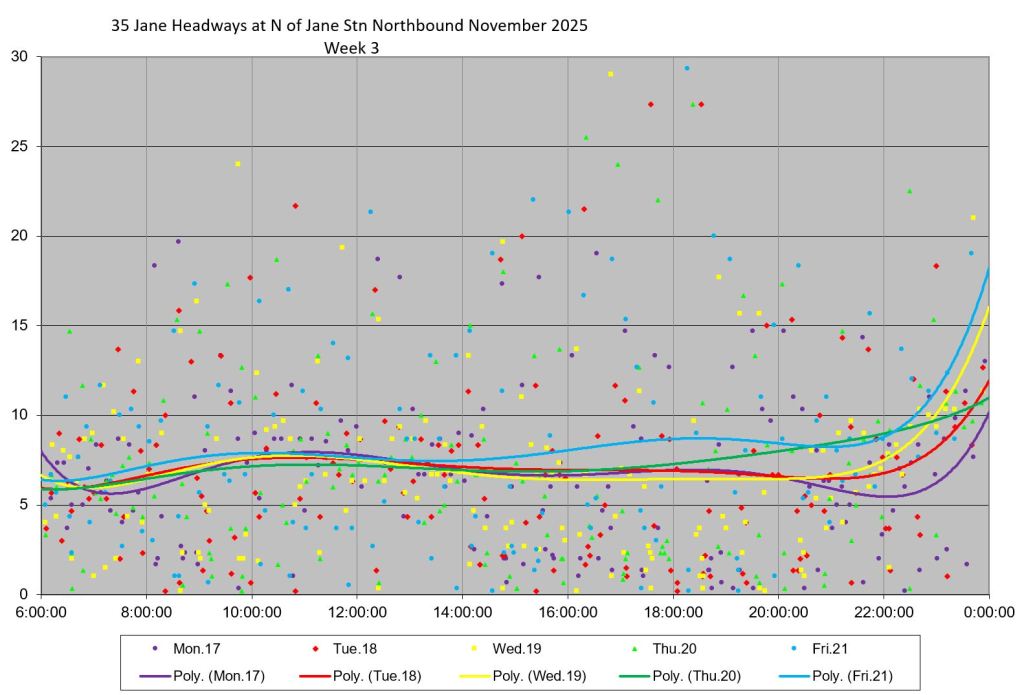
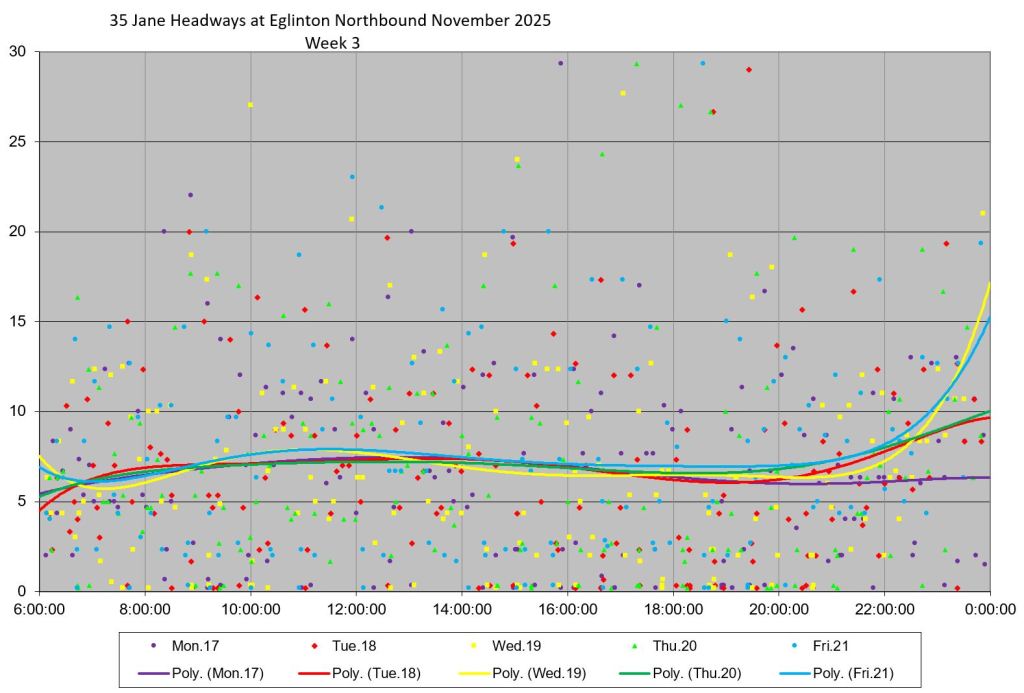
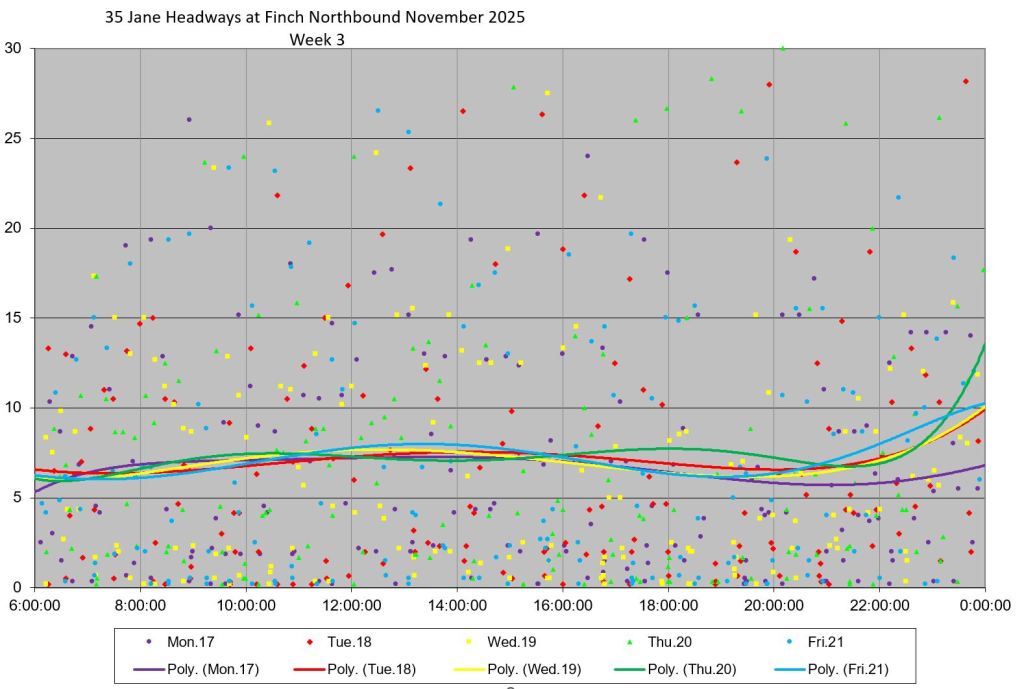
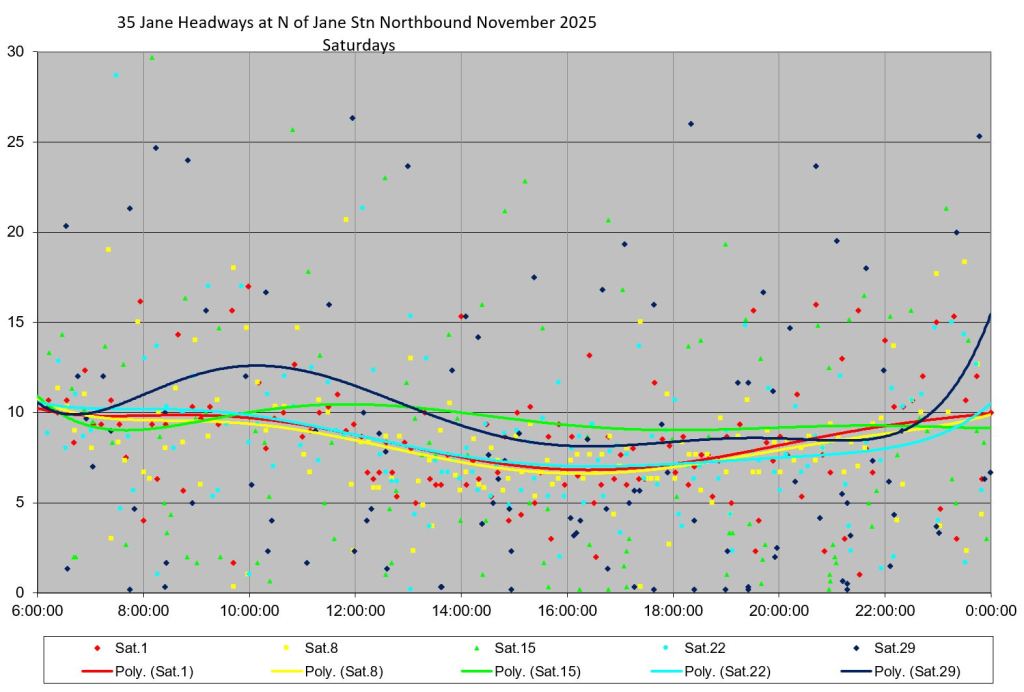
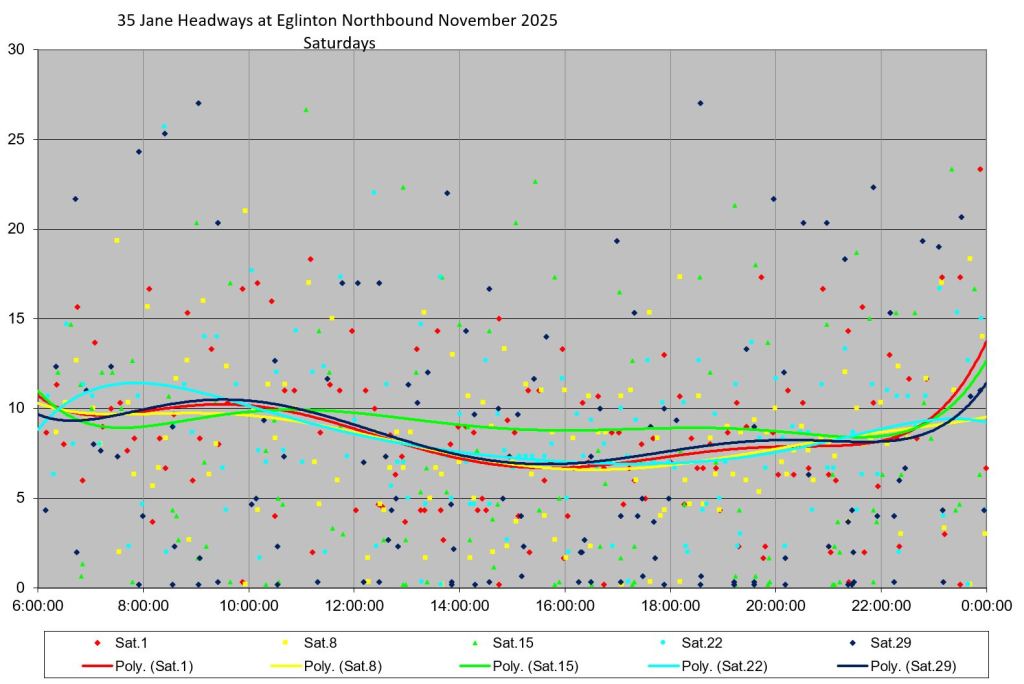
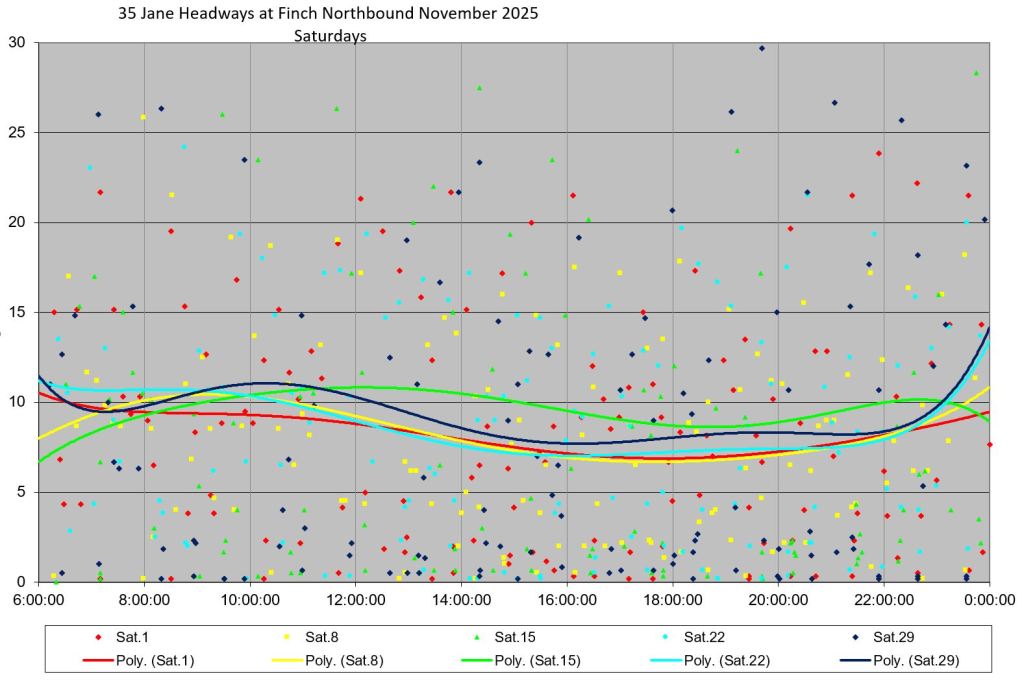
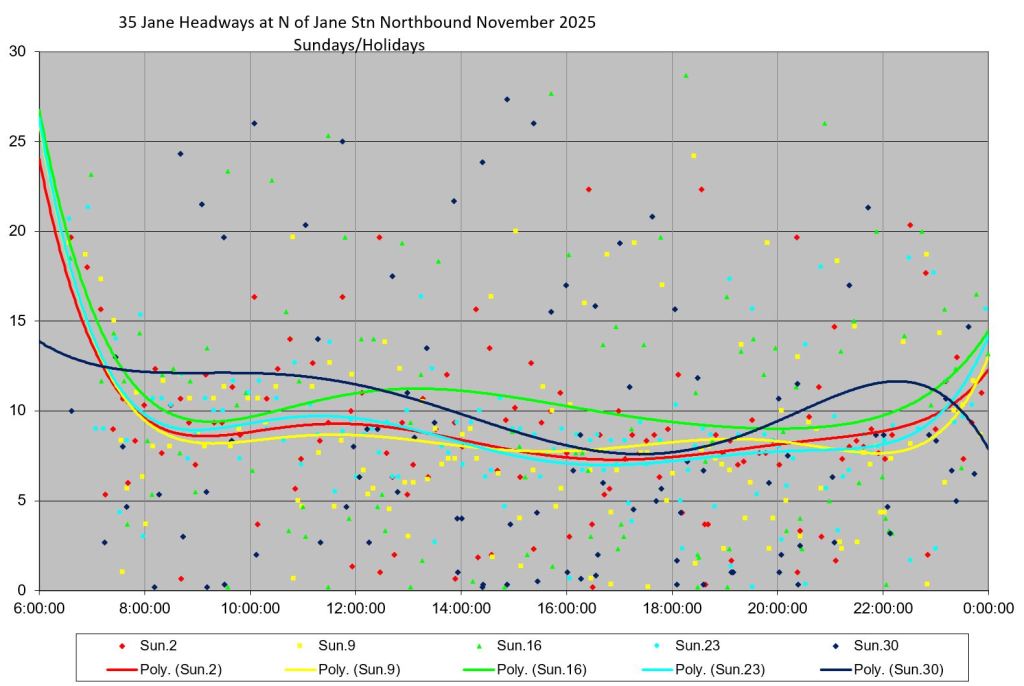
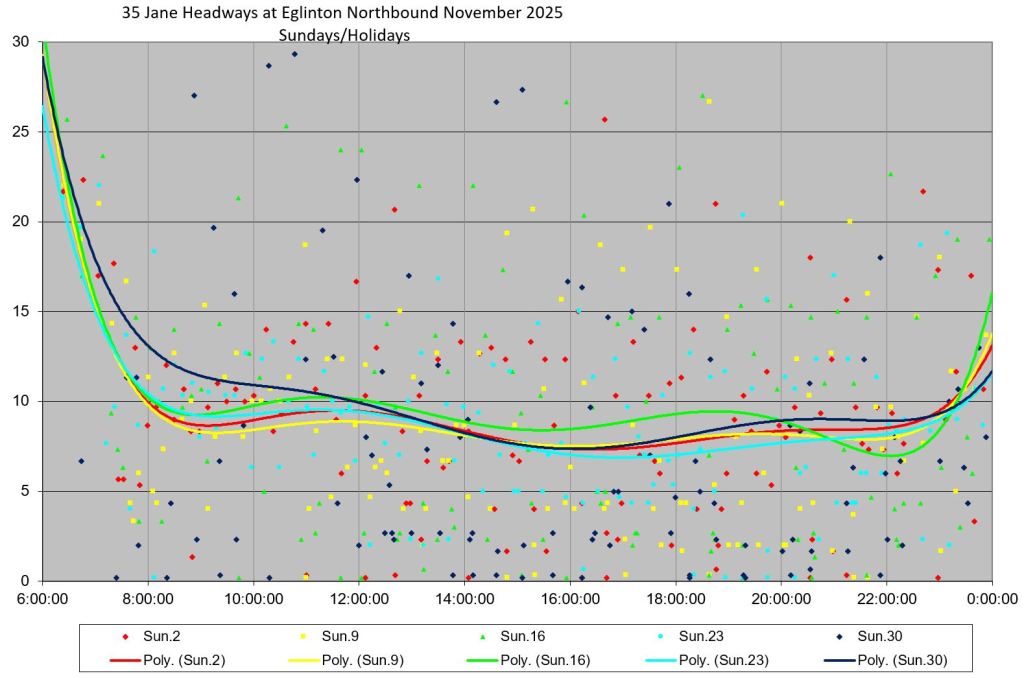
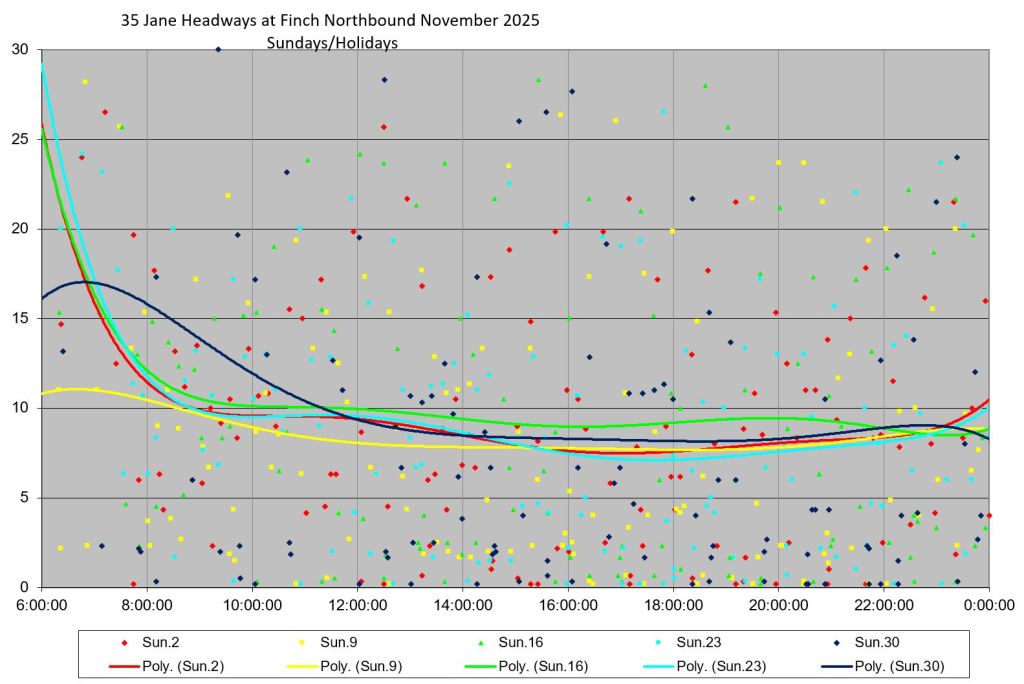
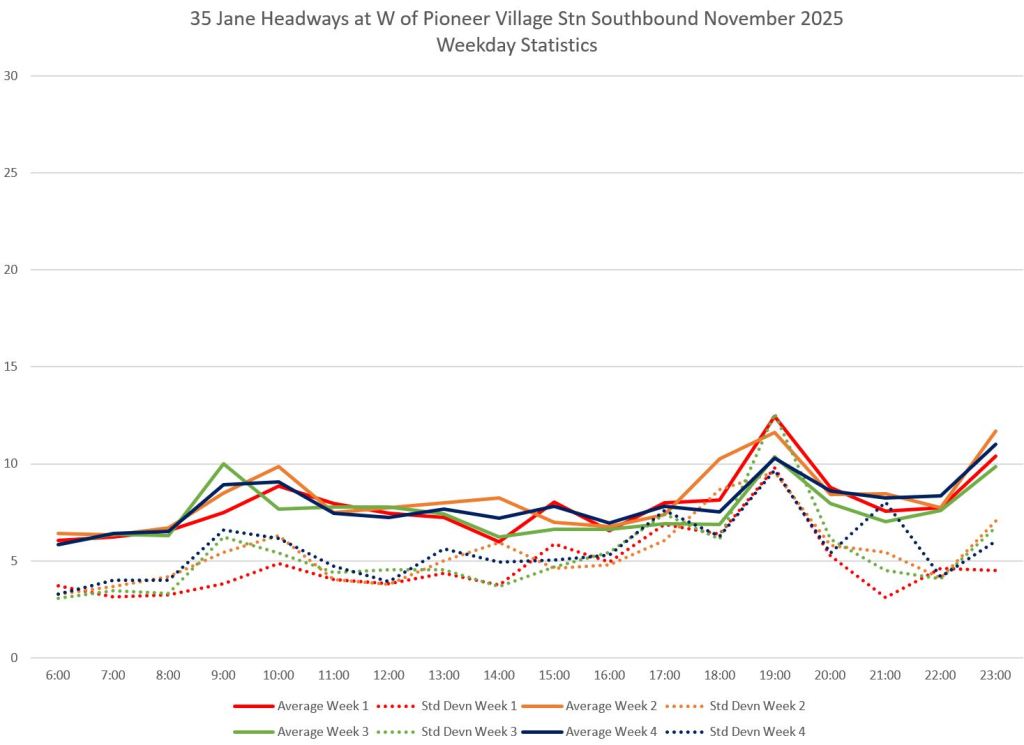
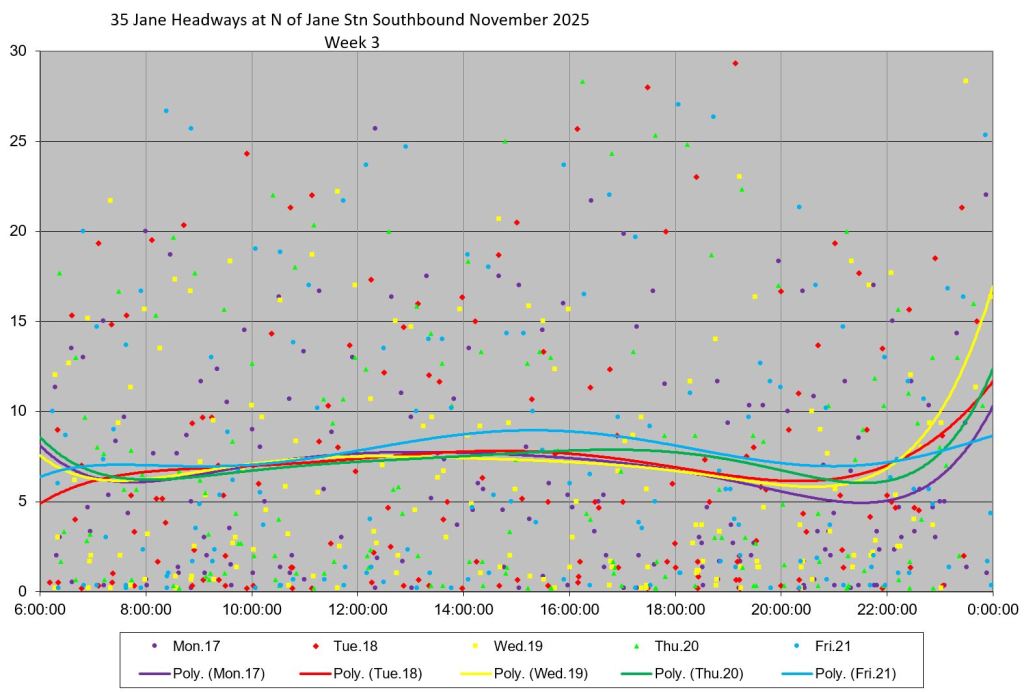
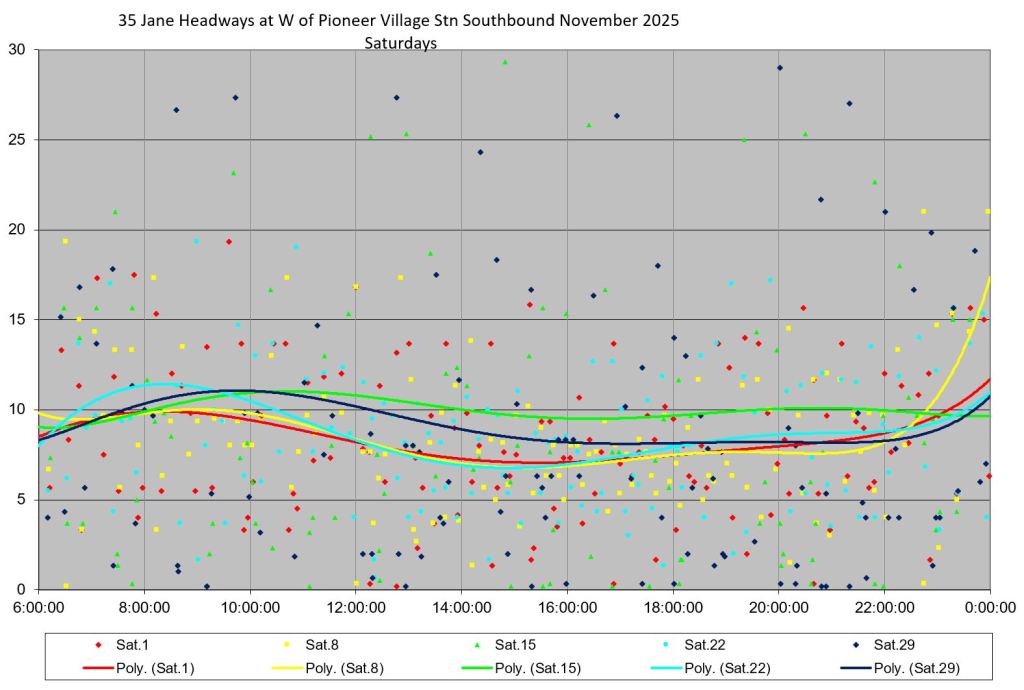
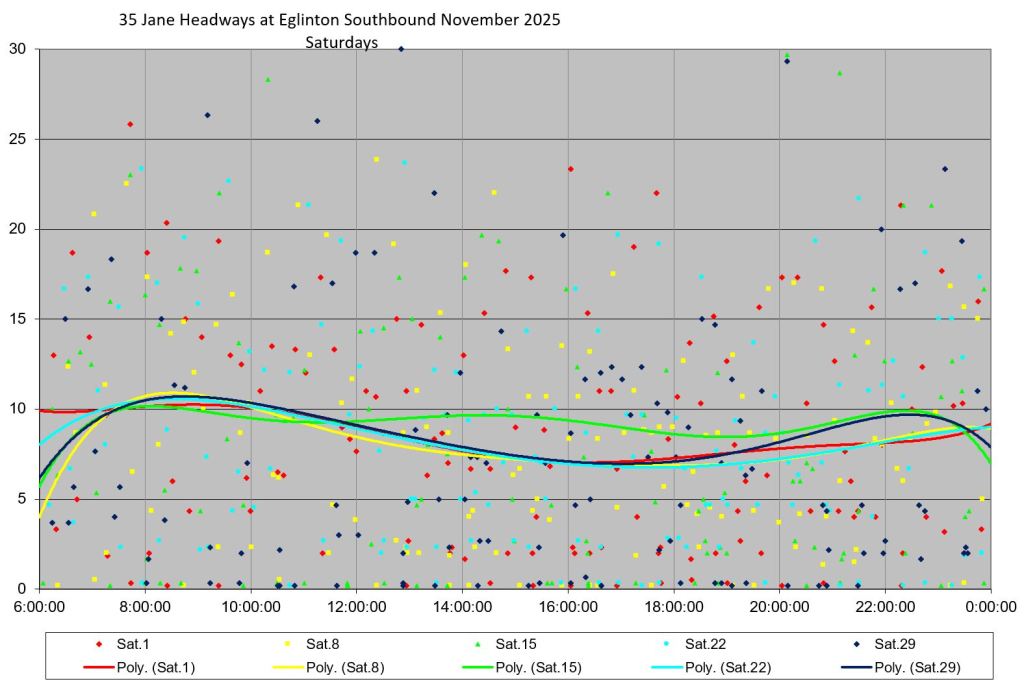
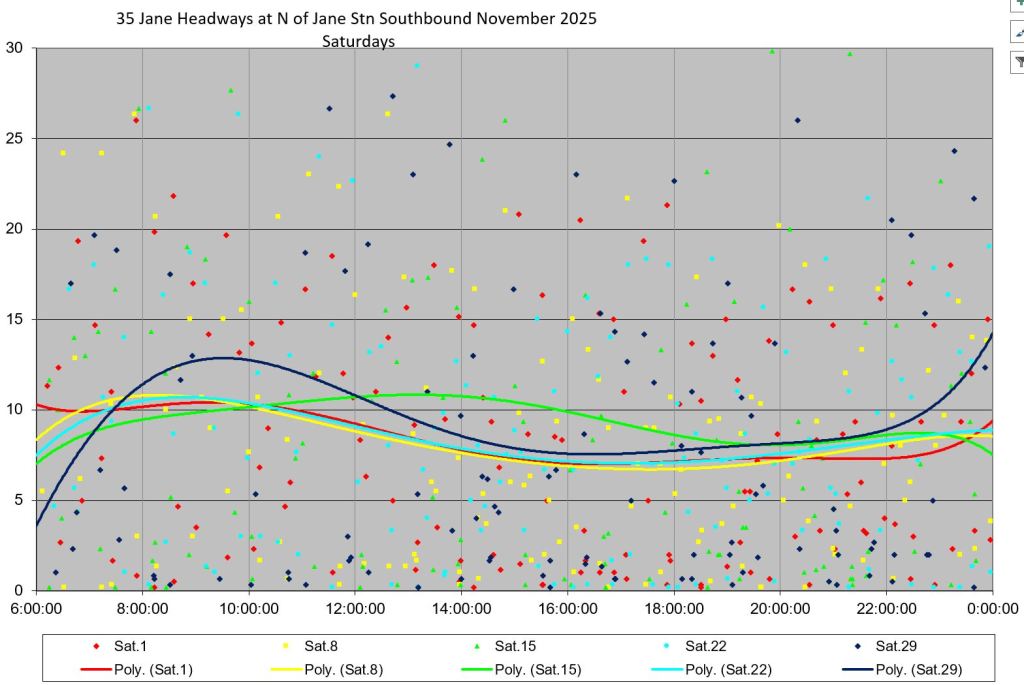
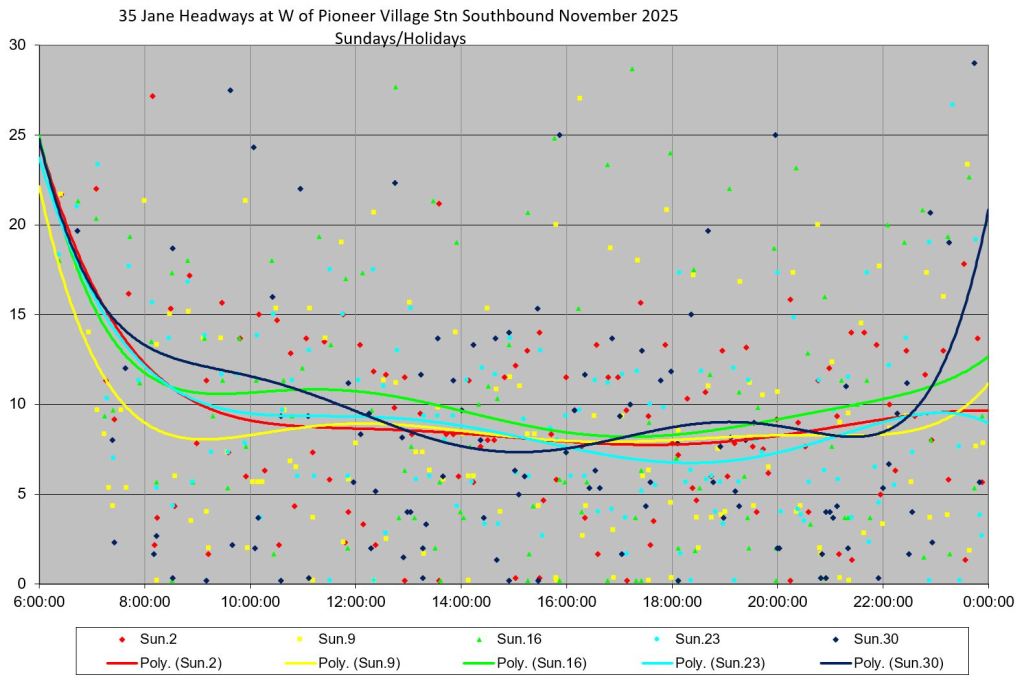
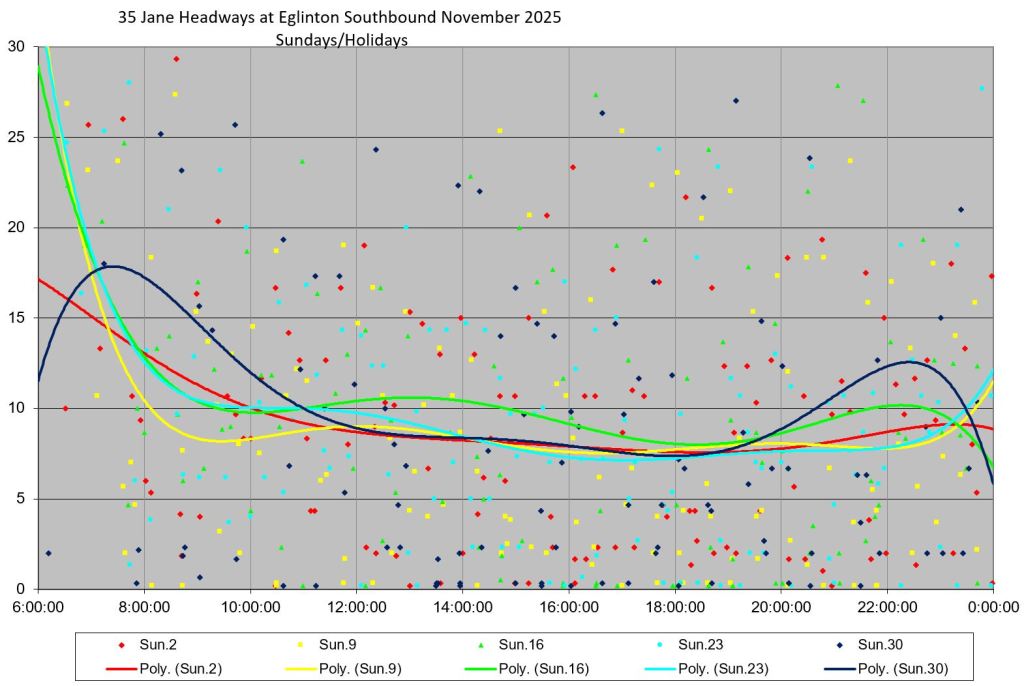
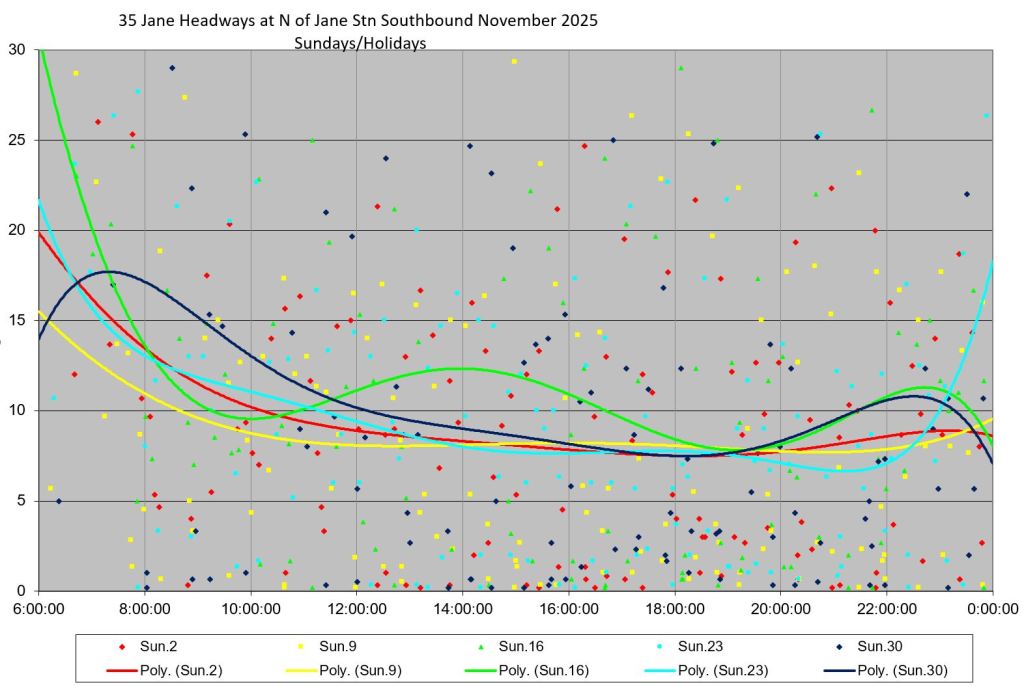
For reference, the charts below show the headway behaviour on 35 Jane when it was still a single route in fall 2025.
The charts in this section are organized reading across by location. The trip origins are on the left and the near-terminal locations on the right. Eglinton is used as a midpoint in the central column.
Headways Northbound
Service leaving Jane Station was badly bunched all day long with headways ranging up to 20 minutes and more. Weekend service was even worse with data points above 20 minutes throughout the day.
Headways Southbound
Southbound service from Pioneer Villege reflects the pattern sen northbound. Many trips run on very short headways (bunches) and many data points are at and above 15 minutes (gaps).


I have found that I would better off transferring between Jane 35 and Jane South 27 at the Eglinton Avenue West and Jane Street intersection. Staying on to make the transfer at Mount Dennis Station adds many minutes because of the distance and especially due to the Line 5 extension construction. Found that using the Eglinton Avenue West intersection to transfer between the 35/27 and Jane Express 935 might be better. Using my smartphone apps to see when the next bus will arrive is useful… sometimes.
LikeLike
the TTC loves implementing half-measures to accomplish very little, without putting in red lanes and signal priority no measure can reduce travel times by much (though the province might be to blame for lack of RapidTO implementations i haven’t looked much into it)
LikeLiked by 1 person
Would it be meaningful to measure layover time and comparing it with the scheduled terminal/recovery time?
And if we could correlate the time with how much of a gap or bunching that particular run produces.
Given that terminal departure times seem random, is it because some runs are taking long layovers and others short ones?
Of course it’s possible that all of them are taking exactly the terminal time they need to, while adjusting the recovery time to the current state of the route. But it sure doesn’t sound like it.
Steve: I have looked at terminal times on various routes, and measuring them is not as straightforward as it might seem. A bus might arrive at an offloading platform, and then park for a time, later picking up passengers and leaving. Given the geometry of some terminals, buses might loop around into a layover area, then reappear when it’s time to depart. Eglinton Station before Line 5 opened was notorious for this with a small flock of buses parked out of site.
Another problem is that if the recovery time is too long, operators have less incentive to leave “on time” because any variance will be made up at the next terminal. Indeed, when running times are excessive for actual conditions, leaving late allow driving at a reasonable pace rather than dawdling.
There is no “one size fits all” solution to this situation. Indeed there are wide variations in scheduled terminal times across the system with some routes and locations only having a few minutes (generally to round off the total trip time to a multiple of the headway) and other routes having very long layovers (sometimes to make branched schedules work). Note that this is separate from variations in scheduled travel time to deal with typical traffic conditions.
On top of this is schedule padding, a practice that took root in the Leary era because it allowed the short turn stats to go down. This happened at the expense of generally slower service and irregular terminal departures.
In practice, it is more reliable to measure arrivals and departures at a screenline just outside of the terminal. Regardless of what the bus does at the terminal, it generally crosses this line only twice, once on arrival and once on departure.
I might publish a second article looking at travel times on 27/35 Jane, but the first one felt long enough on its own.
LikeLike
I’m not sure we have to know what the bus or streetcar is doing at the terminal. So where they go and what they do in the terminal is not the first inquiry that I would suggest.
Assuming the same vehicle can be tracked before and after the terminal, we can measure the time between the last stop before the terminal, and the first stop out of the terminal. (Or any other feasible location close to the terminal.) For the south end of Jane, for example, how long between being southbound and then back northbound at Annette?
Then we might see correlations, like a vehicle that is the second or third one in a bunch (or parade) might have taken an especially short time at the terminal — so it’s looking to “soak” as I believe the terminology is. On the other hand, a vehicle that spends an especially long time at the terminal might be the cause of a big gap on the route.
I would not automatically condemn operators who took long times in terminals, at least not if it’s once or twice, because sometimes breaks are necessary for various reasons. I would be concerned if an op routinely spent minimum time in the terminal, in order to be right behind another vehicle, and thus having an easy and largely passenger-free run.
This in fact is something that the TTC route management should be right on top of. The data will show if they are, or they are not.
I hear that speed limits at terminals are being oh-so-strictly enforced these days. “This vehicle’s speed is monitored by GPS” stickers are showing up on the back of buses, I assume all will have them sooner or later. The TTC can be super-strict about certain things, calling in ops for management meetings. (We have heard this about streetcar ops and all the streetcar “safety rules”.) But is TTC management doing anything to manage operator behaviour that turns service quality on the street into a joke? I’m curious!
Steve: The idea of measuring at a screenline just outside the terminal is one I have used regularly. For example, at Jane Station, my screenline is just north of the station exit, far enough that any bus that just circles the station via Bloor is not counted as “departing” or “arriving”.
As for speed limits, there has always been the contrast that buses on streetcar routes often drive at speeds streetcar operators could only dream of. As of today, May 24, streetcars are allowed to drive at the posted limit, although some ops did this already anyhow. It will be interesting to see what changes in travel times show up over coming weeks.
LikeLike
Had thought RapidTO would have come to Jane Street once Line 5 had opened. However, seems that Metrolinx and TTC are not talking to each other.
Metrolinx has a notice that there will be lane closures at Eglinton & Jane until July 2026. Very little on the TTC website however.
Making a guess that RapidTO will not occur until either the fall of 2026 or when the Eglinton Line 5 extension to Renforth Station opens. 🥱😴
Steve: The link you provided was for work at Royal York. I have substituted the URL of the Jane Station project in your comment.
As for RapidTO, that is tied up in consultation and design, and I doubt you will see anything on that front until after the election.
LikeLike
I have ridden 27 Jane South several times since Line 5 opened when going to check out Line 5 and have been impressed with its consistent headways of every 10 minutes like clockwork compared to the 35 Jane before (when running as a single line between Bloor and Steeles) and many other TTC routes which are notorious for leaving in infrequent flocks. There seems to not be that much traffic between Bloor and Eglinton (apart from the traffic at Bloor proper and at Eglinton & Weston Road.
LikeLiked by 1 person
This is off-topic, but are you going to the “Tested in Toronto: TTC Partnerships Driving Transit Innovation” talk on Thursday during Toronto Tech Week? I’m curious, but with limited spaces, I’m not sure I could get in. But if you’re going and able to make one of your usual informative summaries, then that would be enough for me.
Steve: No I won’t be there.
LikeLike
A “good” result of splitting the 35 Jane. With Line 2 down between Jane and Ossington Station this weekend, passengers on the 35 Jane wanting to go downtown can now get off at Mount Dennis and continue on either Line 5, or if in a hurry, transfer to the GO trains at Mount Dennis to get to Union GO Station (or Bloor GO Station).
Finally, an alternative routing is available.
LikeLike
As someone who uses the 35 more than its companions on Jane, there are two major failings that need to be corrected to smooth out service.
1: Get those RapidTO lanes built. The traffic on Jane can get pretty bad. I’ve had multiple instances where it took 5+ minutes to get past Highway 400 southbound.
2: Use articulated buses to increase capacity. Frequency wouldn’t even have to change all that much theoretically.
I’m just tired of the 35 being such a mess to use. I’ve lived on Jane for 21 years and it’s always the same story.
LikeLike