
On June 17, 2020, the TTC Board will consider a proposal to implement transit priority lanes on several corridors including Finch East, Steeles West, Dufferin, Jane and Eglinton-Kingston-Morningside. This article reviews travel times and speeds for the Jane Street corridor comparing November 2011 and May 2020 data with the underlying premise that the May data show the best case for congestion-free operation.
The proposal for Jane Street run north from Eglinton to Steeles. Roadway widths and adjacent land uses vary along the corridor, and the removal of traffic lanes will have different effects along the street. A related problem will be the provision for cyclists, if any.
Note: When this article was first posted, some charts erroneously had some data labelled as “April 2018” rather than “November 2019”. This has been corrected.
Travel Times Between Eglinton and Steeles
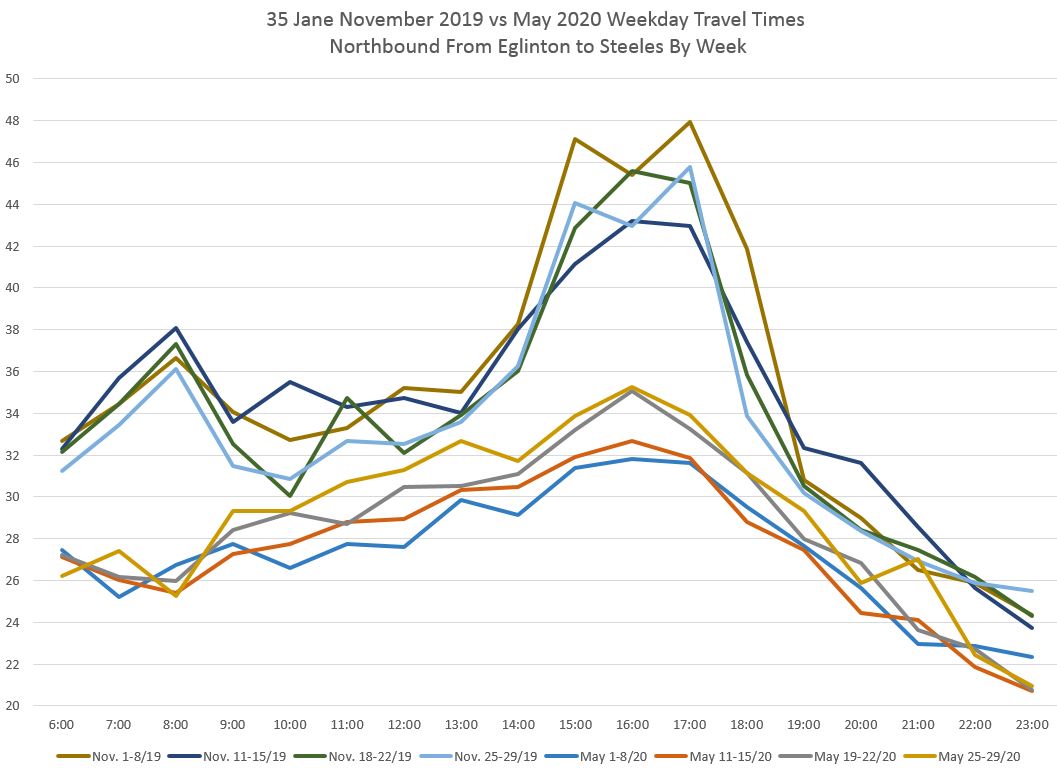
Northbound
As on Dufferin, but to a greater degree, Jane Street has a high PM peak travel time and an extended peak period. The difference between November 2019 and May 2020 is quite striking.
Looking at the weekly breakdowns, there is the same pattern here on Jane as on Dufferin – although May 2020 times are shorter than those for November 2011, they have been rising over the four weeks showing a growth in some combination of traffic congestion and stop service time.
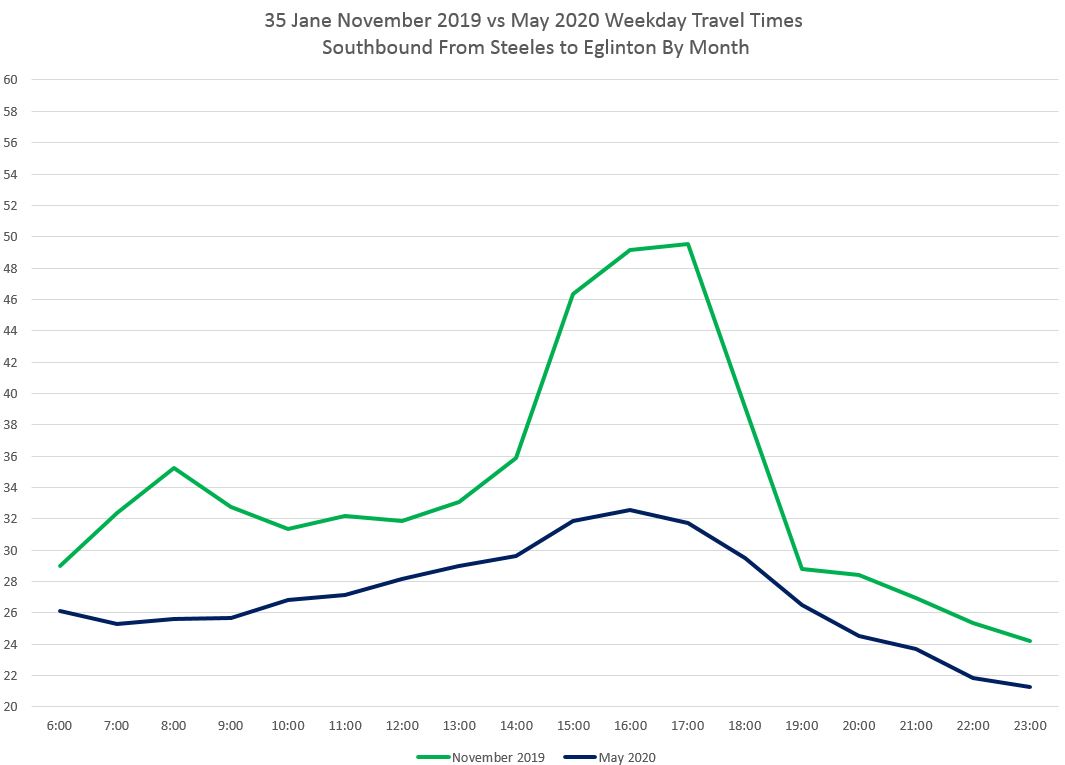
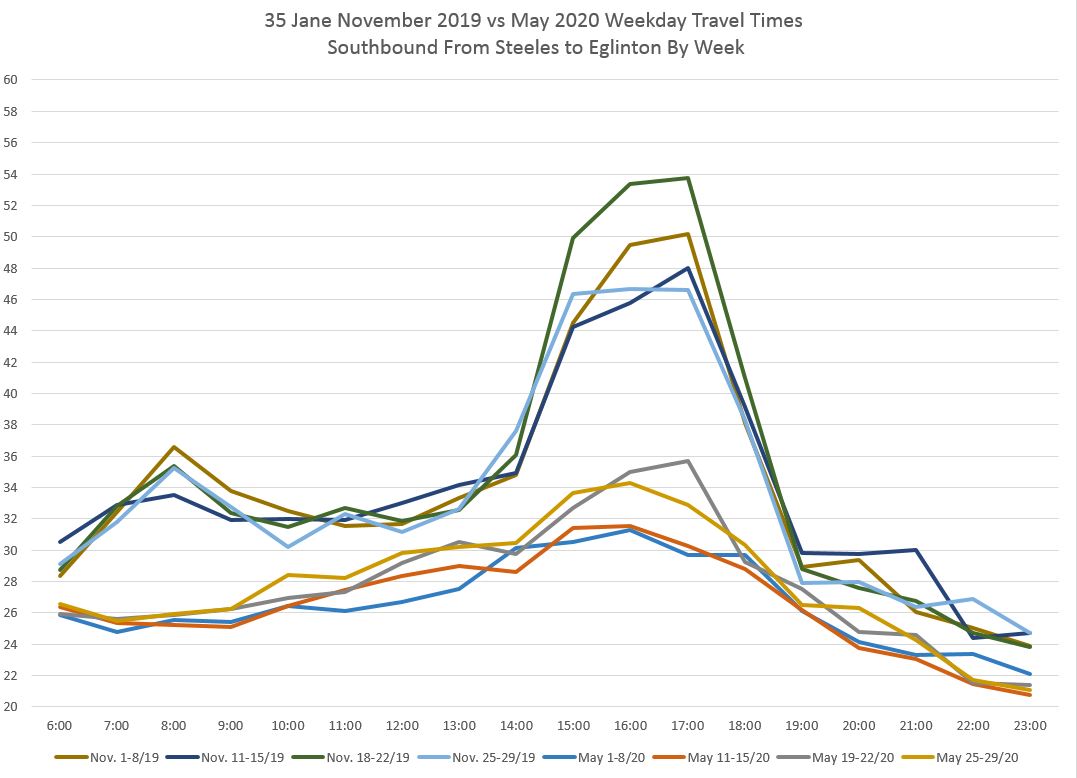
Southbound
The southbound peaks are similar to northbound and the PM peak extends over a considerable period.
The weekly breakdown shows the same pattern with growth in travel times through May 2020.
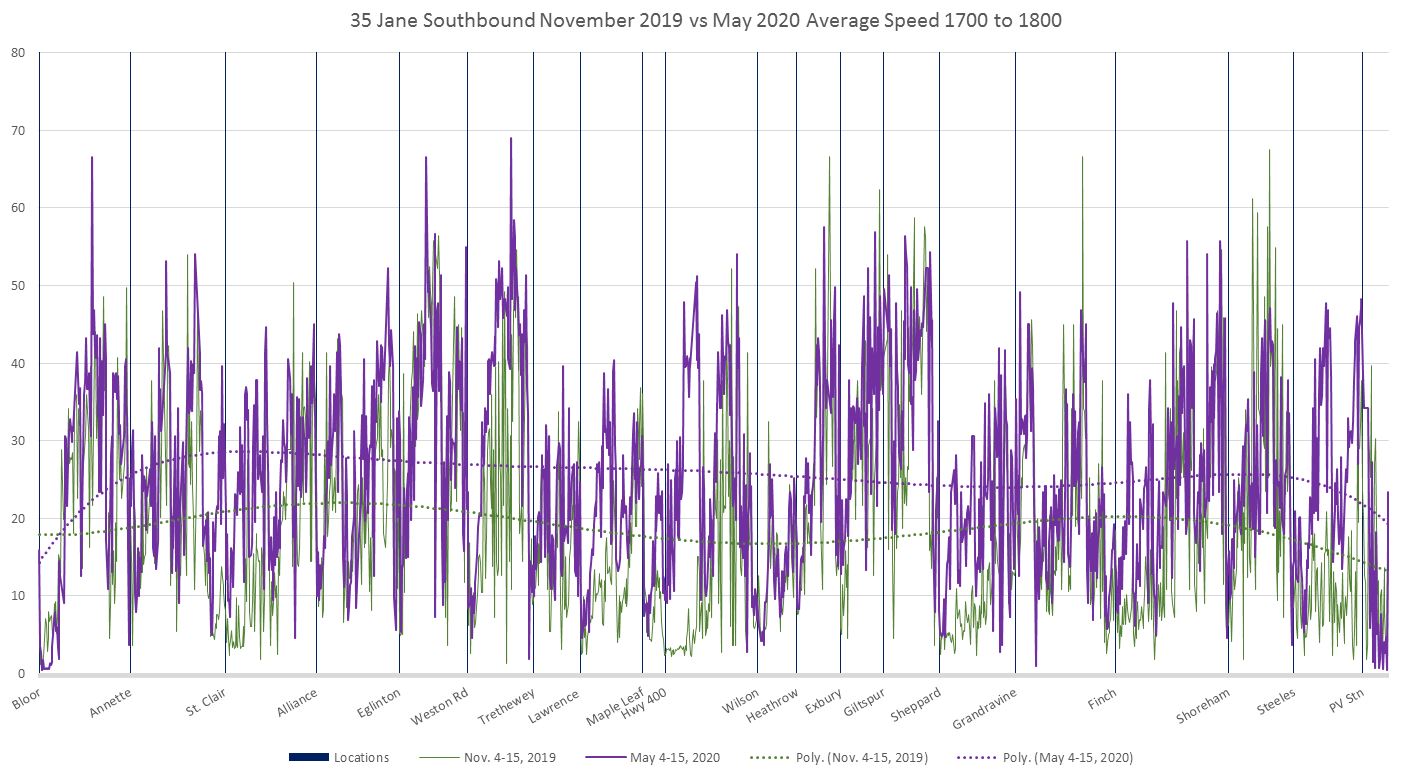
Speed Profiles
In the charts below, I have shown the entire route although the transit priority scheme is only proposed between Eglinton and Steeles to show areas where there is a substantial difference between the November and May speed data.
November data are in green while May data are in purple. Where the green shows well below the purple, this indicates areas that were congested in November relative to May.
The space between the dotted trend lines shows the overall difference between speeds, or not, by location.
Northbound
In the 8 AM peak hour, the difference between November and May speeds, as shown by the trend lines, stays fairly constant over the route. The green (November) lines dip well below the purple (May) values at several stops indicating that fewer buses were stopping in May than in November. This aspect of travel time saving is related to demand patterns, not to prevailing traffic conditions. Areas between stops (for example: approaching St. Clair or Highway 400) where the speeds are lower in November indicate traffic congestion.

In the noon midday hour, the trendlines move closer together although there are still areas, notably from Bloor to St. Clair, where operations were considerably slower in November than in May.

In the 5 PM peak hour there are again areas where November speeds were lower notably south of Sheppard and between Lawrence and Wilson.

Southbound
Note that southbound charts should be read from right to left, the direction of travel.
In the 8AM peak hour, congestion effects are visible approaching Sheppard and Lawrence, as well as at various locations south of Eglinton.

In the noon midday hour, there is less difference between November and May data implying relatively lower congestion as a source of delay.

In the 5PM peak hour there are several areas where congestion is evident in November compared to May, and some of these are not part of the proposed transit priority scheme. These include Steeles Avenue from Pioneer Village Station to Jane, southbound approaching Sheppard, north of Highway 400, between Trethewey and Weston Road, and approaching St. Clair.
Another important point from these charts is that the concept of “peak direction” congestion does not apply on this and many other routes, and the problems are at least as bad in what might be thought to be the “counterpeak” direction in the traditional view of commuting patterns and congestion (inbound AM peak, outbound PM peak).
PDF Chart Sets
Travel times:
Speed profiles:
