
Updated July 18, 2020 at 2:00 pm: 29 Dufferin is a route that I have been tracking for much longer than most bus routes. To give a longer perspective into travel times on the Dufferin corridor, I have added a section looking back to 2011.
Route 29 Dufferin is one of five corridors proposed for rapid implementation of reserved bus lanes in a proposal that will be at the TTC Board on June 17. Others include Finch East, Eglinton-Kingston-Morningside, Steeles West and Jane.
In this article, I will review travel times and speed data for Dufferin comparing conditions in April 2018 and May 2020. (2018 is used because I do not have any more recent pre-covid data.) The premise of this comparison is that May 2020 represents conditions on the route with all or most traffic congestion removed revealing the underlying conditions that would apply in a best case transit priority lane implementation.
Dufferin Street is very different from the other proposed corridors because for much of its length it is only four lanes wide with houses and businesses fronting onto the street and little or no opportunity for widening. On the northern portion where the street allowance is wider, there is a combination of four through traffic lanes with bays for right turns and bus stops.
Creation of a reserved lane will involve both a reduction of capacity for non-transit traffic and removal of parking. Depending on whether the lanes are in effect only during peak periods or longer, parking will be a big political issue as it was for attempts to improve transit operations on streetcar routes.
Before the King Street Pilot was proposed, the City reviewed parking regulations on the shoulders of peak periods to determine whether they should be extended. (Full disclosure: I worked on this project as a consultant.) With the growth of traffic over many years, the peak had expanded beyond its traditional 7-9 AM, 4-6 PM periods. Travel time charts would clearly show two super-peaks on either side of the official two-hour period as transit vehicles were fighting peak level congestion when parking and turn restrictions were not in effect. From this study, many areas had their peak periods extended by 30 or 60 minutes on either side of the original hours so that the period could be as long as 7-10 AM and 3-7 PM.
There was a lot of push back on this scheme from local businesses who regarded parking as essential to their operations, and there were tradeoffs in the final scheme to limit the expansion of peak restrictions. For example, a proposed no parking restriction on Broadview near Danforth was changed to end at 6:30 pm instead of 7:00 pm. It is worth noting that on Queen Street in The Beach there are no extended restrictions and the traditional two-hour windows apply. It would be intriguing to know whether Councillor Bradford, the author of the motion, would agree to elimination of parking in his ward in the name of speeding up the Queen car.
Parking is already banned in some locations on Dufferin Street from 7-10 AM and 3-7 PM, but the traditional hours are more common, and some locations have no restrictions at all. There are many locations where motorists would routinely move into a “reserved” curb lane to access off-street parking and laneways, as well as for right turns.
There is also the question of how bicycles would fit into any new street design.
Overall, the challenges on Dufferin Street are not straightforward and, like the much shorter King Street Pilot, they will require detailed block-by-block review.
Travel Times Between King and Wilson
In the following charts, note that changes in travel times will be due to a combination of two factors: the level of traffic congestion and the time spent at stops loading and unloading passengers. Transit priority can reduce the effect of congestion, but stop service times are a function of service level and demand, and especially of the degree to which crowding prevents a speedy movement of passengers onto and off of buses.
Budgetary constraints drive the TTC to run as close to its capacity standards, if not over them, as a routine practice. The degree of crowding is only rarely reported, and the cost in terms of service delays is not considered. A vicious circle can develop where headways are widened and travel times stretched in response to this type of delay, but this reinforces crowding problems while providing a “no cost solution” so beloved by simplistic political analysis.
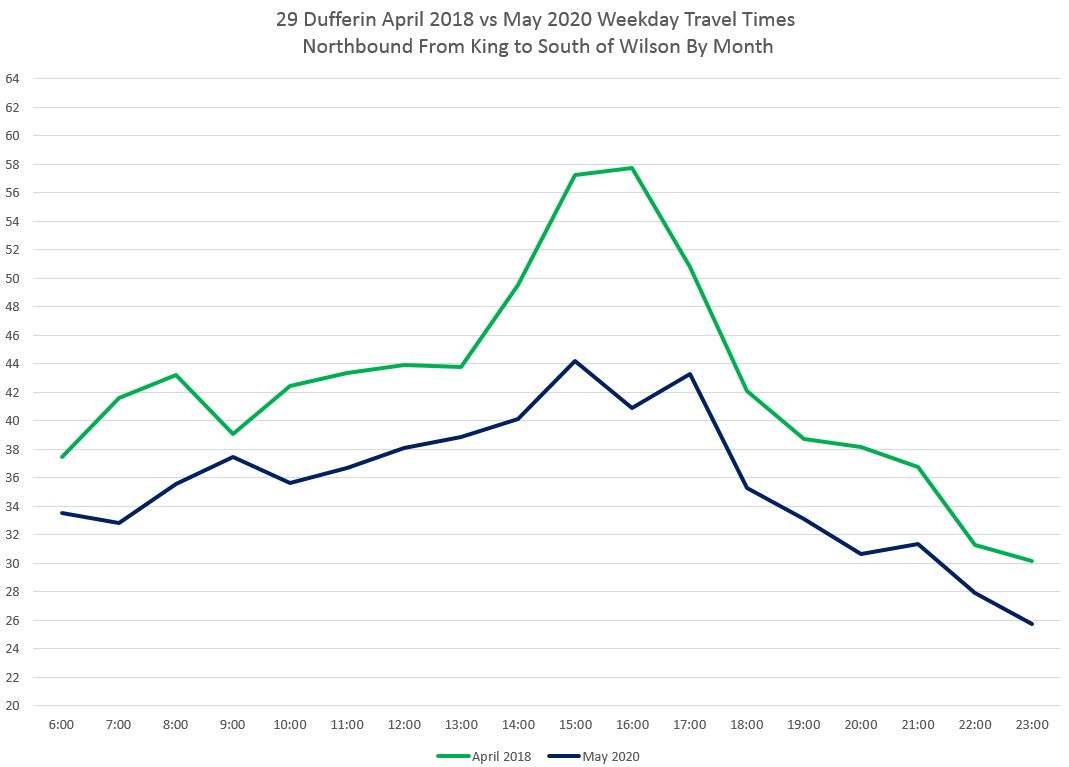
Northbound
Between April 2018 and May 2020, there has been a big drop in the average travel times from King to Wilson during the PM peak, with much less of a drop in other periods. It is worth noting that there is still a small PM peak effect in the 2020 data, but this could be as much a function of stop service time as of traffic congestion. Note also that the peak begins to build at 2 PM and is wider than the traditional two-hour period.
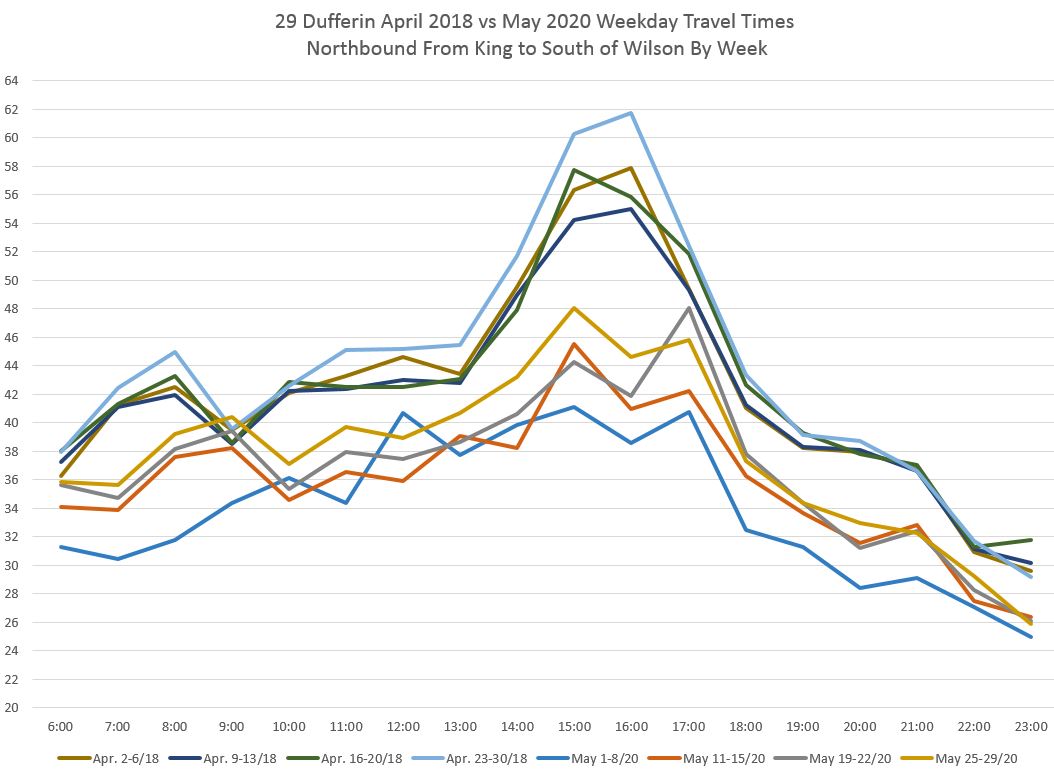
When the data are broken down by week, two bands are clear, but within the 2020 data it is noteworthy that the travel times have been climbing through the month.
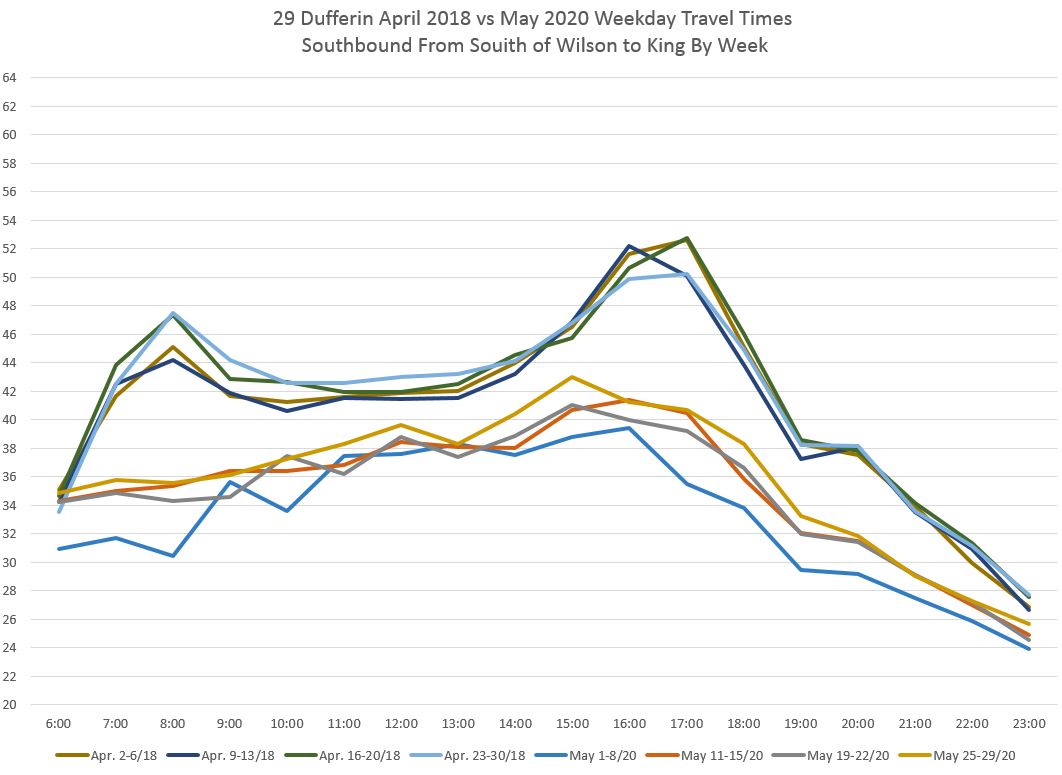
Southbound
The difference between 2018 and 2020 travel times is smaller southbound than northbound, but there is still a visible hump, as opposed to a peak, through the afternoon.

As with the northbound data, the southbound numbers show a gradual rise in travel times through May 2020.
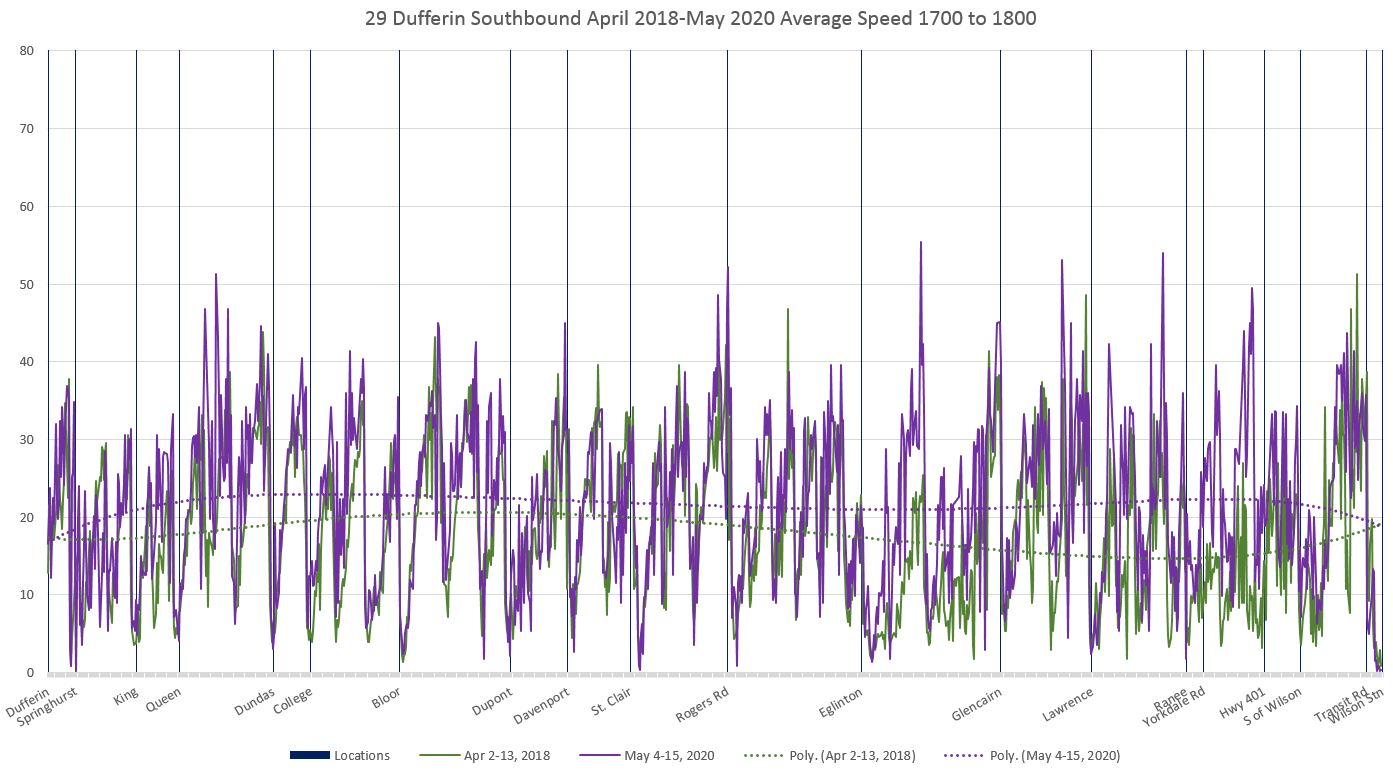
Speed Profiles
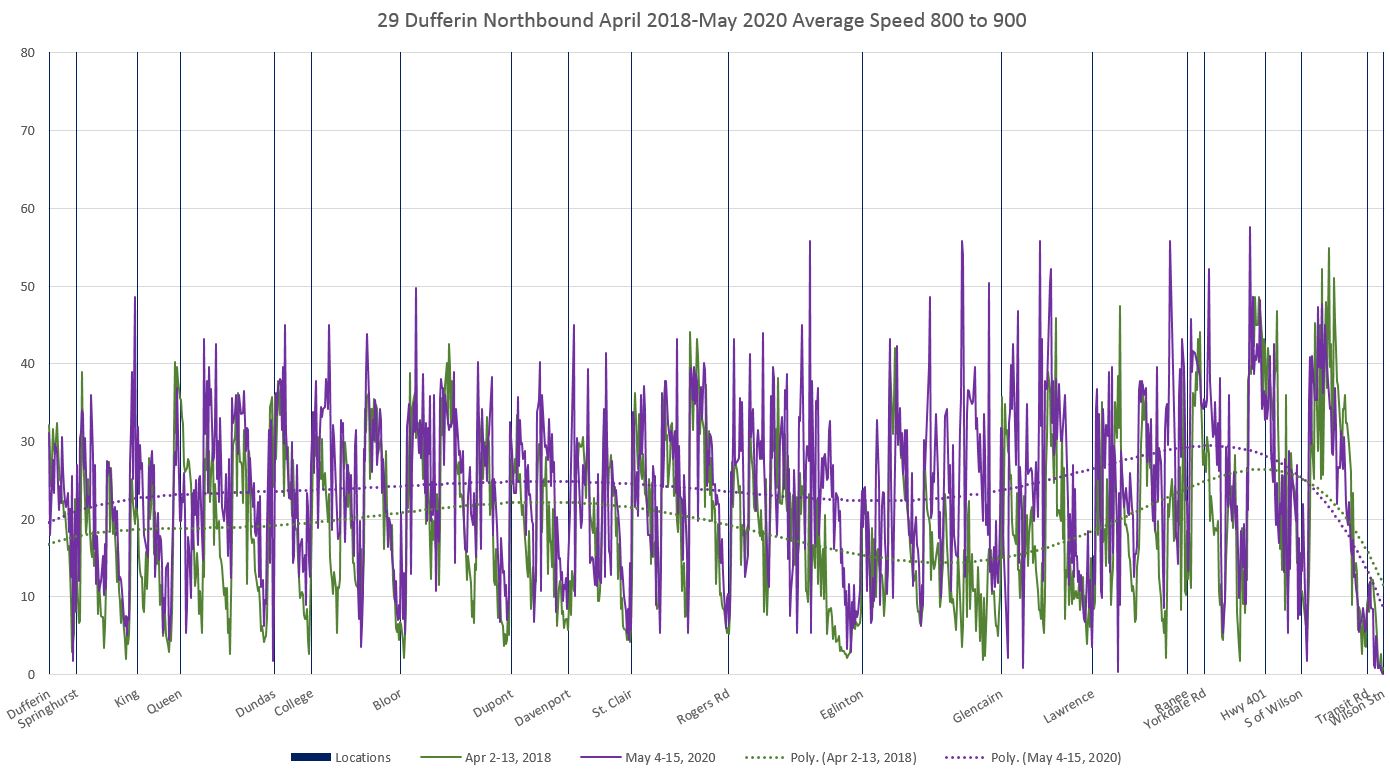
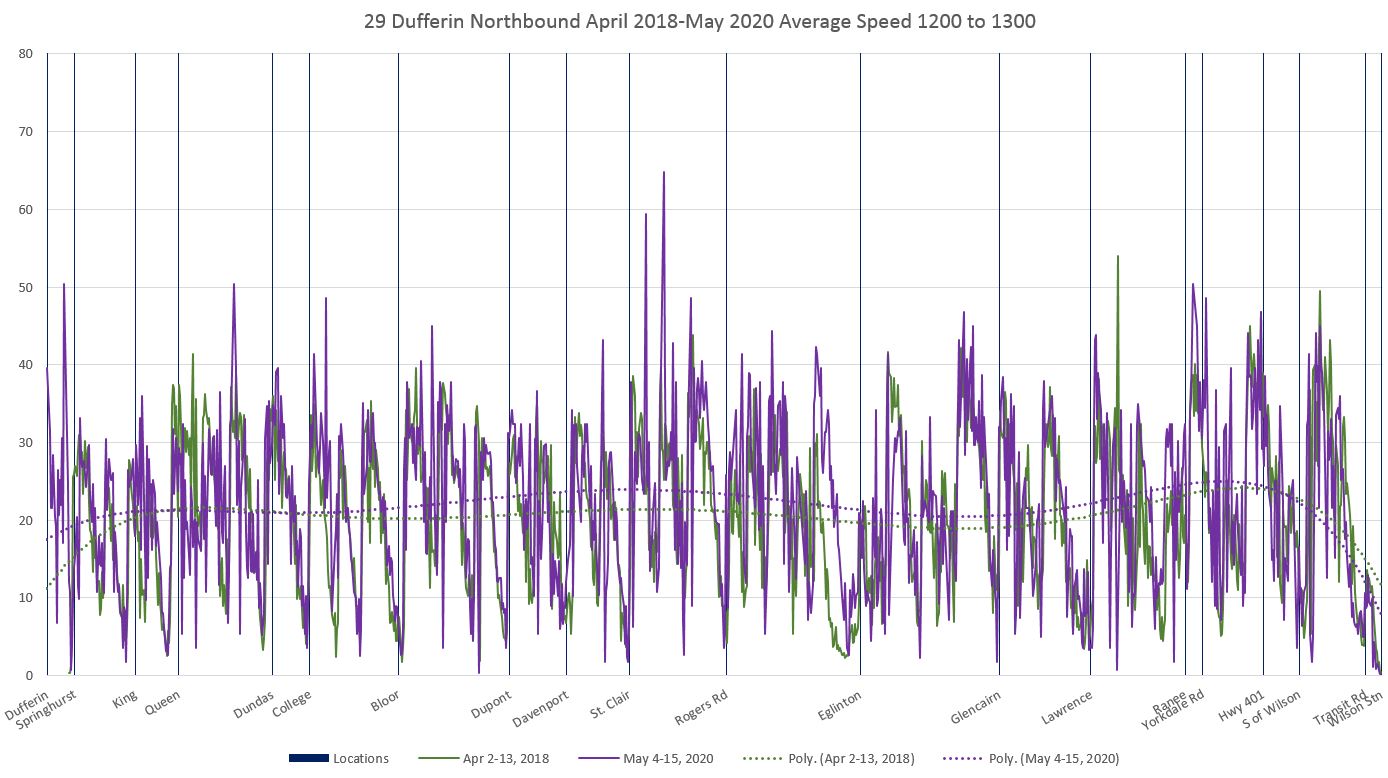
The charts in this section compare the speeds of buses on Dufferin along the route in each direction and on an hourly basis. Within each chart, the green line shows 2018 data, and the purple line shows 2020. Where the green line “peeks out” below the purple one, this indicates locations with slower speeds in 2018 than in May 2020.
Where the 2018 lines dip lower than 2020 at stop locations, this can be due to fewer buses actually stopping either because nobody wants the stop, or because the bus is full.
The dotted trend lines show the overall behaviour of the data. The spread between the trend lines, if any, illustrates the portions of the route with varying differences in travel speed.
Northbound
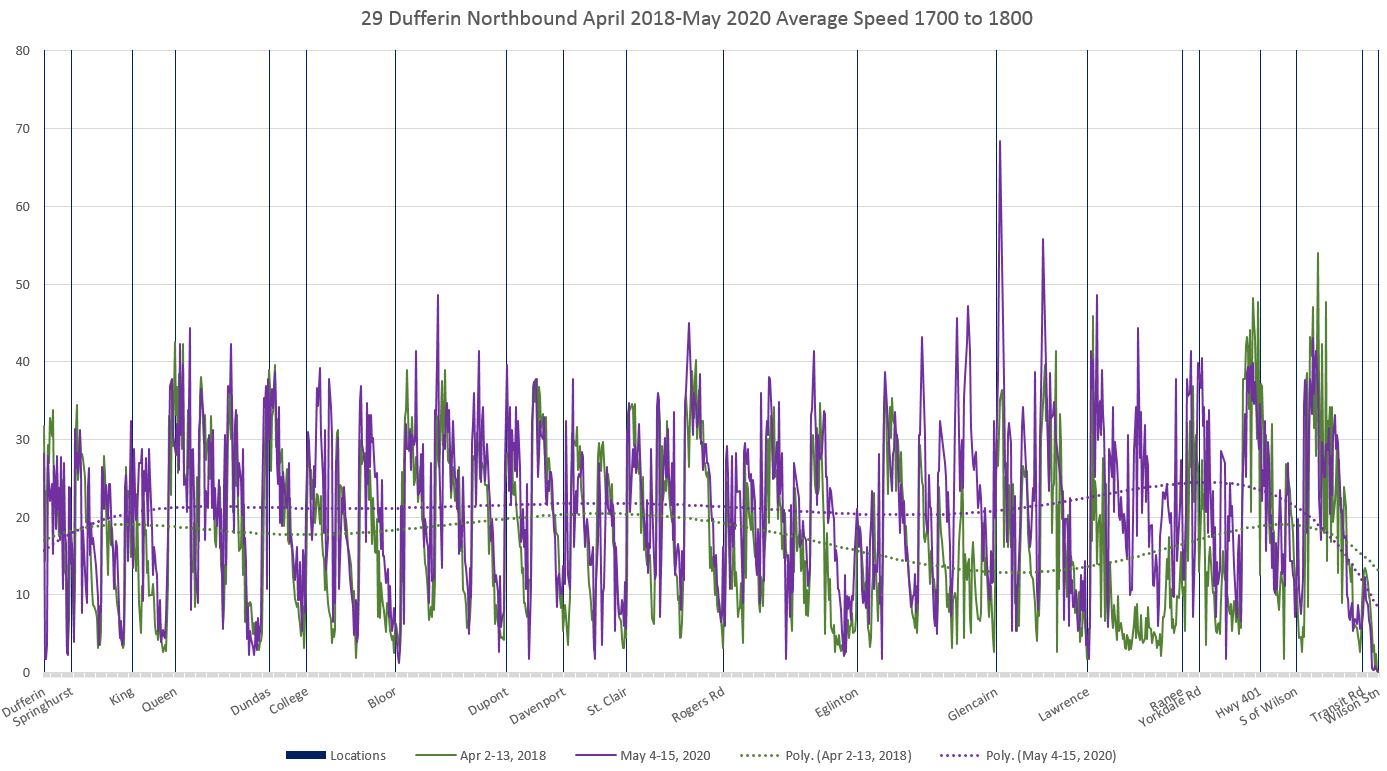
In the 8 AM hour, 2018 data show slower operation especially approaching Eglinton and Glencairn.
Midday data show little difference in speeds.
The 5 PM data show smaller differences at Eglinton and Glencairn than in the 8 AM chart, as well as an extended area of congestion north of Lawrence to Yorkdale. The area around Yorkdale has chronic problems especially during busy shopping periods (e.g. Christmas) and removal of lanes for transit would have a major effect on other traffic.
Southbound
Southbound speeds in the 8 AM hour are lower in 2018 than 2020, but the difference is distributed along the route moreso than northbound.
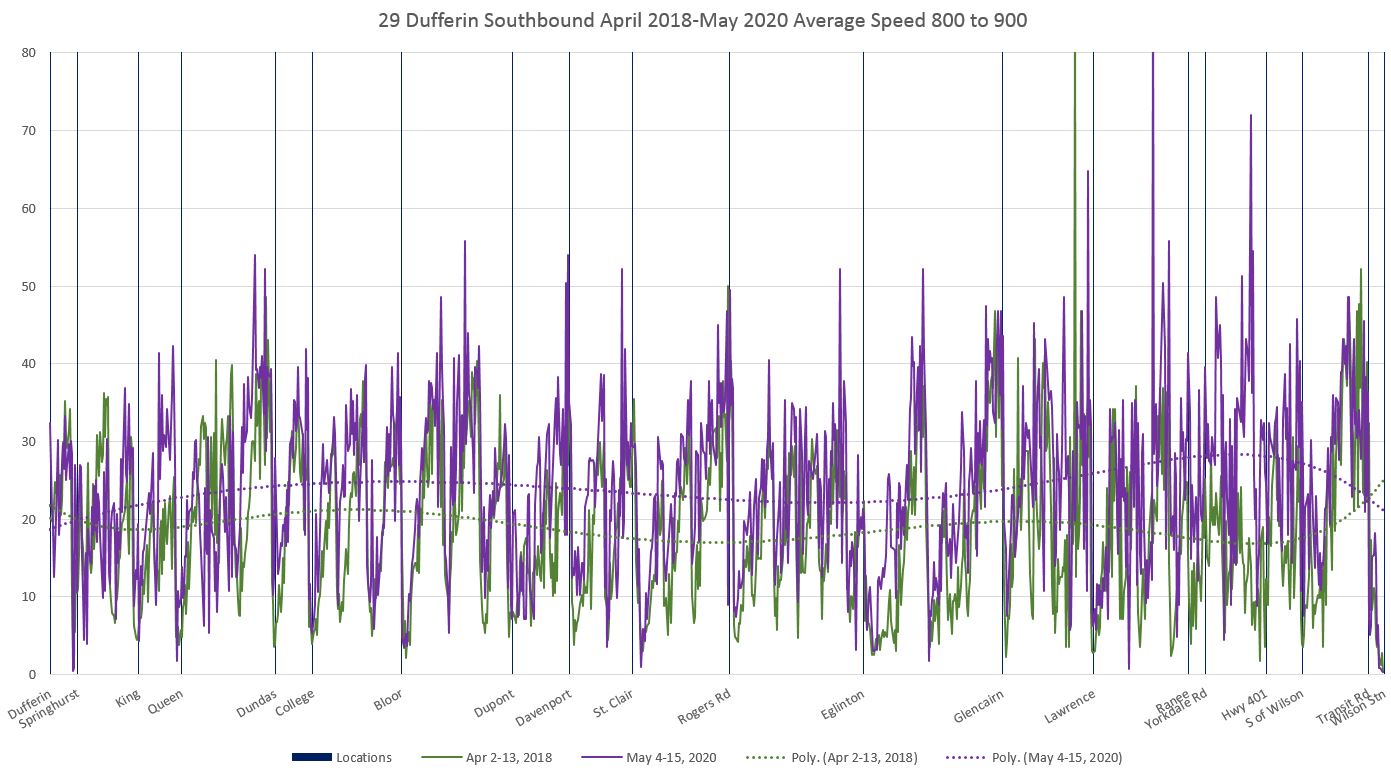
As with the northbound data, there is little difference in travel speeds for 2018 versus May 2020.
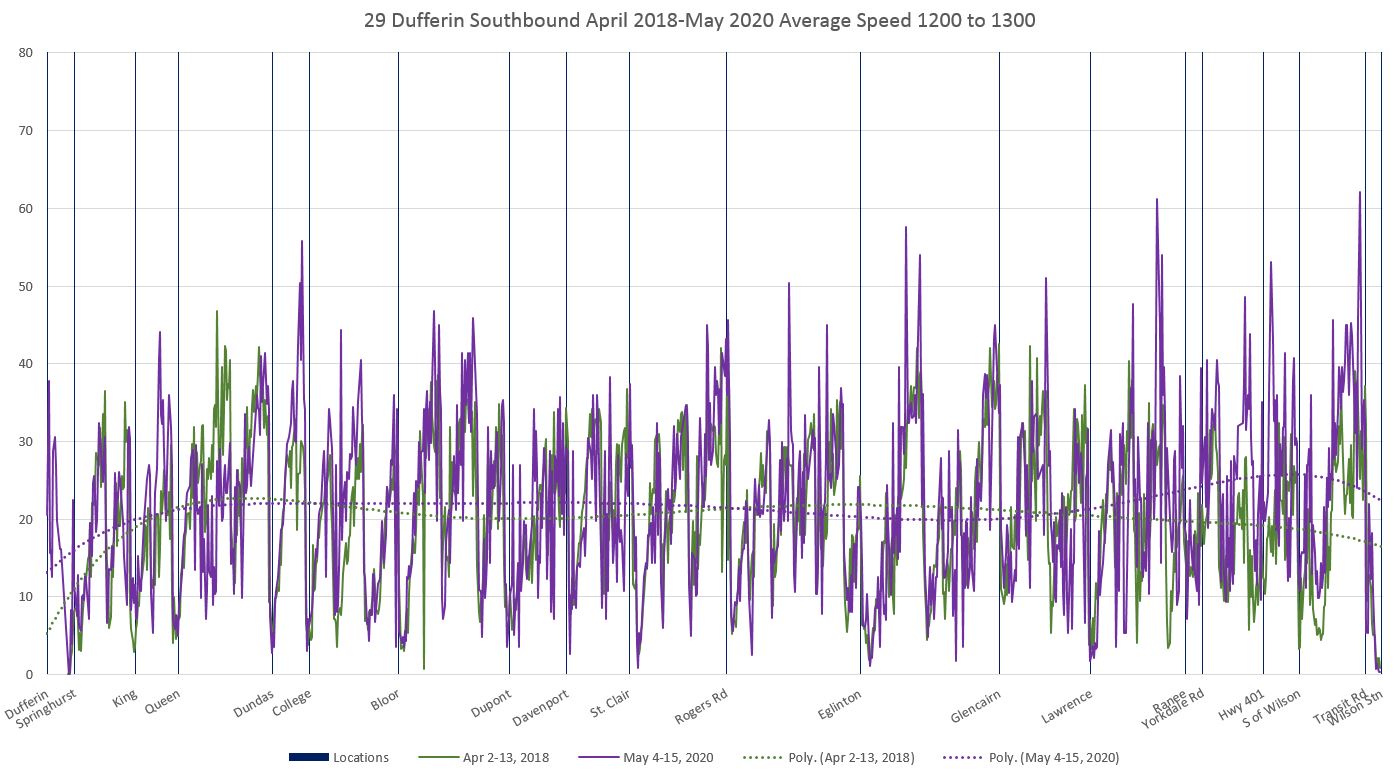
In the afternoon, the 5 PM hour shows slower speeds at the north end of the route than further south.
PDF Chart Sets
These pdfs include the monthly and weekly comparison charts:
These pdfs include the speed charts with one page for each hour from 6 AM to midnigt:
Looking Back to 2011
In the charts comparing 2018 to 2020, the very large rise in PM peak travel times intrigued me especially because the location contributing most of the congestion was in the suburbs, not in the “old” city. Here is a closeup of the northbound speed profile for the route between 5 and 6 pm from Eglinton to Wilson (the full chart is linked above in this article). The green line shows April 2018 data while the purple one shows May 2020. There is some congestion south of Eglinton due to the Crosstown construction, but extended areas south of Glencairn and from north of Lawrence to Yorkdale where buses were much slower in 2018 under pre-covid conditions than they are in 2020.
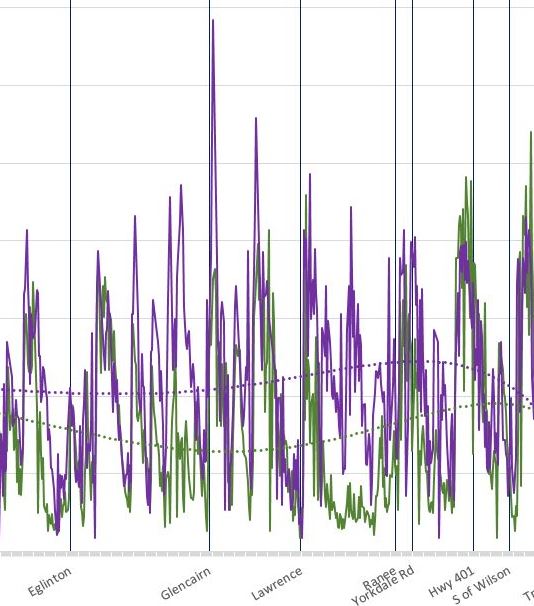
To put it another way, if there is to be a substantial improvement in travel speed, it will not be achieved without addressing this segment of the route.
The next question is “was it always like this”, and for that I dove into older data.
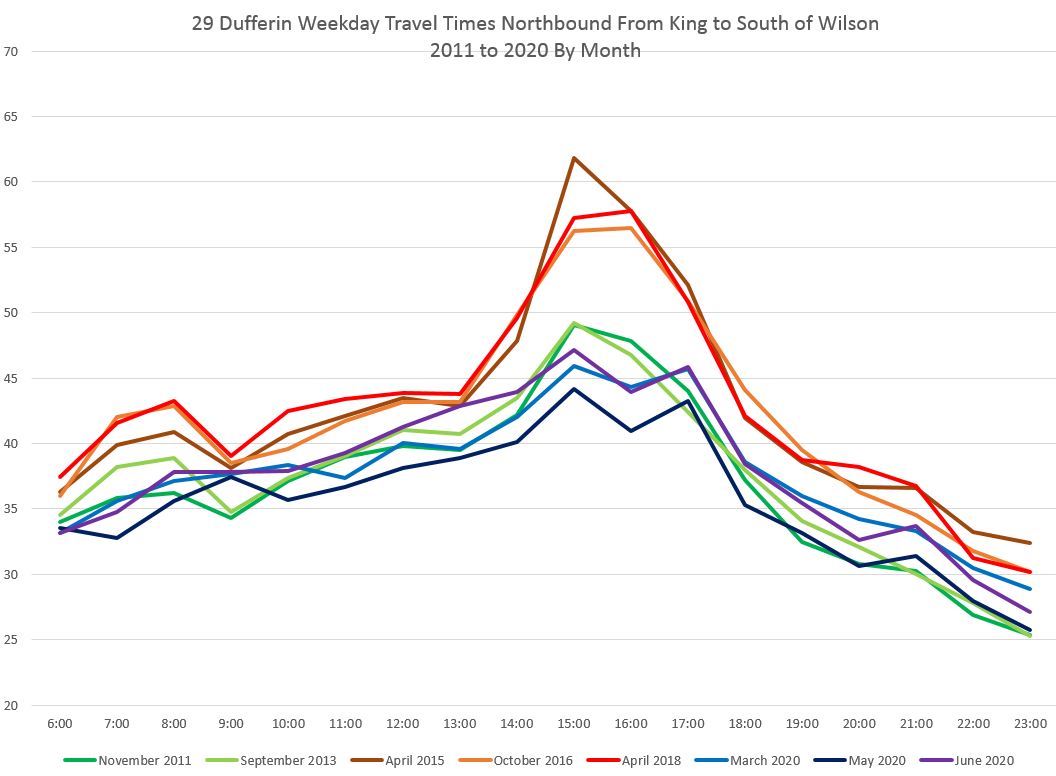
Northbound
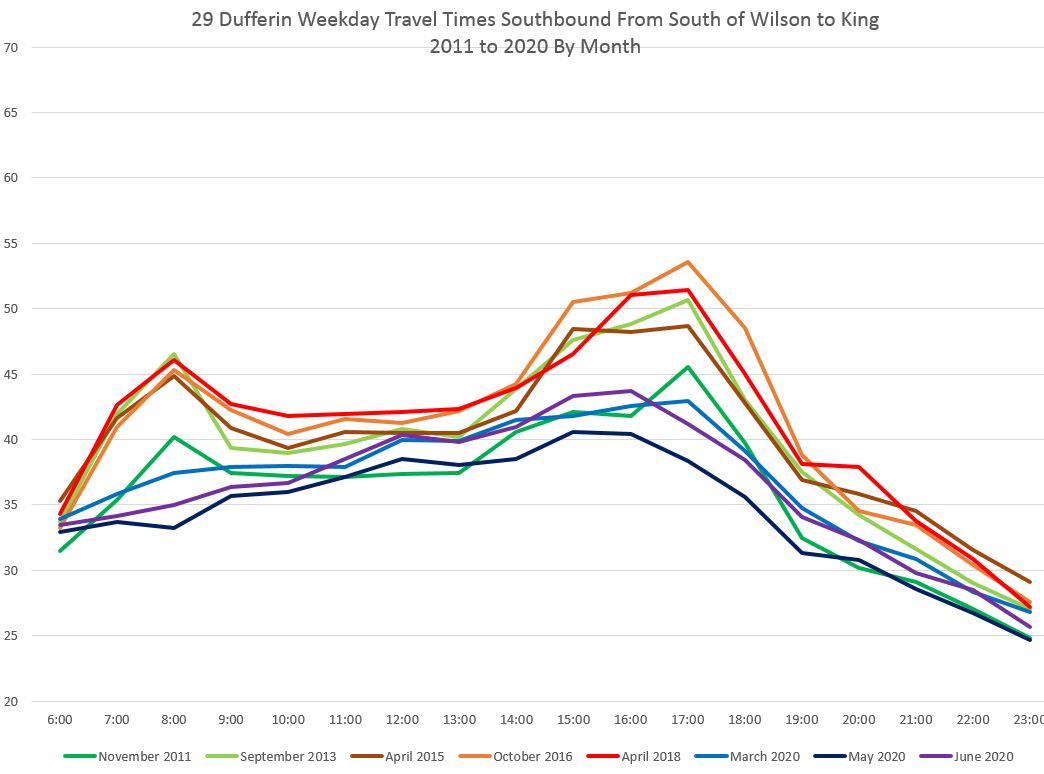
For the three months shown here in 2015-2018, the PM peak is quite visible. However, data for 2011 and 2013 are similar to values in recent months. May 2020 has the lowest travel times, but a rebound is visible in the June data and this will probably grow as the year goes on.
Note that in these charts, March 2020 (light blue) was a month with roughly two pre-covid and two post-covid weeks, and so the values here represent a blend of the two conditions.
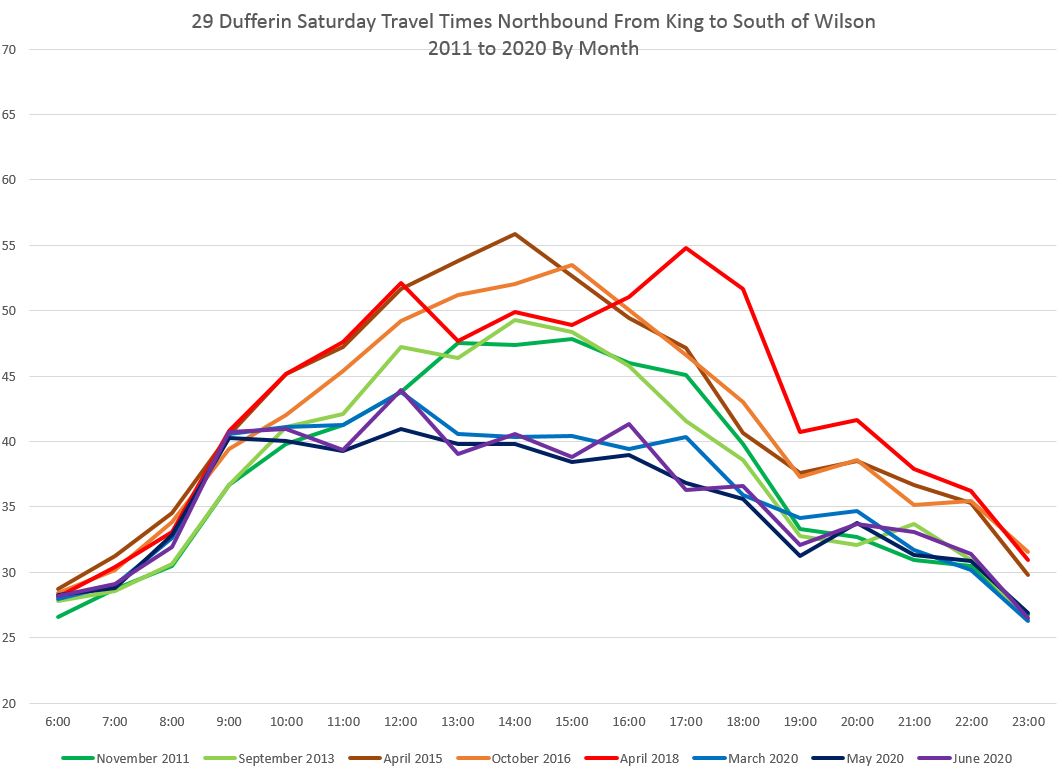
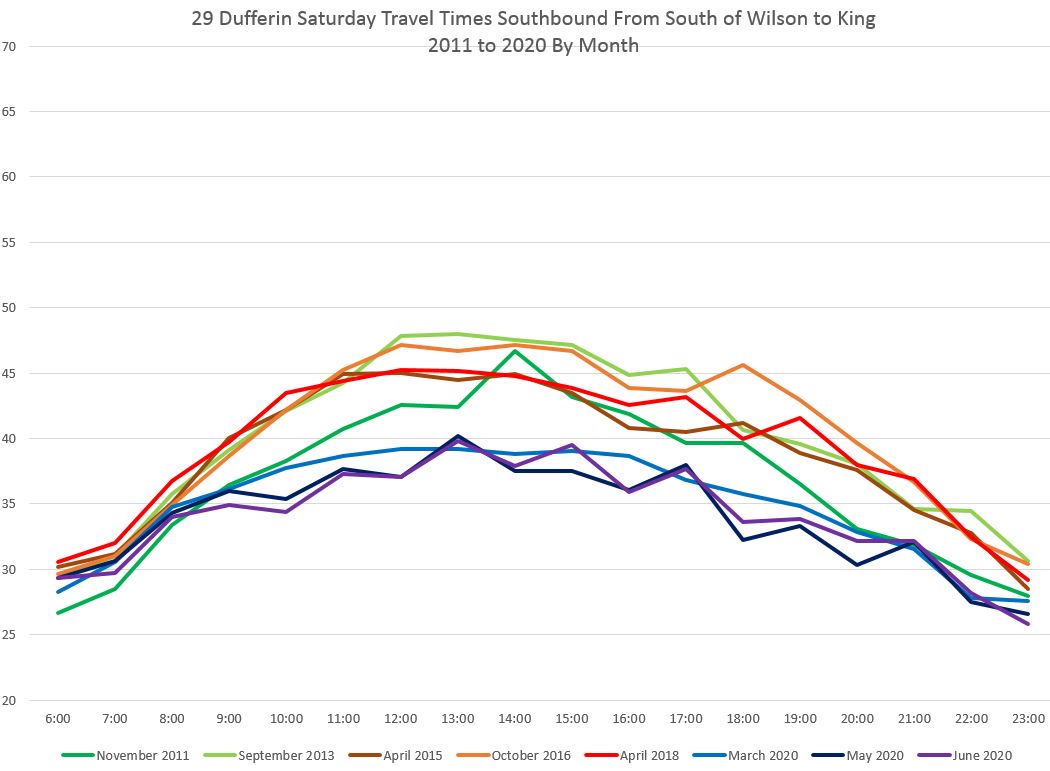
The problem of congestion on Dufferin is not confined to weekdays. Here is the profile for Saturdays. Extended travel times compared to the post-covid era have been common on Dufferin going back much of the decade, although the situation gradually worsens.
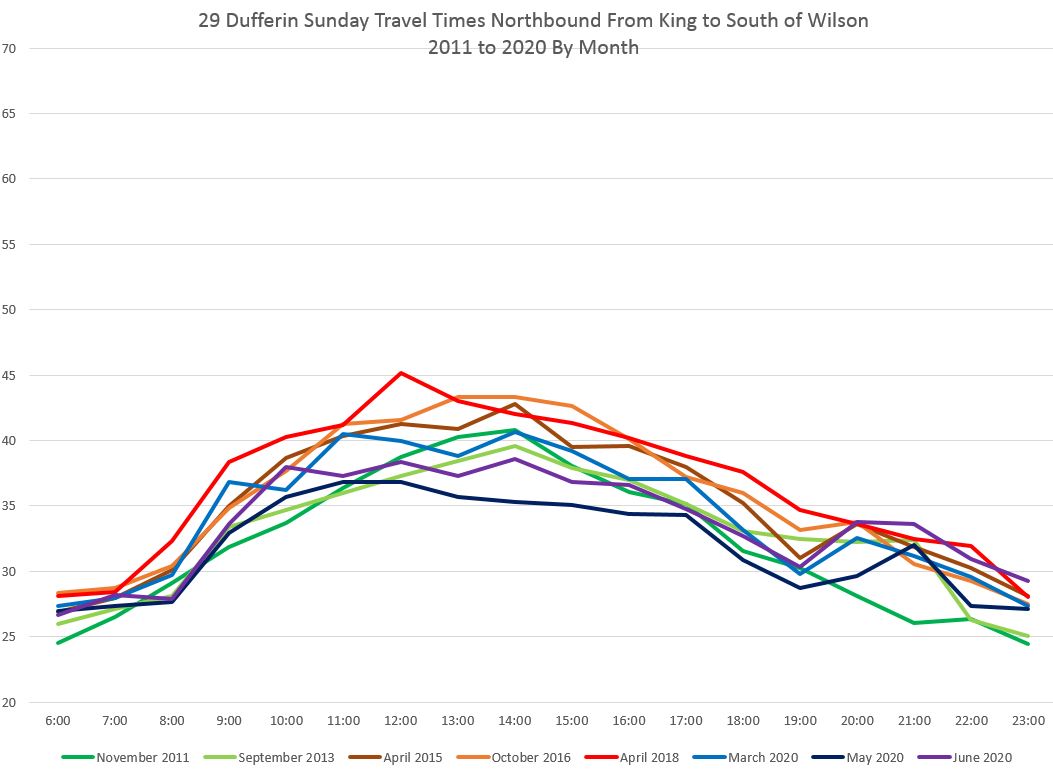
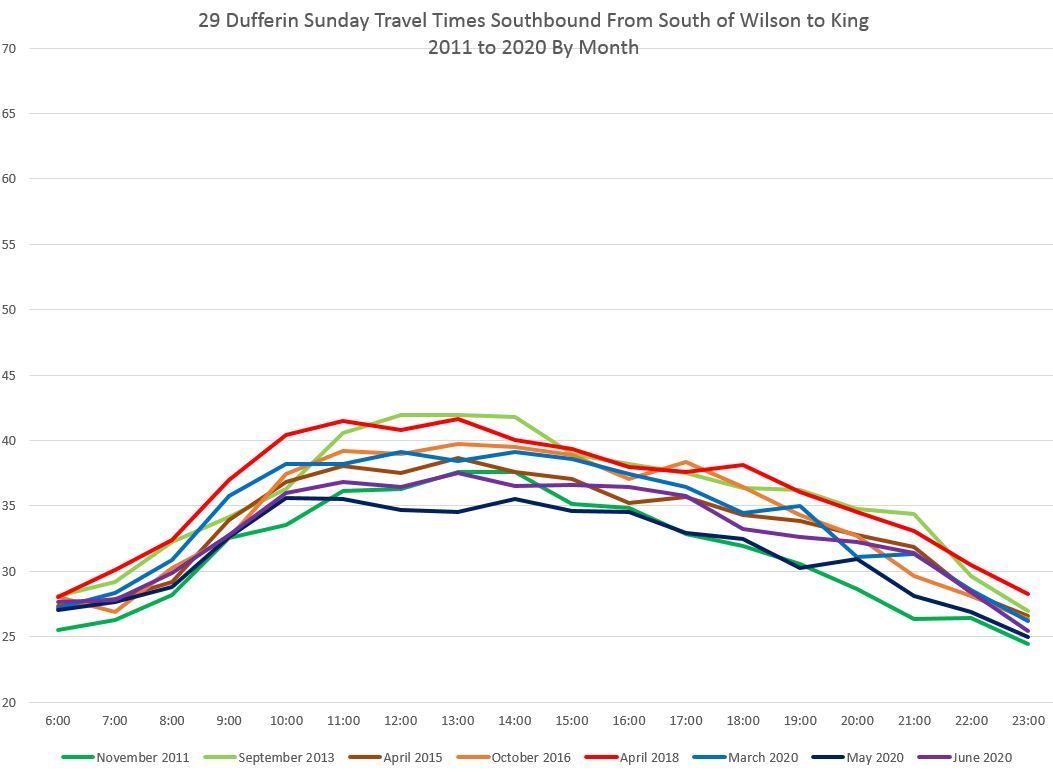
On Sundays, there has also been some post-covid decline in travel times, but values have not changed as much over the decade as on other days. Again, the values build gradually until a drop to the low in May 2020 followed by an increase in June 2020.
Probably the most atrocious congestion occurs near Yorkdale during the pre-Christmas period and on Boxing Day. Any scheme for reserved lanes will have to deal with that major centre and the traffic it generates.
Southbound
The change in travel times southbound was smaller than northbound because the peak values were not as large to begin with. Also of note here is the growth in September 2013 values to match more recent data, a jump that is not mirrored in the northbound values.
Saturdays show a similar all-day pattern with 2020 post-covid values being lower than historical travel times, but not by as much as for northbound service. This is mainly due to Yorkdale and the traffic trying to enter its parking lot being on the east (northbound) side of Dufferin.
On Sundays, the pattern is similar to the northbound data.

I think the meeting is on Wednesday jun 17, 2020, not the 16th.
Steve: Fixed. Thanks.
LikeLike
The 29 DUFFERIN sure changed from its former incarnation as the BRIAR HILL bus in 1949. (Not counting the older non-TTC buses.) It would become the DUFFERIN in 1954, extending between Eglinton and Wilson (getting its number 27 in 1956). There would be no buses south of Eglinton Avenue until 1961, and only between St. Clair and Queen. The two routes joining up in 1962.
From a rush-hour only suburban bus route to a 24-hour, with MAYBE express bus lanes, bus route, the Dufferin bus route continues to grow.
LikeLike