Bill Davis Had A Plan (Updated)

Updated June 3, 2020: A PDF version of the document has been added.

With all of Metrolinx’ recent hype about the Ontario Line and its design, I have been digging into my archives looking at the promises made back in 1972 when Premier Bill Davis announced “An Urban Transportation Policy for Ontario”. This was to be the transit answer to his cancellation of the Spadina Expressway, a new transit network that would bring rapid transit to outlying areas in Toronto, as well as to Hamilton and Ottawa.

There was to be a test track around the CNE grounds linking to Ontario Place. A new technology, trains that would fill the missing link between buses and subways that were far too expensive at the then astronomical cost of $25 to $30 million per mile.

This scheme was doomed from the outset by its dependence on an untried technology (although at the point of the announcement, the Krauss-Maffei magnetic levitation system had not been officially chosen). All that ever happened at the CNE was a small stand of trees near the Princes Gates were felled in anticipation of guideway construction, and a few column footings were built. So much for the brave new world of a transit network.

Oddly enough, buried in the announcement is the following acknowledgement that existing technology could be used, at least as a stopgap:

“As an interim measure it may be feasible to provide express routes through parts of these corridors using existing modes of transportation such as buses or streetcars. When operating in exclusive rights-of-way these facilities are capable of providing intermediate capacity transit facilities.” [p 15]

This was the only time the government acknowledged that a brand new technology was not a pre-requisite for building their network. Within a few years, Davis’ dreams would be dust. The government would resurrect the work on a new TTC streetcar design that was underway in the late 1960s, but was stopped when the focus shifted to Davis’ Intermediate Capacity Transit System (ICTS). Eventually, a less technically complex system that we now know as the SRT in Toronto and Skytrain in Vancouver came along, but the plans were never resurrected on quite so grand a scale.

The announcement itself makes interesting reading with many comments that will be familiar today especially as they relate to the limits of car-based travel and expressways.

Continue reading

HotDocs 2020

Several years have passed since I last published any reviews on this site from Toronto’s two main film festivals: TIFF and HotDocs.

This year, HotDocs (which would have already ended by now on its normal April-May schedule), is going completely online. Moreover, there is a more generous window, four weeks, to get through most of the films, and this leads to a less hectic schedule (not to mention the opportunity to see more films).

This article will grow as I add more reviews, and I will add them at the top of this article so that readers can check back and avoid scrolling through stuff they have already seen.

Having purchased an all-you-can-eat pass, and with more screening time, I will be streaming a lot. This is on top of the rich diet of opera, theatre, concerts and recitals that are also available online.

All that said, the online experience is not like actually “being there” in a theatre enjoying and reacting along with tends, or hundreds, or even thousands of people and watching the artists as they react to the audience. Those feelings will come back some day, and there will a big warm reunion over and over.

Meanwhile, one doc from the festival has already screened on the CBC, and I will include a review here.

My rating scale:

  • ***** Absolutely the best. Often awarded retroactively once I have seen enough films to get a sense of which one(s) actually deserve this.
  • **** Very good, definitely worth seeing.
  • *** Good but with some reservations.
  • ** Poor, possibly a film with the makings of something better that went astray.
  • * Don’t bother
  • Unrated: Bad enough that I gave up before the end, or should have.

Continue reading

TTC Ponders New Fare Options

At its recent meeting, the TTC Board approved a report launching reviews of fare policy and technology. These will run on an overlapped timetable beginning in fall 2020 with a goal of reporting to the Board in October 2021. The topics are linked in that policy choices can be held hostage by technology options. Nowhere is that clearer than in the TTC’s experience with Presto:

  • The range of options and capabilities specified by the TTC was constrained, in part, by the policy and financial framework in which Toronto operates, especially the avoidance of proposals that would increase costs.
  • The provider, Metrolinx and its partner Accenture, failed to deliver to the requirement knowing that the iron fist of Queen’s Park and threats to subsidy funding would overrule any complaints about functional problems. Metrolinx is on record now as refusing to meet all of the contracted requirements for the simple reason that they will not invest more development funding in a system that they hope to replace.
  • Any modifications to Presto functionality are treated as billable change orders, even if the TTC could argue that the “change” is a contracted feature. Metrolinx enforces its billings by withholding fare revenue from the TTC.

This poisonous relationship colours any discussion of the future of fare structures, levels, technology and subsidies not just in Toronto but across the GTHA.

A further problem, and this is common to studies of the future of TTC service design, is the pre-emption of options by the catch-all “we can’t afford it” line that pushes aside consideration of options that require more than small adjustments within existing funding.

Years ago, in the Miller-era Ridership Growth Strategy of 2003, the starting point was not “what can we afford”, but “what can we do, and how much would it cost”. This left the policy decisions where they belonged in the political realm where the TTC Board, Council and the public could balance investment in better transit with costs and expected benefits. Options were not swept off of the table by management second guessing the politicians, or, worse, protecting politicians from options they might not want to know about.

With fare policy, there is an added layer of the rivalry with Metrolinx and its role as a regional agency. If Metrolinx were actually doing its job, there would be little need for a TTC study because Metrolinx would look at fare and technology policy:

  • including the needs of local transit, not just commuter service, and how this will grow into a wider network;
  • without prejudice for the preservation of its existing technology investment in Presto nor its existing partnership with a service provider;
  • without attempting a zero-sum “solution” where no new money is committed, especially by Queen’s Park; and
  • without the doctrinaire belief that the private sector will magically pay for everything, and by implication that change can only happen with private funding.

We have been around this bush before with a previous TTC Fare Policy Study in 2015 that was itself hobbled by Presto limitations, the then co-existence of legacy fare media and policies, and utter paranoia about changing fare structures. Toronto could have had a two hour transfer years sooner but for political foot-dragging and the assumption that the revenue loss would severely damage the TTC (and by extension the City). Eventually the Mayor needed some good news beyond free rides for kiddies, and the two-hour transfer became a reality.

Continue reading

Metrolinx Spins Their Tale on the Ontario Line’s Alignment

In a recent article, I reacted to a Metrolinx blog post about the Ontario Line’s design with a series of questions hoping that as the project has now advanced to the Request for Information stage, there would be more details available. Metrolinx chose not to answer, an odd decision for a route about which they are so proud.

Another article has appeared extolling the Ontario Line’s virtues and its benefits for overall capacity on the rapid transit network (all this, of course, with pre-covid assumptions).

The claims in this article clearly were not conjured out of the air, but are based on detailed modelling of the future network. With Metrolinx’ non-response, I will not bother asking question of them, but will simply address their article head on.

Without question, the Ontario Line will provide rapid transit to areas that do not have it today, notably to the northeast in Thorncliffe and Flemingdon Parks and to the major redevelopment node at Don Mills and Eglinton. However, Metrolinx writes as if this was conceived as part of the Ontario Line when the Relief Line North project was already underway under their direction. That planning process was dragging along through an evaluation of alternative alignments most of which made no sense at all, and some of which did not hit these major nodes.

On an historical note, a proposed Queen/Don Mills subway from the 1960s would have gone through these areas. The idea is hardly new.

One might almost think that Metrolinx wanted this process to bumble along as a way to delay the project. Magically, by the time Premier Ford announced the Ontario Line, the always-obvious destination and route had been selected.

As for the west end of the line, yes, it will serve the south end of Liberty Village, but at a considerable walking distance from many buildings in a neighbourhood that has grown north to Queen Street. The problem with east-west service to this area is the capacity of streetcar service provided especially on Queen.

The Ontario Line will begin at the Ontario Science Centre where a new transit hub will connect it to the Crosstown LRT. With LRT trains and TTC buses delivering riders to this station, the Ontario Line will divert more people away from Line 1 than the earlier Relief Line South plan, which would have started near Danforth Avenue at Pape Station.

In fact, Metrolinx projects that the new plan will reduce crowding on Line 1 at Eglinton station by 15 per cent, compared to only 3 for Relief Line South.

In a strange editorial choice, the article illustrates “high-density neighbourhoods that need better transit” with a photo of a small residential street in Riverdale (the corner of Paisley Avenue and Booth Street, near Dundas and Logan) which is roughly midway between proposed stops at Queen and Gerrard Streets.

There is also a photo looking south from Queen Street East on McGee Street, a likely location for the Leslieville Station. Metrolinx does not mention the physical intrusion that expansion of the rail corridor and construction of a station here would produce, only that it makes a connection to the Queen streetcar. Directly behind the photographer is the Jimmie Simpson recreation centre and park which are both threatened by the line. These are conveniently ignored in the article.

Metrolinx is big on connections and travel time savings, but neglects that a rider who is already on the Queen or Kingston Road cars at this location can reach downtown directly simply by staying on board rather than transferring to the Ontario Line.

There is no question that the proposed Relief Line station on Eastern Avenue near Broadview would not make a convenient connection to the GO corridor being well north of the line and very deep so that the tunnel can go under the Don River. That said, this connection was never a principal function of the station, but rather it would serve the East Harbour development site immediately south of the station, and the proposed Broadview streetcar extension through the development would have linked to the Waterfront East streetcar line.

Metrolinx’ true aim both here and at Exhibition Station is quite clear: they need to offload demand from Union Station and hope to do so by diverting riders to the Ontario Line. To make this work, the link between the two routes needs to be as simple as possible, and Metrolinx often refers to the across-the-platform transfers between GO and the OL at East Harbour. That direct transfer is only possible with a surface, not an underground alignment.

However, this assumes a rider is actually destined for the north end of the core business area which, if anything, is moving south from King and across the rail corridor, not north to Queen. GO riders bound for the core area would be better off staying on GO trains, not transferring. There is real irony that Metrolinx trumpets a direct, transfer-free ride to downtown from Don Mills at the same time as they hope to shift GO riders away from Union Station with an extra transfer in their journeys.

This easy connection at East Harbour will give GO Train commuters an option to connect to the subway without going through Union Station – a big part of the reason why this plan will reduce crowding there by 13 per cent.

That’s 13 percent of all riders at Union Station including those arriving on other corridors – Barrie, Kitchener, Stouffville, Richmond Hill – and so this claim represents a very large shift of riders between GO trains and the Ontario Line. This is not credible, especially for outbound connections where the “easy transfer” includes waiting for a GO train running much less frequently than the Ontario Line. (There are also operational issues with the assignment of tracks to services in the shared Lake Shore East corridor, and I don’t think Metrolinx has thought this through.)

When Metrolinx cites the catchment area of stations, they use a distance of 500 metres (a circle one kilometre across). This might work well for a suburban GO station, but in an urban areas, the transit network is more finely grained and a rider could well have a surface route closer-by than a rapid transit station. Access and transfer times consume proportionately more of a trip than in-vehicle times.

The travel time saving brought by the Ontario Line is illustrated in this chart from the project’s website. This chart assumes that access time to an Ontario Line station is the same as the time needed to reach a bus stop, but this is true only for people living very close to the station. At the trip destination, the time from Queen (City Hall Station on the OL) to King & Bay shows the effect of a transfer between rapid transit lines. This almost certainly understates the time penalty. One might well argue that simply walking from the west end of City Hall Station south via Bay to King or via the PATH network (to which the station would connect) would be faster.

This is not to argue against the obvious time and convenience savings of a direct trip, but proportionately the access and transfer times will contribute more than this chart shows for riders who are further from stations at their origin or destination. Metrolinx presents a best case scenario here.

In another recent article, Metrolinx talks about public consultation and the feedback they received from open houses along the route. The overwhelming concern of participants was with the route’s alignment and community effects.

“The Metrolinx team tasked with undertaking the Ontario Line is attuned to the sensitivities of preparing to build in such a vibrant city,” said Franca Di Giovanni, Metrolinx director of community relations for Toronto region. “We take people’s comments very seriously, and making this report public is part of an open and ongoing dialogue around Ontario Line planning.”

However, it is quite clear that Metrolinx is wedded to their alignment and will only “consult” on comparatively minor issues such as station design. Their intransigence to discussions of alternatives is a long-standing problem undermining the credibility of their public participation process.

All of this is slightly surreal in an era when the future of office space and demand to the core is under question. Personally, I prefer optimism that we will get back to something like “normal” eventually, but this will not happen tomorrow. Meanwhile, there will be a huge problem with travel demand outside of the core and on the road network where transit has little hope of competing.

Metrolinx and Infrastructure Ontario have issued an RFI to gauge interest from potential bidders on the Ontario Line project. This process was already delayed due to pushback from industry on the degree of risk transfer the government wanted its “partners” to undertake, and the covid crisis has added to the delay. However, there is a big push to reach a contract signing before the 2022 election. Whether this is practical, and whether any meaningful consultation will actually take place, are open questions.

Metrolinx Mum on Ontario Line Details

A recent Metrolinx blog post extols the virtues of the Ontario Line and the advantages of staying out of underground alignments.

Well, I thought, maybe they are further along in the design and can actually answer some questions about details that have troubled me, among others, for months. I wrote them an email on May 14:

Greetings:

In your recent blog post “The upside of Ontario Line’s upside – How Metrolinx experts are looking to design a Toronto subway that isn’t just confined to dark tunnels” you talk about an elevated alignment on the northern portion of the line through Thorncliffe/Flemingdon, but you state:

“In Leslieville and the Don Lands, the line will run at-grade alongside the existing GO rail corridor, helping to reduce construction impacts.”

One of the issues about this portion of the line has been the question of whether the new trackage would run at the same level as the GO trains, or above them on an elevated structure. This is particularly tricky for the proposed station at Queen Street that requires not just room for the tracks but also for platforms and vertical access to the street below.

Assuming you are still planning to straddle the GO corridor with OL tracks for across-the-platform transfers at East Harbour, this means that there will have to be flyovers/unders where the lines diverge south of Gerrard Station and at the curve north at Corktown.

Here are my questions (some of this is a holdover from the consultation round back when we could still have hundreds of people in a room together):

1. Please confirm whether the OL trackage will be at the same elevation as the GO trackage in the segment between the Don River/East Harbour and the point where the lines diverge at Gerrard Station.

2. How do you plan to handle the need for the eastbound OL track to cross the GO tracks at Gerrard and at Corktown, assuming that you are still planning to have the OL straddle the GO right-of-way? Will the OL eastbound go over or under the GO trackage?

3. How will you handle the station at Queen Street where space is required for platforms and access structures, not just the new OL rails, plus (possibly) one more mainline rail track?

4. Has the requirement for trackage for a possible high speed VIA service leaving Union via Lake Shore East and then the Stouffville corridor been factored into the track requirements yet, and if so, what is the effect?

5. Are there conflicts between a possible GO/Smart Track station at Gerrard and the planned OL structures/station?

6. Has the issue of lateral separation between mainline rail operations and the “lighter” OL vehicles been sorted out? What is the minimum spacing allowed between the two types of service?

Today, May 19, I received the following reply from Nitish Bissonauth, a Media Relations & Issues Specialist at Metrolinx:

Hi Steve,

We have nothing else to provide at this point in time as the project details are still being finalized and the preliminary design business case has yet to be released.

Remember, this is the same Metrolinx that originally expected to have a request for expressions of interest on the street already and a request for proposals in the fall. But they cannot, or rather refuse to answer basic questions that should have been settled long ago. This process has been delayed both by covid-19 and by the reticence of the construction industry to take on the level of risk Metrolinx so fervently wishes to push off of its books.

How people are supposed to intelligently comment with any hope of actual “participation” in the design process is beyond me. This is an organization devoid of any sense of public responsibility answering only to their bosses at Queen’s Park. Fearless Leader doesn’t want surface transit in his Etobicoke bailiwick, but it’s just fine for the folks elsewhere.

It will be amusing to see the pretzel-shaped logic that will appear in the “preliminary design business case” and whether, indeed, it bothers to address the technical challenges of the proposed route. Or will we simply get a line drawn on a map without regard to the local terrain and geography, much like a consultant now working for Metrolinx once did for SmartTrack?

Toronto Takes A Financial Hit From Lost Transit Riding (Part II)

This article continues from Part I with additional information presented at the TTC Board meeting of March 13.

A widely reported number is the half-billion dollar shortfall in TTC revenues in the period up to Labour Day. Even with an offset of about $200 million in savings for a net deficit of $300 million, this is still not small change.

The TTC faces several challenges for service in the immediate future and then through any “recovery” period as restrictions are lifted on various types of activity and the need for travel grows.

The first problem is shown dramatically by this chart:

The TTC’s current service level accommodates the 20 per cent of normal demand they now have (although there exceptions, about which more below), but as long as riders must keep two metres apart, the system at full service could only handle about 30 percent of normal. That’s an average, and the situation varies by route and time-of-day.

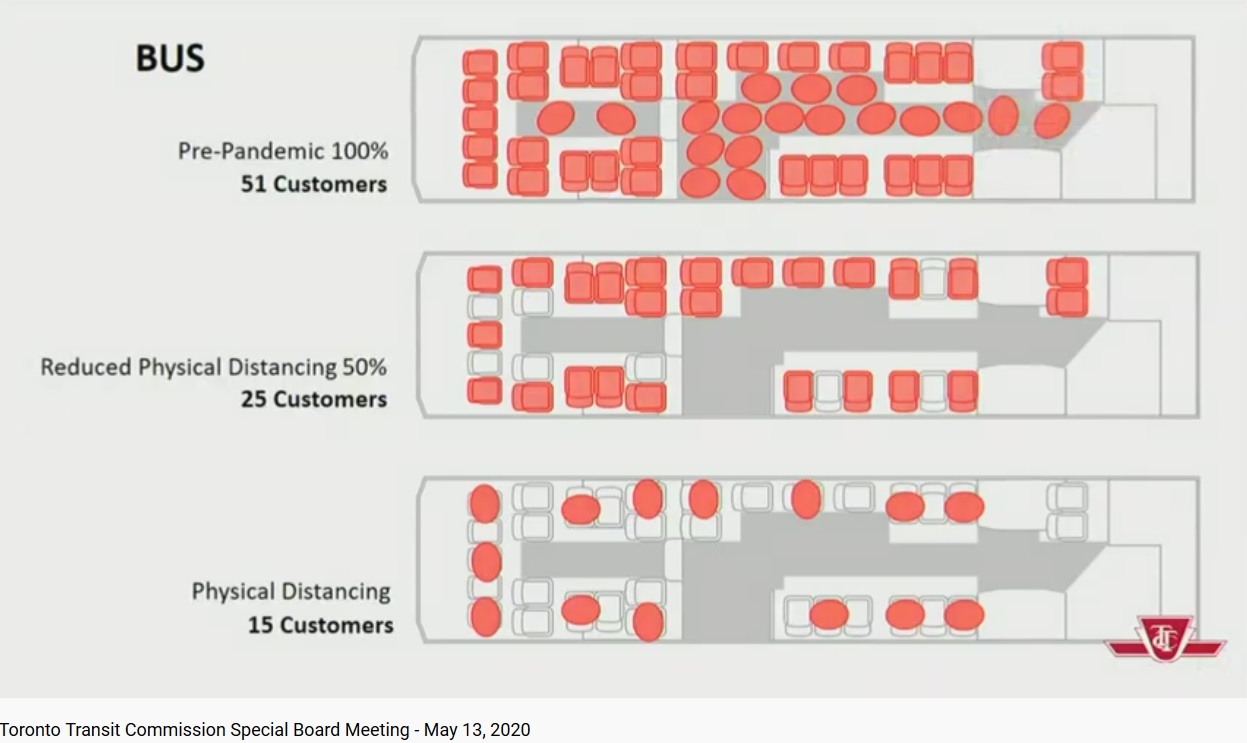
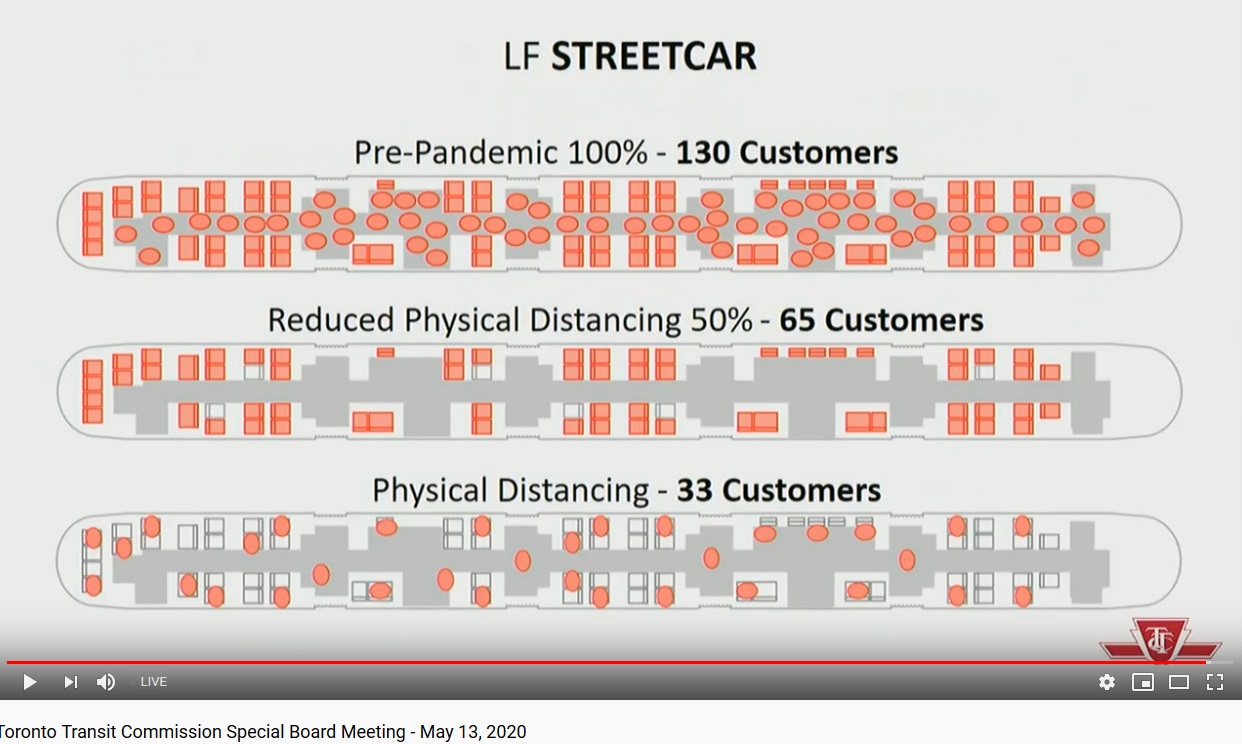
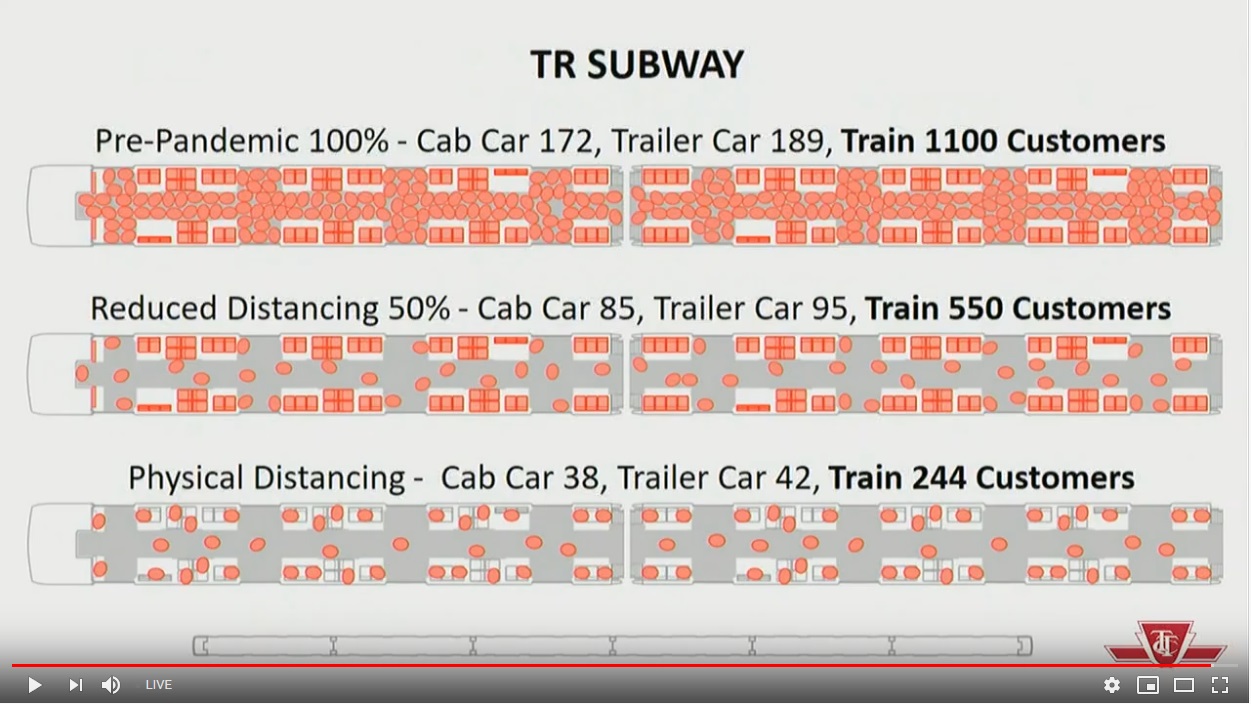
With distancing in effect, the practical capacity of vehicles is much lower than the usual level. In the charts below, three capacity levels are shown: normal service standards, 50 per cent load, and the load with a two metre rule in place.

The ratio of normal to current (two metre) capacities shown are 3.4 for buses, 3.9 for streetcars and 4.5 for subways. One might reasonably quibble that the spacing shown for some cases, notably at the rear of buses, does not meet the rule, but in any event, this shows the extent of lost capacity. The replacement factor for all modes lies somewhere between three and four vehicles in the fully distanced, two metre environment.

The 50 per cent example was included in the presentation as an indication of what the situation would be with relaxes rules, but this version has riders sitting in closer quarters than anyone other than close friends and family would reasonably accept today. Even at this level, twice as much service is needed to handle whatever demand shows up.

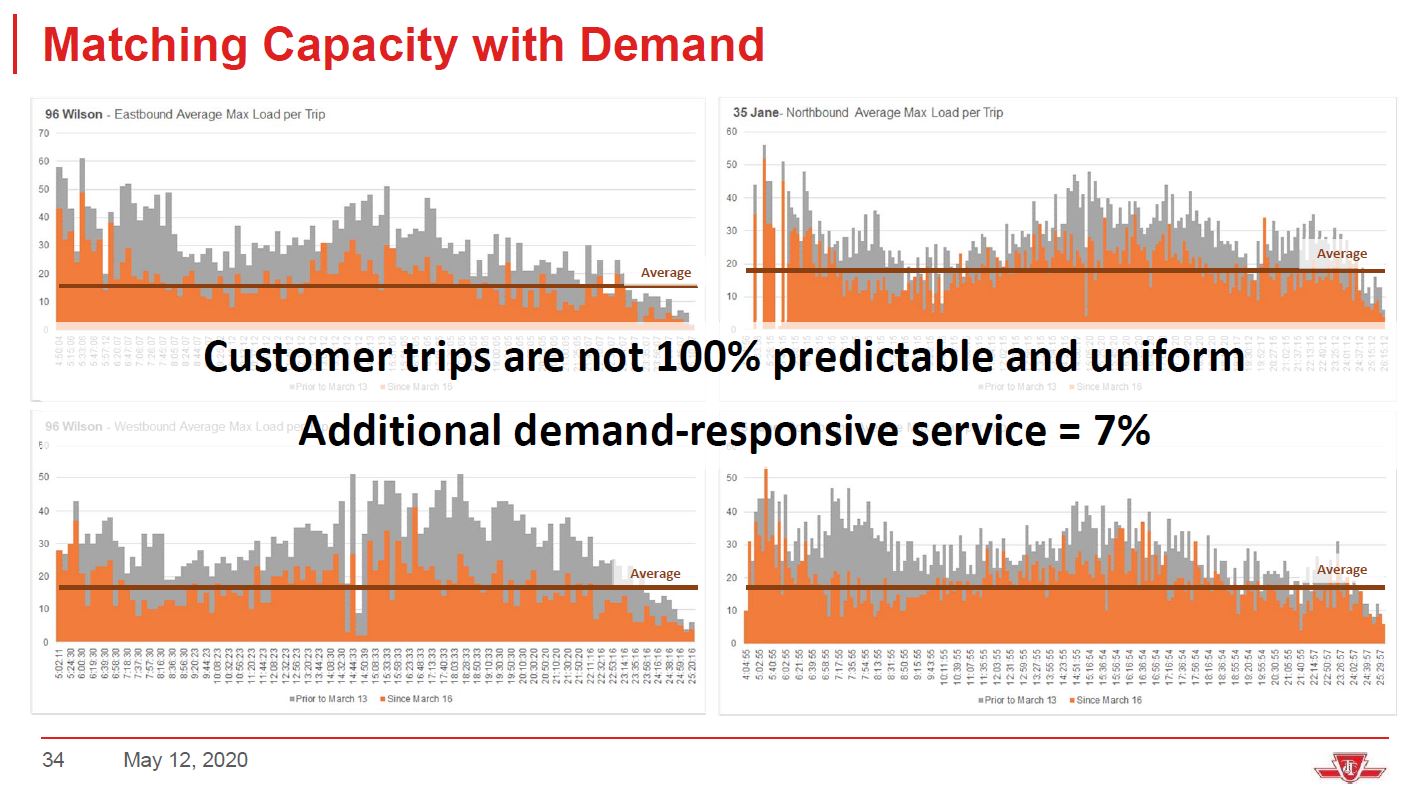
The problem is further complicated by the unevenness of demand (leaving aside irregularity in service actually provided). The charts below show the 96 Wilson and 35 Jane bus route maximum loads pre-and post covid. Note that the vertical scales are not all the same making visual comparisons between the charts difficult.

Although demand is down from pre-covid levels, it still regularly crests the target of 15 passengers per bus with the “average” line sitting above that level in all cases. Although the TTC talks of additional “demand-responsive” service at 7 percent, this would not pull the averages down to 15. At least the TTC is monitoring loading at a detailed level, but they need to demonstrate that the service they actually operate achieves the target level. Leaving riders at a stop because a bus is “full” has more serious consequences now than the usual griping about overloaded buses in pre-covid days.

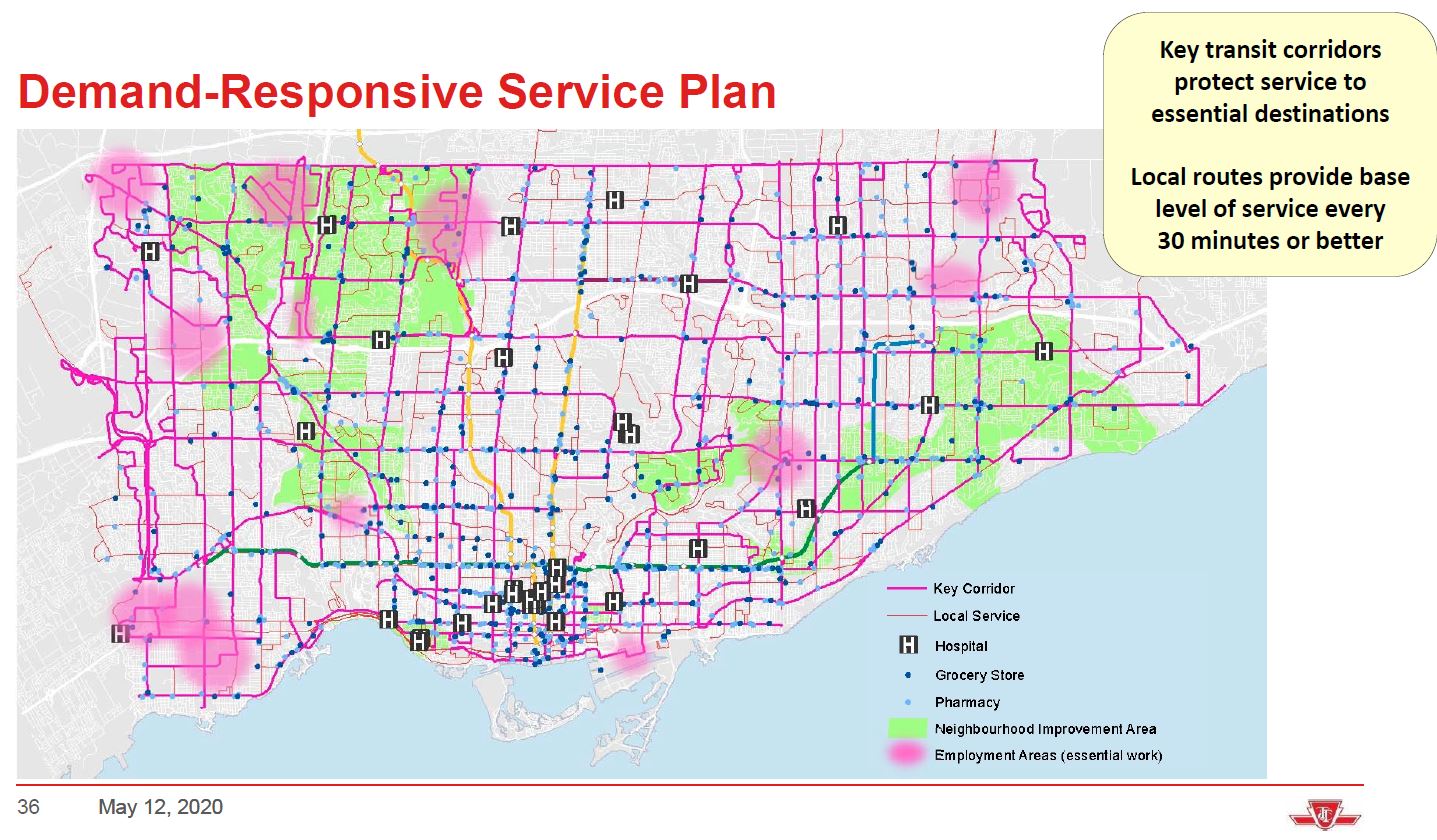
Demand is not uniformly distributed across the network. Although there is a cluster of hospitals downtown that is well-served by the subway, many health care and employment areas are scattered around the suburbs where bus service is essential for access. TTC reports that the bus network is the least affected by riding loss even though 4 in 5 bus riders have vanished.

Busy stops on the network are concentrated along the bus corridors. This shows two important factors in considering service levels:

  • Heavy demand is not concentrated downtown but is spread throughout the city.
  • Busy stops are not located just where there are health care or work locations, but along routes where riders travelling to those locations live. This is a variation of the “last mile problem” where so much planning and hand-wringing looks at station locations, but not at how riders get to and from transit.

These factors make any move to further trim transit service to fit available budgets extremely dangerous over the entire city.

(Note that the map below shows only bus routes and so demand on the streetcar routes is not charted below. The reason for this is that the streetcar fleet does not yet have the same technology that is installed on bus routes to track demand and crowding.)

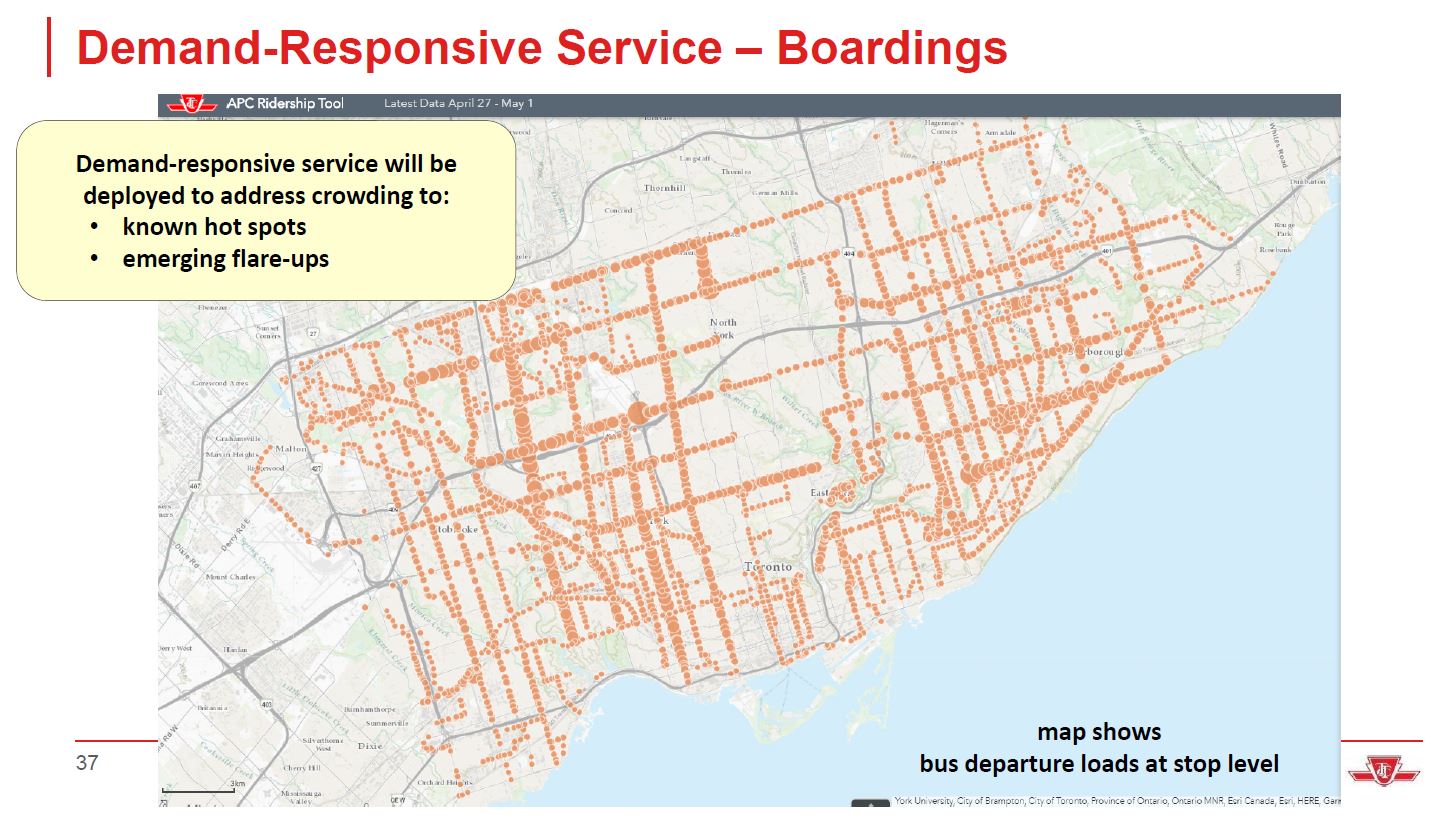
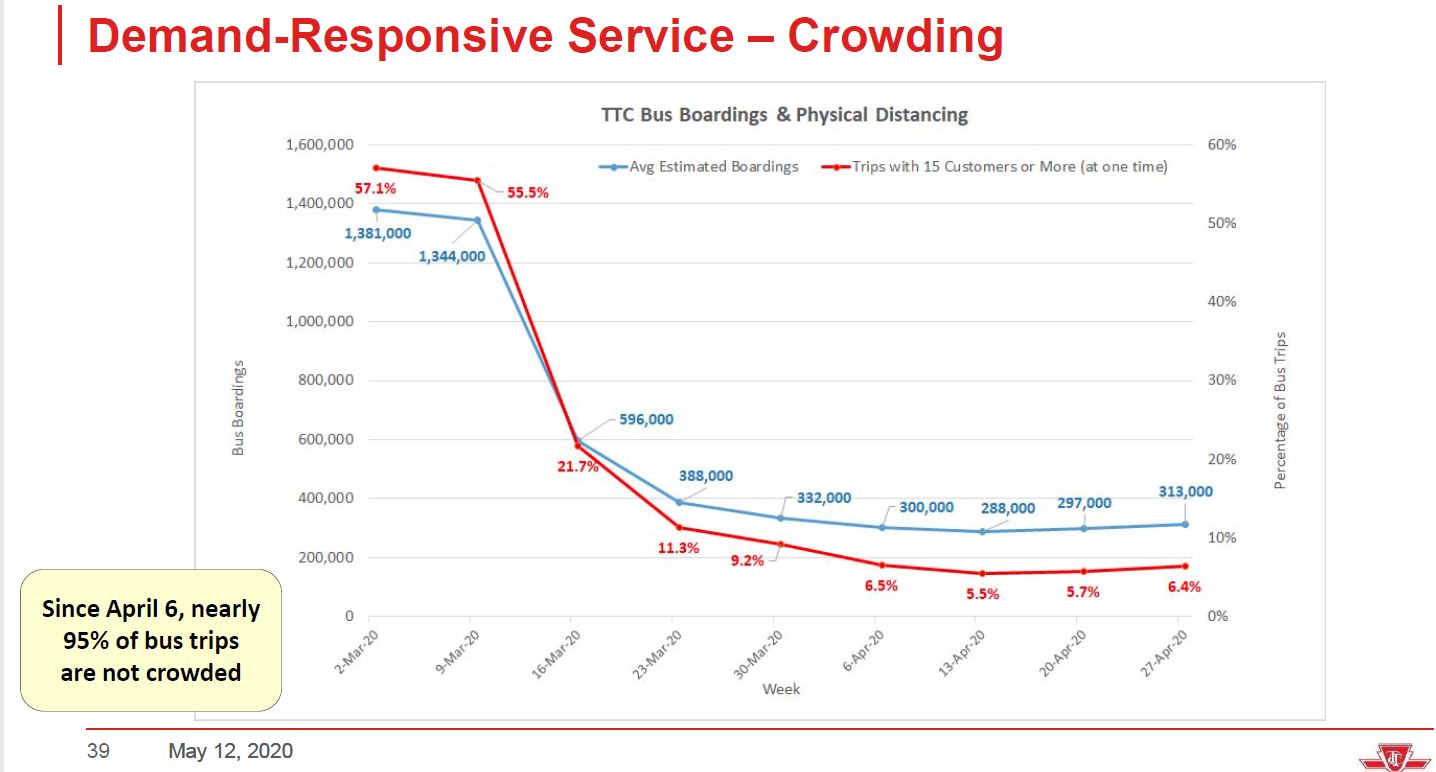
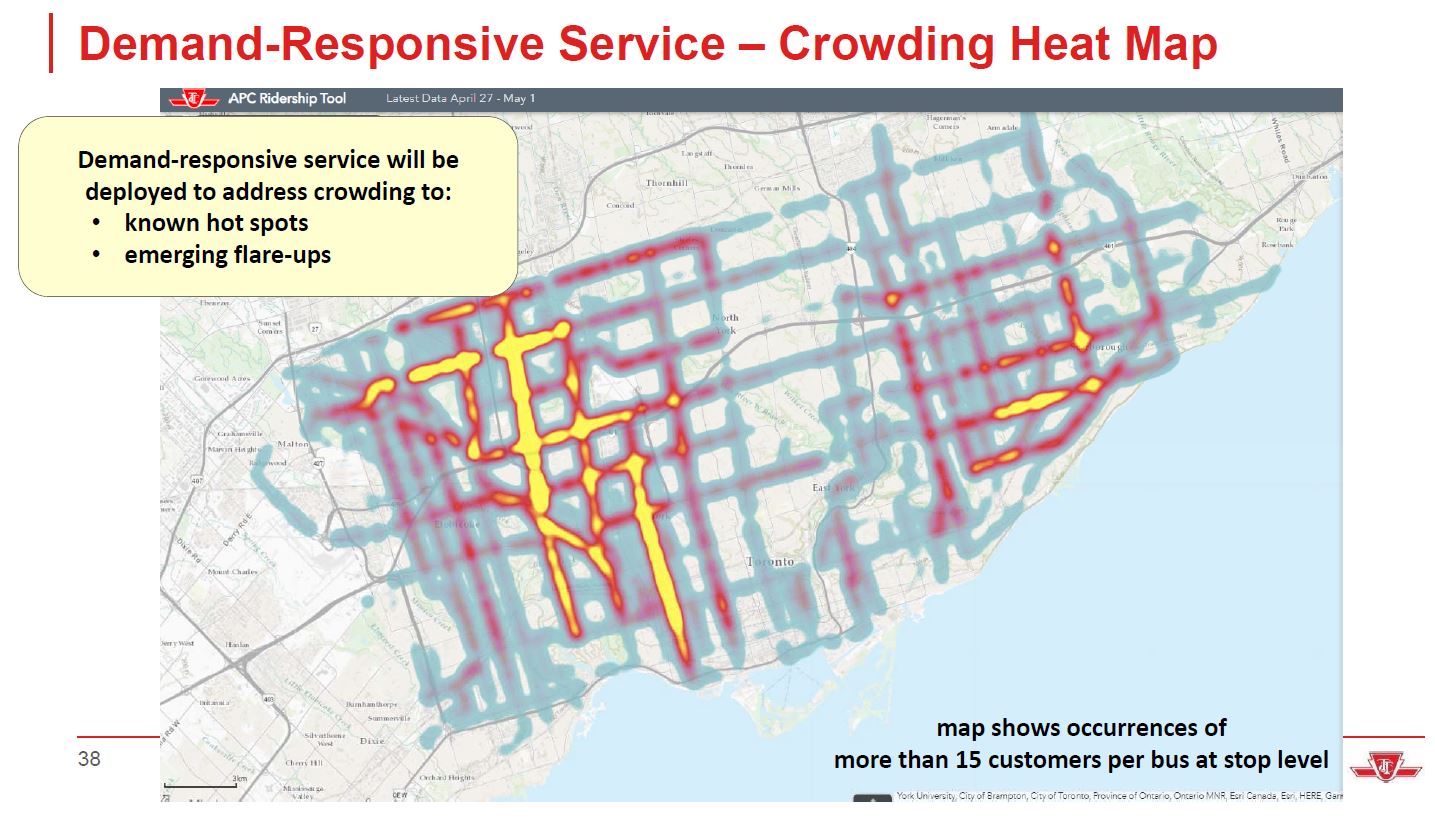
The TTC claims that overcrowded trips have been reduced to about six per cent by focusing service where it is needed. That is laudable, but the statistic shares with so many others published by the TTC that it is a system-wide, all-day average. A rider on a packed Dufferin bus takes little comfort from having their conditions averaged with lightly loaded times of day and routes elsewhere.

Crowding levels, plotted as a heat map, show where the problems are concentrated.

At this point I cannot help making an observation about how the TTC reports on its service quality. Clearly, they have the ability to review demand/capacity levels at a fine grained basis, but getting real data out of the TTC is almost impossible. And yet here it is. This sort of chart should not vanish after the emergency, but should be a fundamental and regular report on service quality. There is no longer an excuse that “we don’t have the data”, or “it’s coming soon”.

An obvious question about crowding levels is the metric used to count riders. The TTC has been using two of them, at least on buses;

  • Presto taps. This measures the number of people who “tap on” when they board and hence reflects “boarding” or “unlinked trips” (where each transfer counts as a new trip). This does not measure:
    • Boardings at paid areas in subway stations.
    • Trips where a rider does not pay.
    • Passengers leaving vehicles.
  • Automatic passenger counters. This technology counts people getting on and off of buses and is independent of fare collection.

The Presto data are useful for comparison with historical data, but it is the passenger counters that tell the full story. They have not yet been installed on the streetcar fleet. The subway network has no mechanism for counting all passengers and this depends on visual counts by TTC staff that are conducted periodically at various locations.

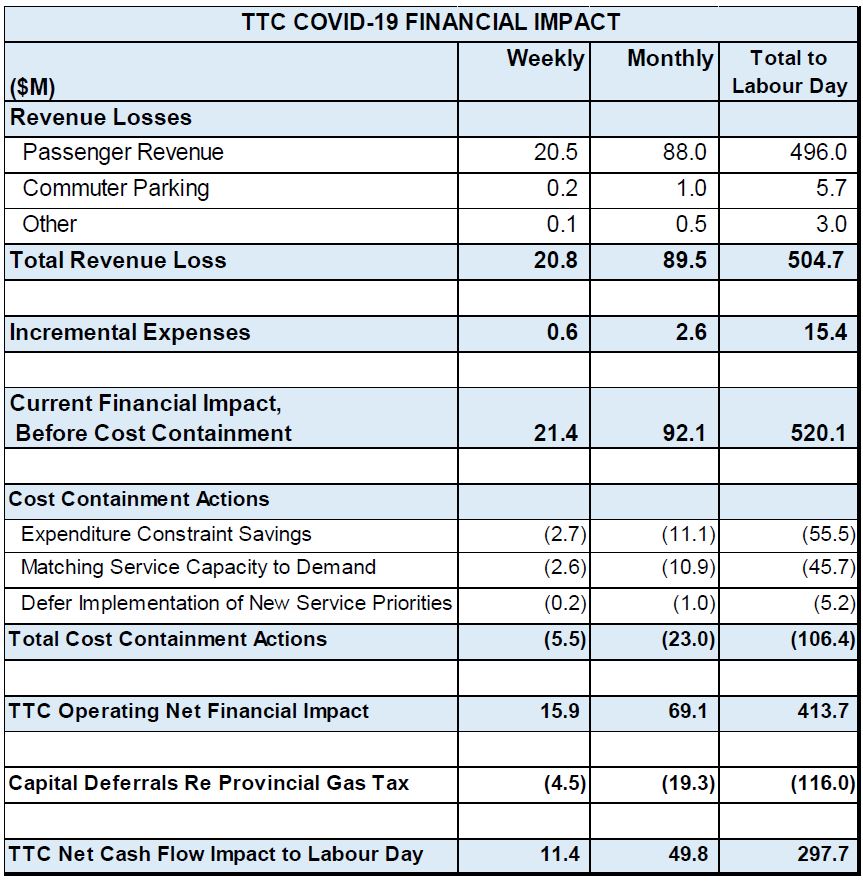
The financial implications for the TTC and the City of Toronto in coming months are considerable. In Part I, I included a table showing the financial effects and savings for the TTC up to Labour Day. Here it is again.

The table does not tell the full story because it does not show the gross operating costs. For 2020, the total budget (including Wheel-Trans) is about $2 billion, or about $160 million per month. The TTC shows savings of $10.9 million/month from the reduced level of service. Note that this is not proportional to a 15 per cent cut in service because some costs do not vary with the amount of service. This is not just administrative overhead, but much ongoing infrastructure and fleet maintenance is required even if less service operates.

If the TTC returns to full service, that saving will disappear.

Moreover, the capital deferrals are booked here as $19.3 million/month. However, the $116 million over five months will not exist from September onward because it is a fixed amount, the capital portion of the provincial gas tax allocation to Toronto.

Between the two factors, the monthly deficit will go up by $30 million in September if the TTC resumes full service offset only to the degree that fare revenue returns.

The big challenge comes in that mid-range where ridership is building, but service has to run flat out to provide enough space even with only half of the demand. Whether the system can handle this will depend greatly on how concentrated this demand is by location and time of day.

The map of current hot spots shows how important the suburban bus routes are. We may have lots of room on the subway, but that won’t get people to work on the bus lines. If a return to 50 per cent demand is unevenly distributed, the pressure for even more service in parts of the network will be severe, and it is not clear how much extra service the TTC can field due to both fleet and staff constraints.

Looking down the road, the TTC is planning for three separate time periods:

  • The remainder of 2020
  • January to September 2021
  • September 2021 and beyond

Different options will be needed depending on the expected demand patterns and financial support available. Without a return to near-normal demand and crowding, the fare revenue that represents and the better fleet utilization, transit cannot return to its former role.

Better transit funding cannot be a quick, one time payment to tide over for the short term. If the tooth fairy comes up with $300 million today, that only gets the system and the city to labour day this year, but the problem will persist and grow well into 2021. That year’s budget cycle will be brutal at every level as the need to actually pay the bills rather than shipping money out the door will hang over every government.

Toronto Takes a Financial Hit From Lost Transit Riding

At its virtual meeting on May 13, the TTC Board will consider a report on the effects of the COVID-19 pandemic on TTC ridership and finances.

As an agency whose revenue depends heavily on fares paid by riders, any downturn in transit demand has a critical effect on TTC finances. This is compounded by the system’s reduced capacity to provide adequate distancing between riders, and so the amount of service required remains high even though there are far fewer riders. The report provides the simple explanation of the math:

  • Ridership has stabilized at about 20 per cent of normal demand.
  • Vehicle capacity is only 30 percent of normal conditions.
  • Operating 80 percent of normal service produces 24 percent of normal capacity.

The situation varies across the system with the subway and streetcar networks hardest hit because they serve the financial district downtown. Proportionately more people who would normally travel to this area are staying home or using other modes (walking, cycling, autos) to make their trips. The numbers below are based on Presto taps as a surrogate for demand. This is not the same as “ridership” because some trips do not involve a tap to enter a vehicle or station (pre-paid areas), and some taps represent transfers, not new trips. The proportional changes tell the story.

Continue reading

TTC Service Changes Effective Sunday, May 10, 2020 (Updated)

This article continues the presentation of service changes effective May 10, 2020 with further details of the published levels of service on various routes. It should be read in conjunction with the original article which contains the originally announced changes.

Information here applies only to:

  • Weekday service
  • Routes where the service level was not specified in the original announcement, or where the published timetable varies from what was in the announcement.

There is a very important caveat about the level of service shown in the TTC’s timetables. Because of the volume of work to reschedule the system, several routes will actually operate on wider headways (the time between vehicles) than the timetables show. The reason for this is that although there may be new schedules in many cases, the TTC also pared down service by selective cancellation of some trips and crews so that fewer vehicles are needed than originally planned.

This shows up in the online timetable as gaps in what would otherwise be a regular headway. As an example, a route might be planned for a 6 minute headway with vehicles at:

9:00 9:06 9:12 9:18 9:24 9:30 9:36 9:42 9:48

However, careful examination of the timetables shows that some trips are missing and the timetable might actually read:

9:00 9:06 9:18 9:30 9:36 9:40 9:48

The plan is for Transit Control to manage service by running these lines on headways appropriate to the number of vehicles available.

Some routes may change from their scheduled service level as experience is gained with crowding levels, and the schedule change in late June will include adjustments for this.

Finally, some routes will have extra service allocated from a pool of spare buses and streetcars as needed. However, these vehicles will not appear on apps or TTC displays of predicted service because NextBus (the data source for all of the apps) does not track vehicles that are not in the schedule.

Updated May 11, 2020 at 11:00 pm:

Known problems with the May schedules:

  • The running time allocated for 501 Queen cars west of Humber Loop is too short to be operated until mid-evening. During the affected periods, there will be a bus shuttle on Lake Shore. The weekday and weekend services are affected, but not the Holiday schedule on Victoria day when separate streetcar services will operate on the Queen and Long Branch sections of the route.
  • With the removal of the 953 Steeles East Express, there is no scheduled peak period service to Staines Road because this was formerly provided by the 953. Unscheduled run-as-directed (RAD) buses are being operated to fill in.
  • With the removal of the 945 Kipling Express, the remaining scheduled 45A local service to Steeles during the peak period is very infrequent.

Updated May 13, 2020 at 6:15 am:

  • A reader reports that the TTC is supplementing the Kipling service to Steeles with extra buses running as 45A. They do not appear in NextBus predictions.

Route Level Details

Here is a route-by-route rundown of updated information about service frequencies. Note that this information may not correspond to service actually operated. If a route is not listed here, then the changes described in the original article still apply.

An updated version of the full chart of changes is here:

In this chart, the areas colour coded as “GTFS” (mauve) contain information taken from the electronic version of schedules initially as published by the TTC through the Toronto Open Data Portal, and later verified against timetables on the TTC’s site when they went “live” on May 10.

Continue reading

TTC Service Changes Effective Sunday, May 10, 2020

This article is the longer, detailed version of my piece on NOW Toronto’s site looking at pending service cuts on the TTC. Note that some details on the changes has not yet been published by the TTC. I will update this article as more information becomes available.

With the steep decline in riding on the TTC’s system, service cuts are coming to many routes. The cuts are an attempt to preserve capacity for riders to travel safely with far fewer passengers per vehicle than in pre-covid service designs, while trimming TTC operating costs.

The predominant effect across the network is that peak periods are not as “peak” as they used to be, and off-peak periods see service reductions on many routes. The overall scale of the change is evident from the comparison of budgeted and scheduled vehicle hours per week.

The planned amount of service per week, measured in vehicle hours, will be reduced by 15.6% relative to the original service budget. Regular service hours go down 11.8% and the provision for construction goes down much more, 77.3%, reflecting the uncongested roads over which vehicles will travel.

By contrast, the normal summer service cuts amount to about two per cent of regular service, and this would be offset by a rise in construction-based hours (diversions, bus replacements, extra service for congestion). This is a much deeper cut than Toronto riders are used to.

Broken down by mode, the change in hours is greatest on the streetcar system at 20.7%, then the subway at 15.7%, then buses at 10.2%. There is no change in SRT service.

Another way to look at this, at least for peak periods, is the number of vehicles scheduled during the two peaks. Both the bus and streetcar fleets fielded for service will decline by about 20%.

Continue reading