
This is the second part of the November 2018 update of data from the King Street Pilot. Part I dealt with travel times and line capacity. For a detailed review of headway changes on 504 King and 514 Cherry, please refer to Part II of the October update.
With the consolidation of the King and Cherry routes, the scheduled service on each of two branches is roughly the same. When these were separate, service on the Dufferin and Cherry spurs was worse than on the main King route, and service to the outer ends of the 504 at Dundas West and Broadview Stations was better.
The revision has widened headways on the outer part of the route, but in a more troubling change, it has also widened the range of headways indicating that gapping and bunching now affect these areas to a greater degree. This is a fairly common effect on TTC routes when headways are widened. When headways are short, the gap between two cars running as a pair, or caused by a short turn, is not as noticeable to riders as the gap on a wider scheduled headway. Line management tactics, including a laissez-faire approach, that might work on short headways compound the effect of wider headways. Although one might expect some unevenness in service heading outbound to terminals after crossing the city, there are also problems with reliability inbound indicating that service is not well regulated at terminals.
As I have written many times, the TTC Service Standards allow a generous variation in “on time” performance at terminals which allows pairs of streetcars to be considered within the target. This allows management stats to look good while service to riders suffers.
(As a simple example, consider an eight minute headway where cars are to leave at 10:00 and 10:08. Within the standards, the first car can be up to five minutes late at 10:05 and the second one minute early at 10:07. This small gap would quickly collapse into a pair of cars travelling together. If the pattern repeats, the next pair of cars could be 16 minutes later, a much worse service than is scheduled or advertised, especially on the “ten minute network”.)
In the central part of the route, headways are short because two services overlap, and the spacing of streetcars is, to some degree, regulated by the combination of long cars, traffic signals and farside stop lengths. Only one car can serve a stop at a time leaving its follower on the nearside and likely held by the traffic signal. With shorter cars and nearside stops, it was common for pairs of cars to serve a stop at the same time and depart on the same signal cycle.
This is the last detailed review I will publish of the King Street pilot until March 2019 when the effects of route changes to take effect in mid-February will be visible. (All streetcar service will turn back at Dufferin for overhead and track reconstruction at Queen & Roncesvalles.) That update will include all data for December 2018 through February 2019 covering much of the winter period.
Eastbound
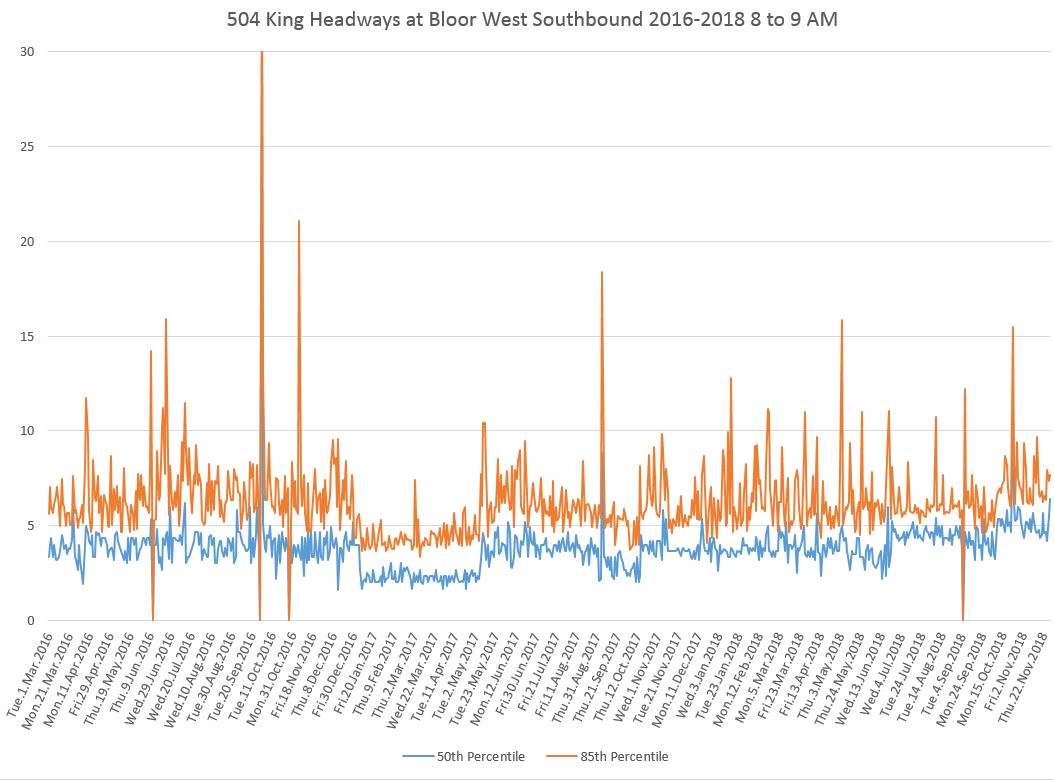
From Dundas West Station southbound at Bloor Street
The mean (50th percentile) value at Dundas West rose in October 2018 in line with the wider scheduled peak headway, but the 85th percentile also rose showing that gaps are wider as discussed above. This pattern continues into November.
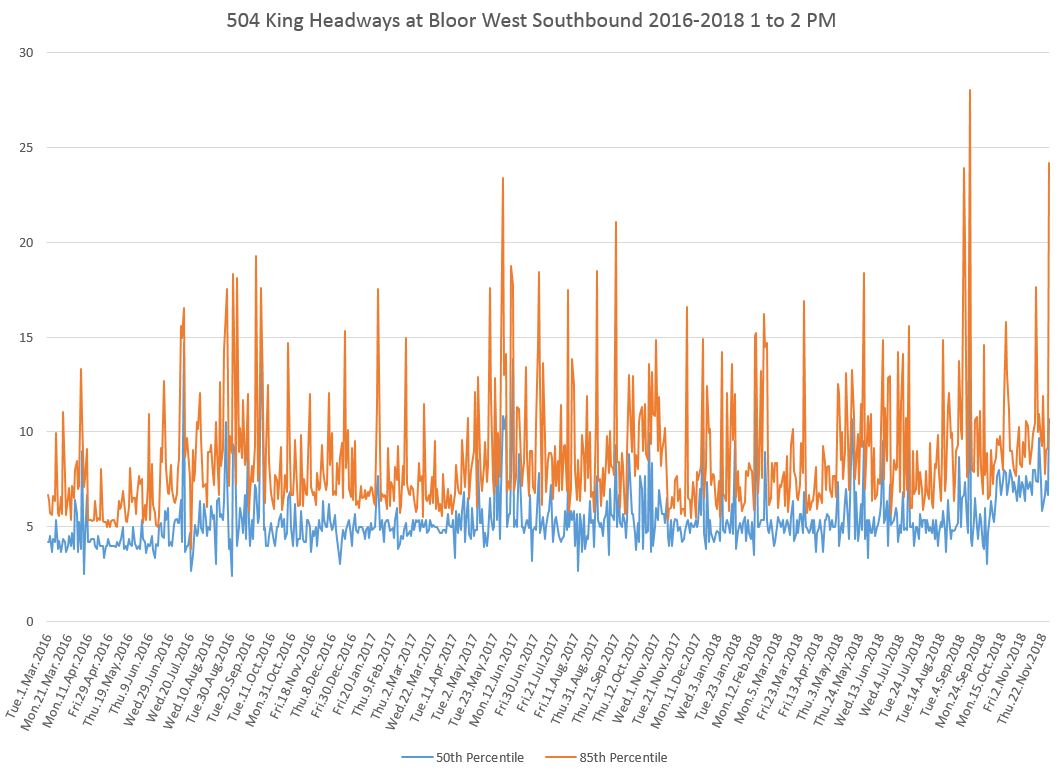
Midday service has a noticeably wider scheduled headway, but the 85th percentile stays fairly close to the median albeit with a few exceptions.
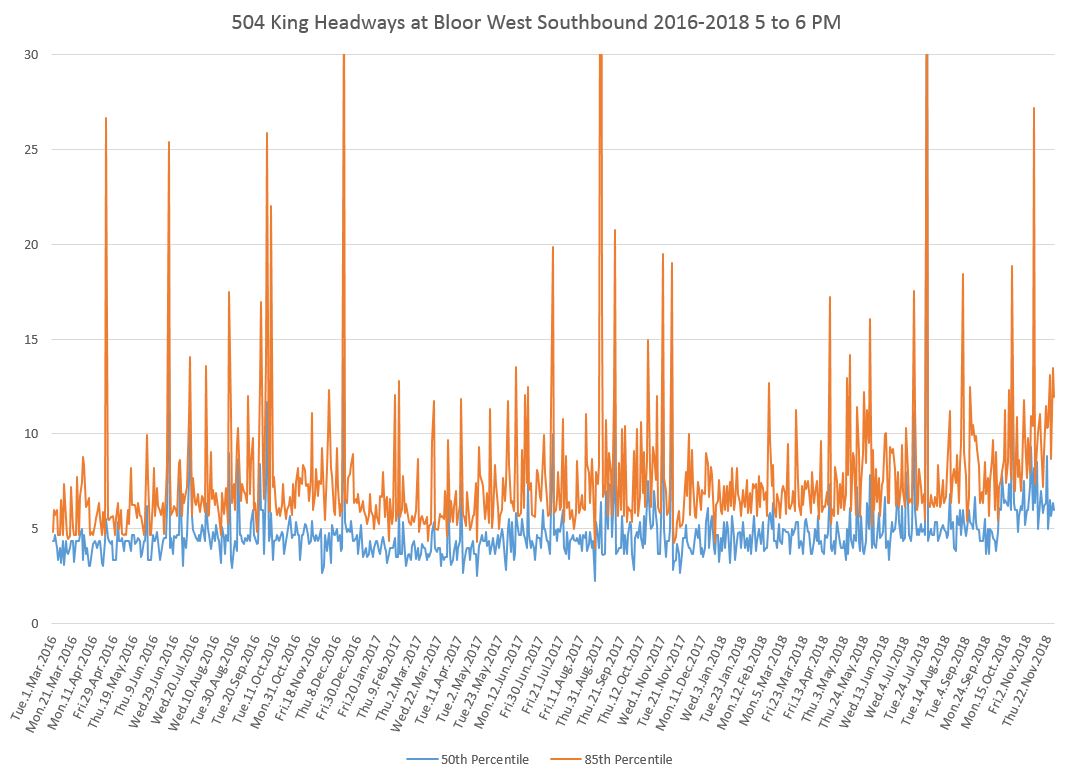
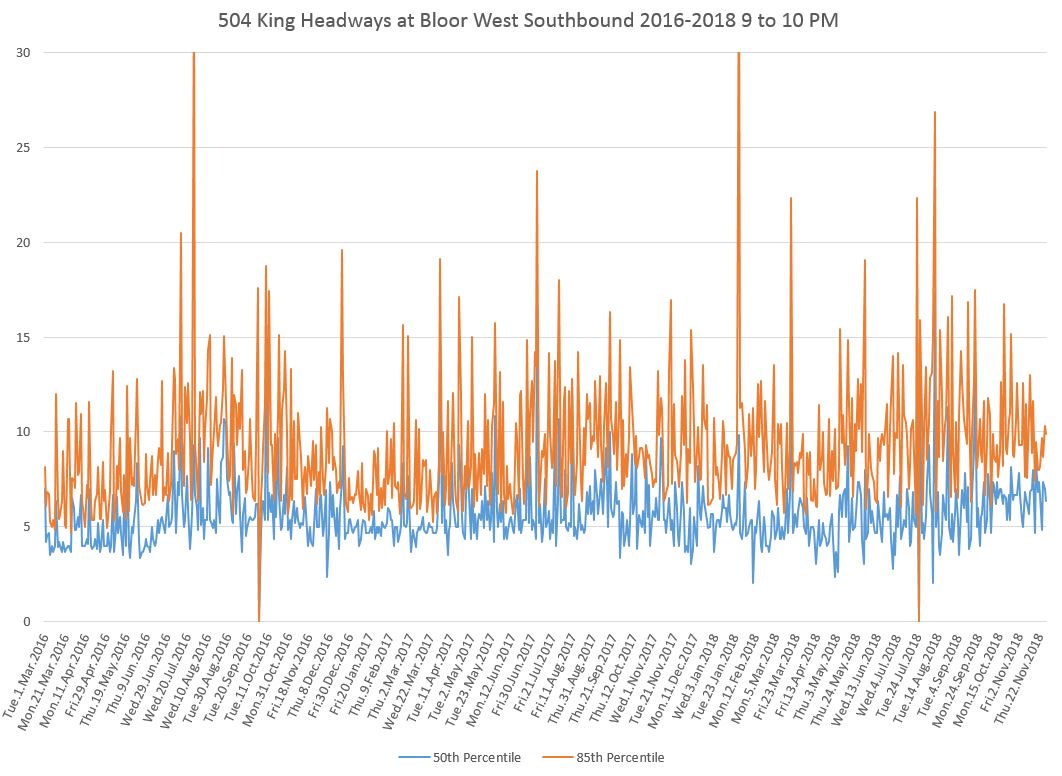
By the PM peak from 5 to 6 pm, the 85th percentile is bouncing around a lot and is often above the 10 minute mark indicating an erratic service southbound to Roncesvalles.
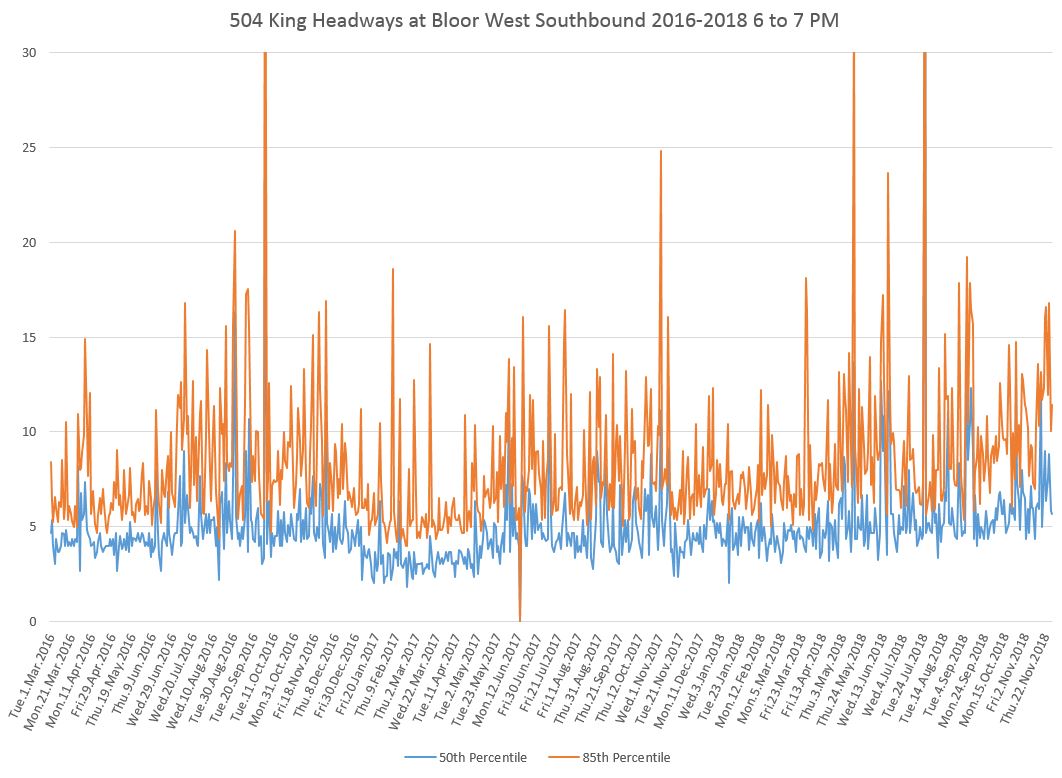
By the hour immediately after the peak, the 85th percentile line has pulled further from the median indicating that riders are even more likely to encounter a ragged service.
By mid evening, the median and 85th percentiles are somewhat less erratic after the October change, but some of the larger variations in the summer and early fall can be attributed to seasonal effects on the inner part of the route.
The full set of charts with data from various parts of the day is linked below.
504_201603_201811_DundasWestSB_Headways
Eastbound at Jameson
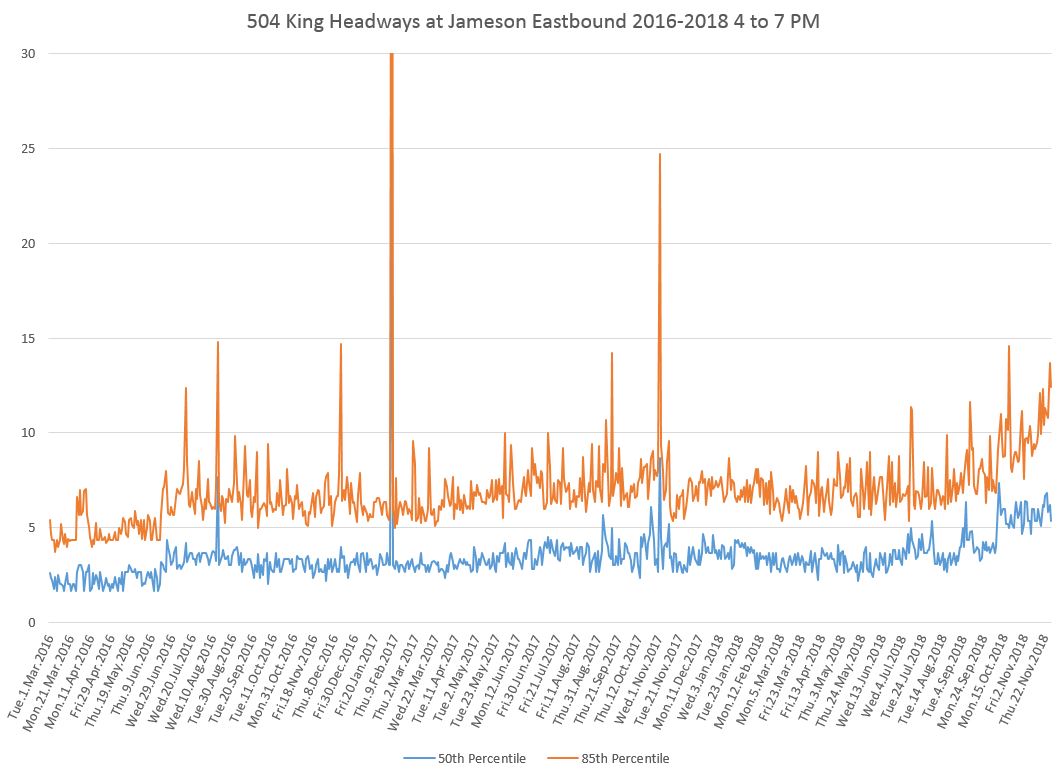
The service at Jameson eastbound has roughly the same median headway as the service leaving Dundas West Station, but the 85th percentile line is higher indicating that some bunching has developed over this part of the route. This problem has existed since before the 504/514 consolidation and before the implementation of the King Street Pilot.
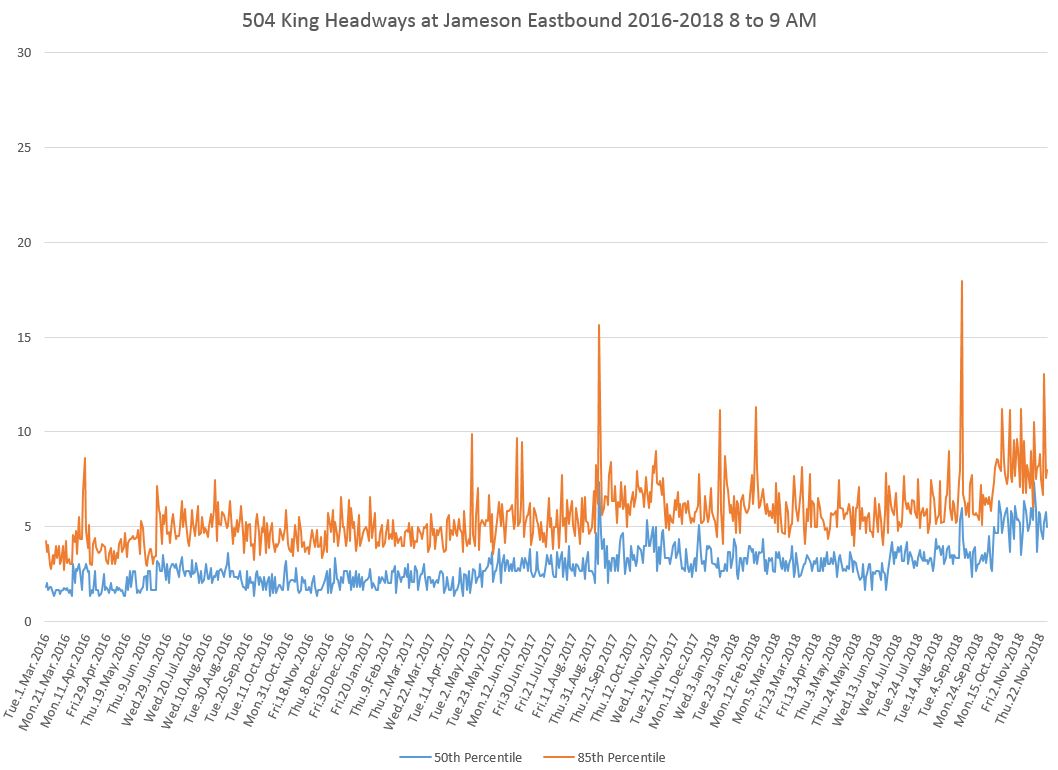
Of particular concern is the rise in the 85th percentile during the PM peak period. This echoes a problem visible in the data southbound from Dundas West above and shows that bunching and wider gaps are a developing problem on this part of the route.
Full set of charts:
504_201603_201811_JamesonEB_Headways
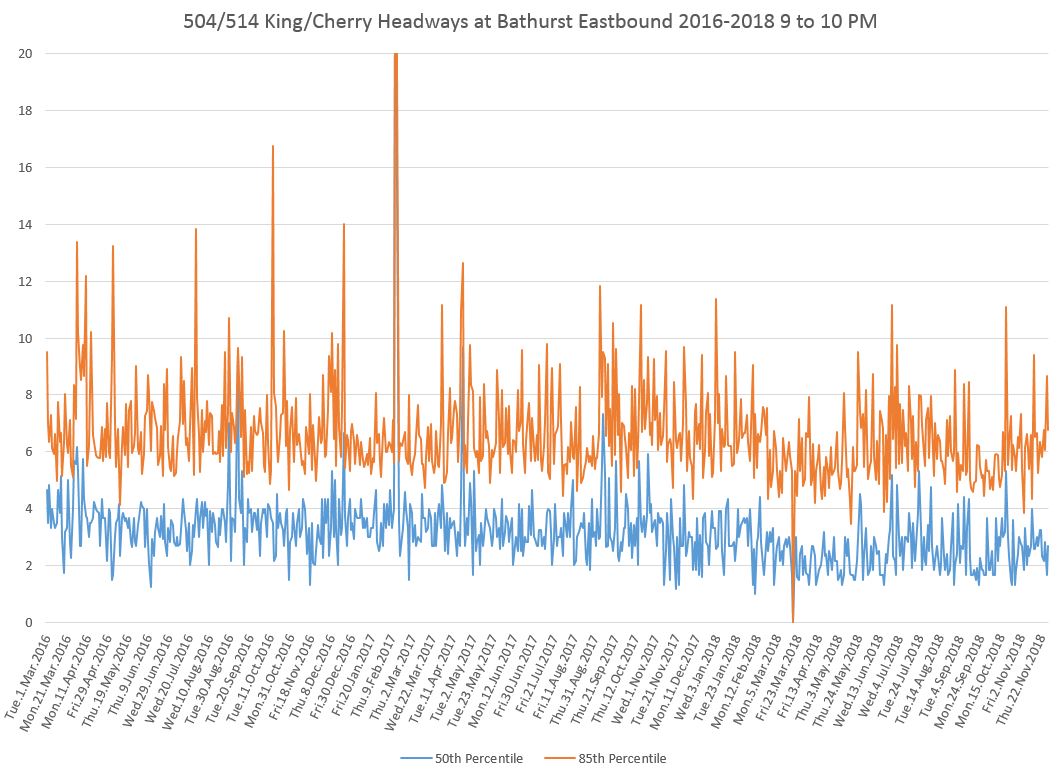
Eastbound at Bathurst
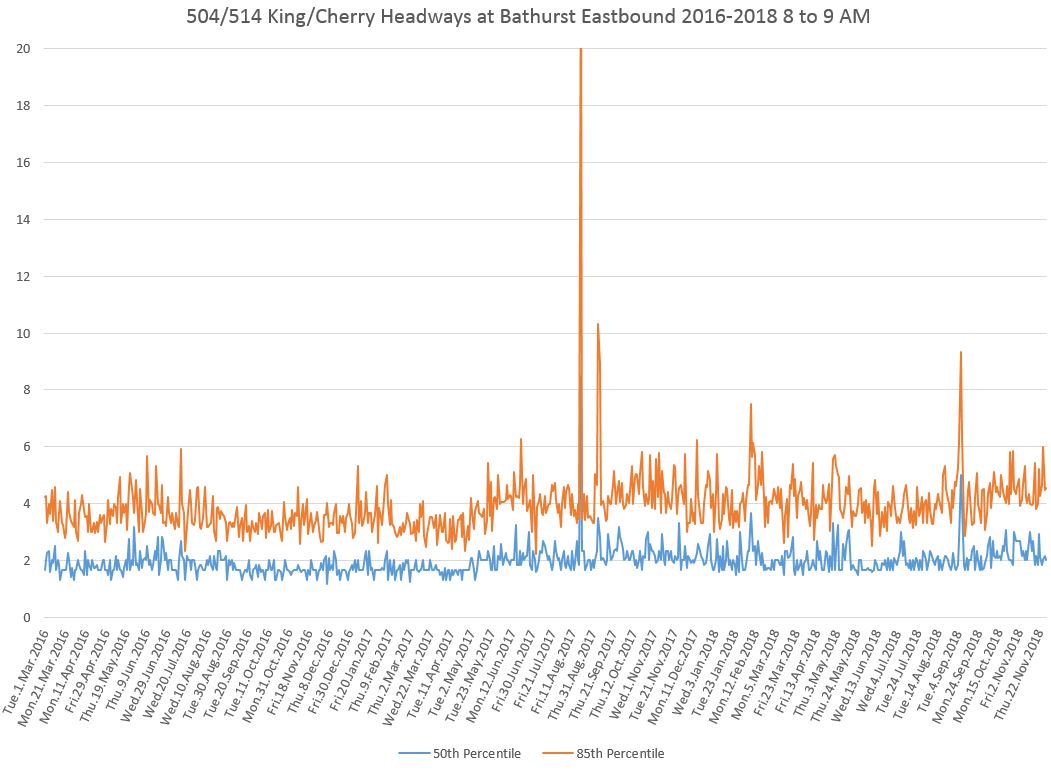
With the 504B service (formerly 514 Cherry) merged in at Dufferin, headways are shorter and the values in these charts do not span as great a range. The vertical axis for charts in the overlap area have a maximum of 20, rather than 30, to better show the two lines clearly.
For the AM peak hour, the stats at Bathurst are about the same in November as in the October post-combination period.
The afternoon peak period shows a slight increase in values in November over October echoing, but on a smaller scale, the change seen at Jameson (above).
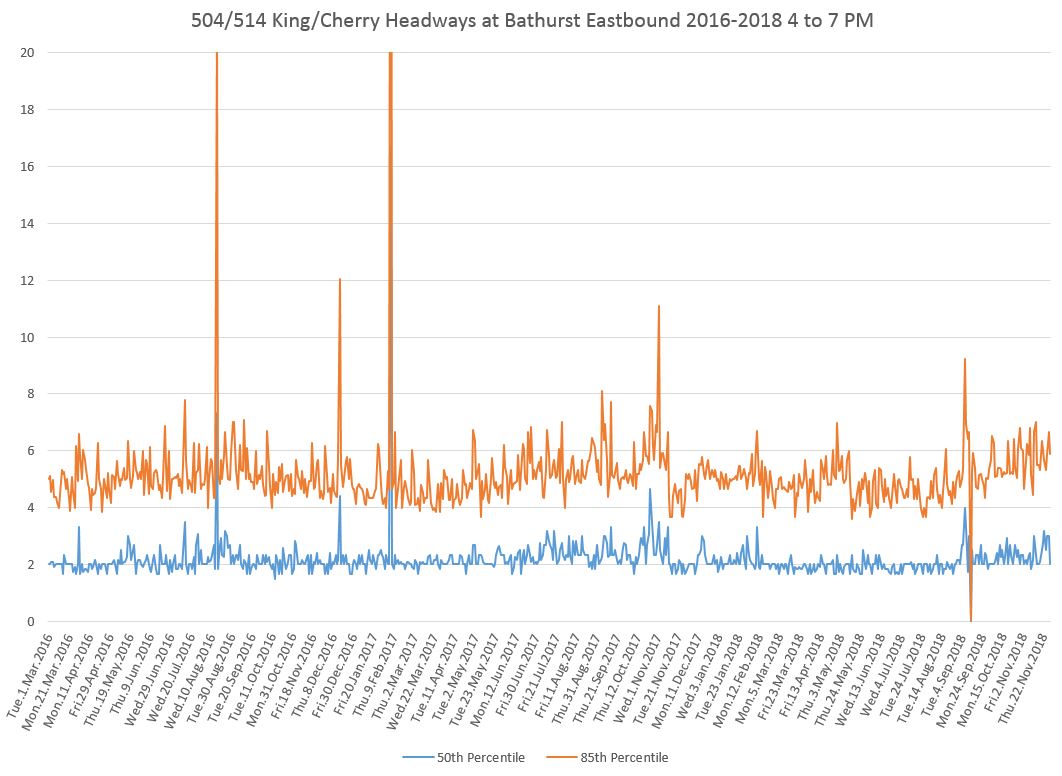
In the mid-evening, by the end of November the 50th percentile is falling while the 85th rises suggesting more bunching and gapping. Until data from a few more months are available, it is difficult to say whether this is simply a seasonal change.
Full chart set:
504514_201603_201811_BathurstEB_Headways
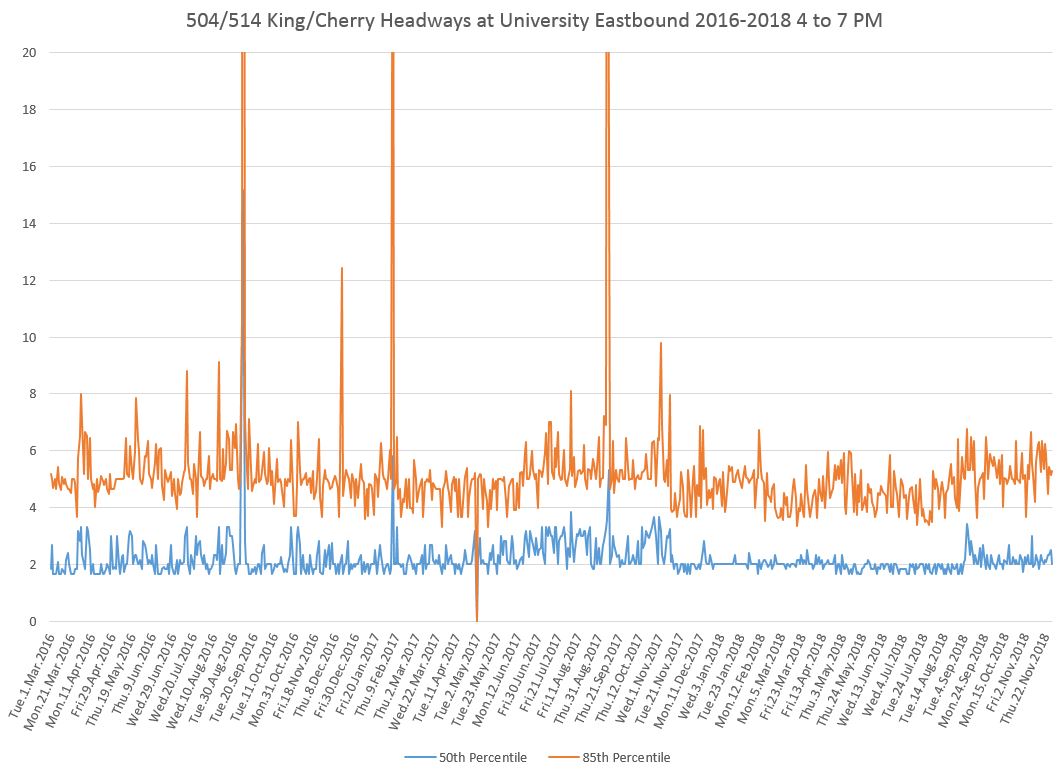
Eastbound at University
The November data in the PM peak continue the pattern seen in October.
Full chart set:
504514_201603_201811_UniversityEB_Headways
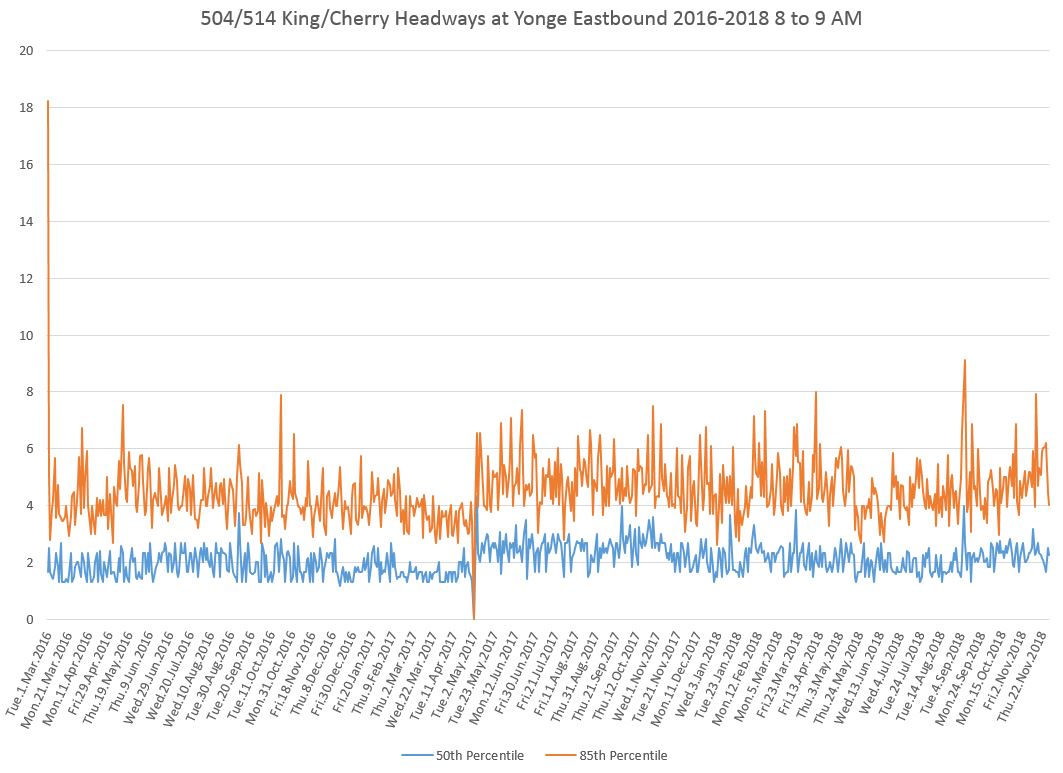
Eastbound at Yonge
The AM peak median values continue as they were in October, but the 85th percentile has been slowly growing. The situation is similar for the PM peak and mid-evening.
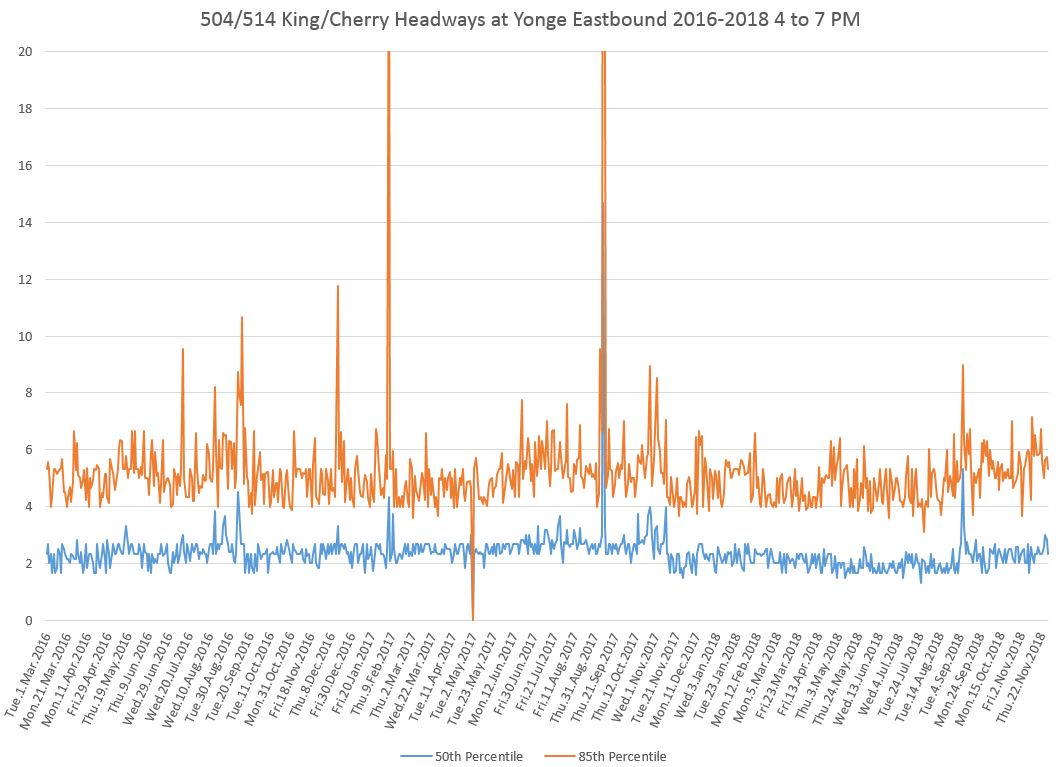
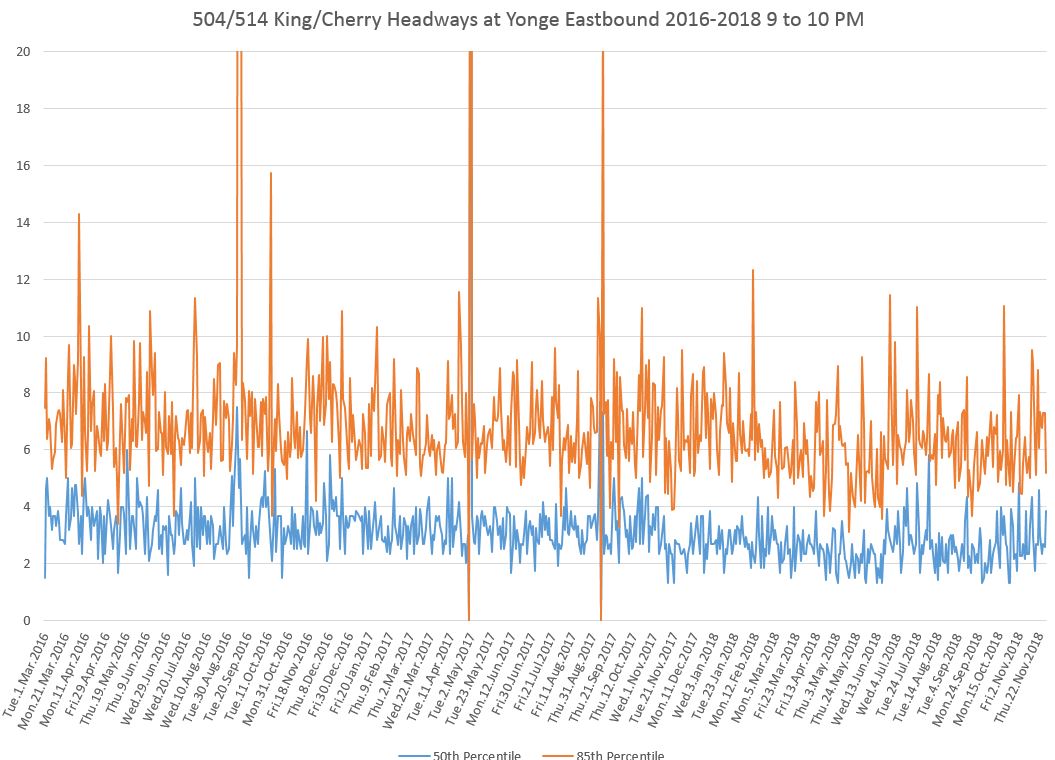
Full set of charts:
504514_201603_201811_YongeEB_Headways
Westbound
From Broadview Station Southbound at Danforth
Note that as for the eastbound charts, the westbound charts for Broadview/Danforth (outside of the combined service area) has a maximum of 30 while other locations the maximum is 20.
As at Dundas West, the scheduled headways at Broadview Station have widened, but the 85th percentile has also risen above the median value showing that gaps riders encounter during the peak hour are now wider than before the 504/514 service consolidation.
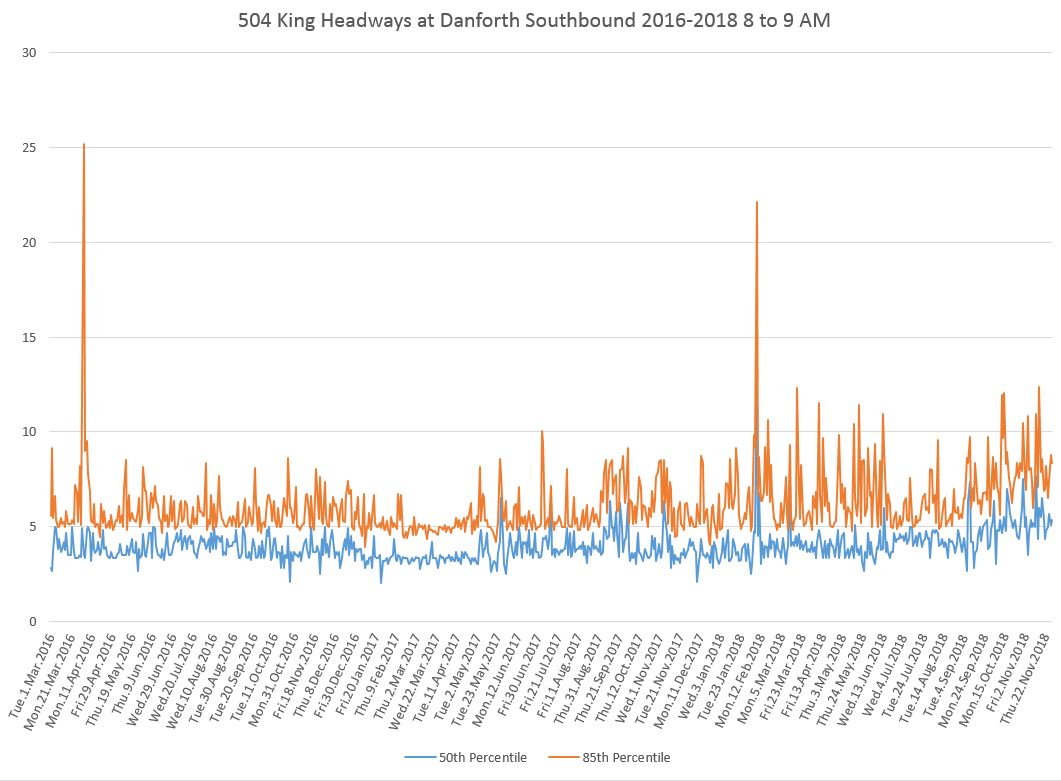
The problem with irregular service is quite striking during midday when the 85th percentile rises far above the median.
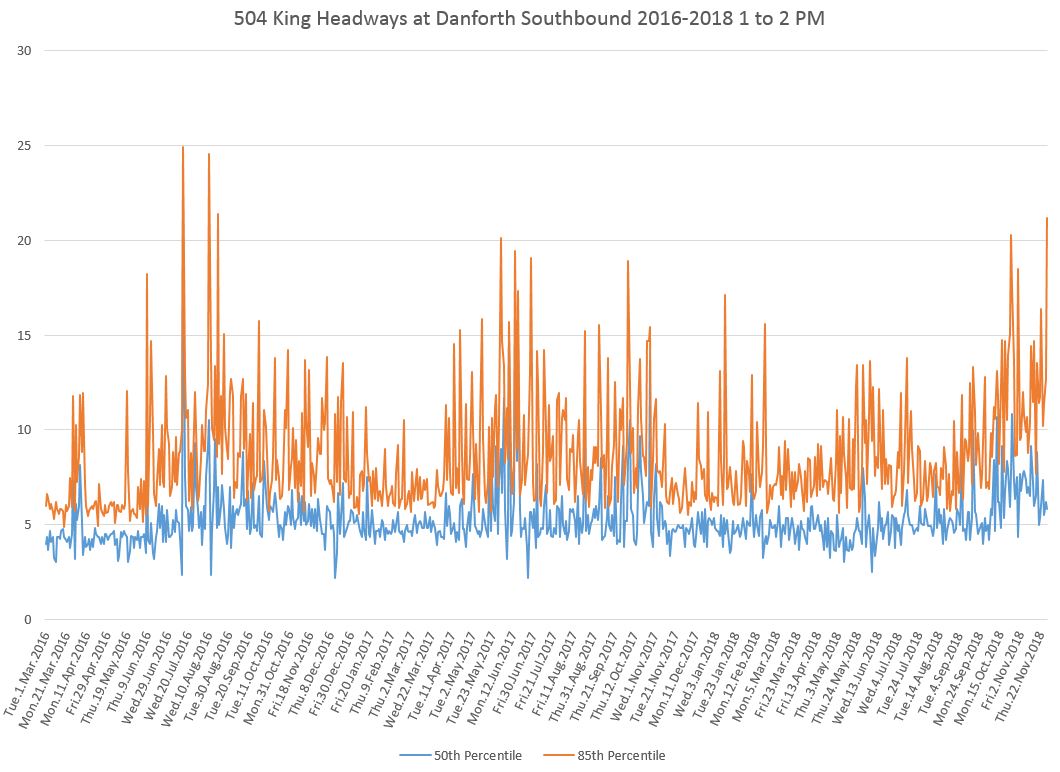
The problem with service reliability continues into the PM peak with the 85th percentile routinely being above 10 minutes.
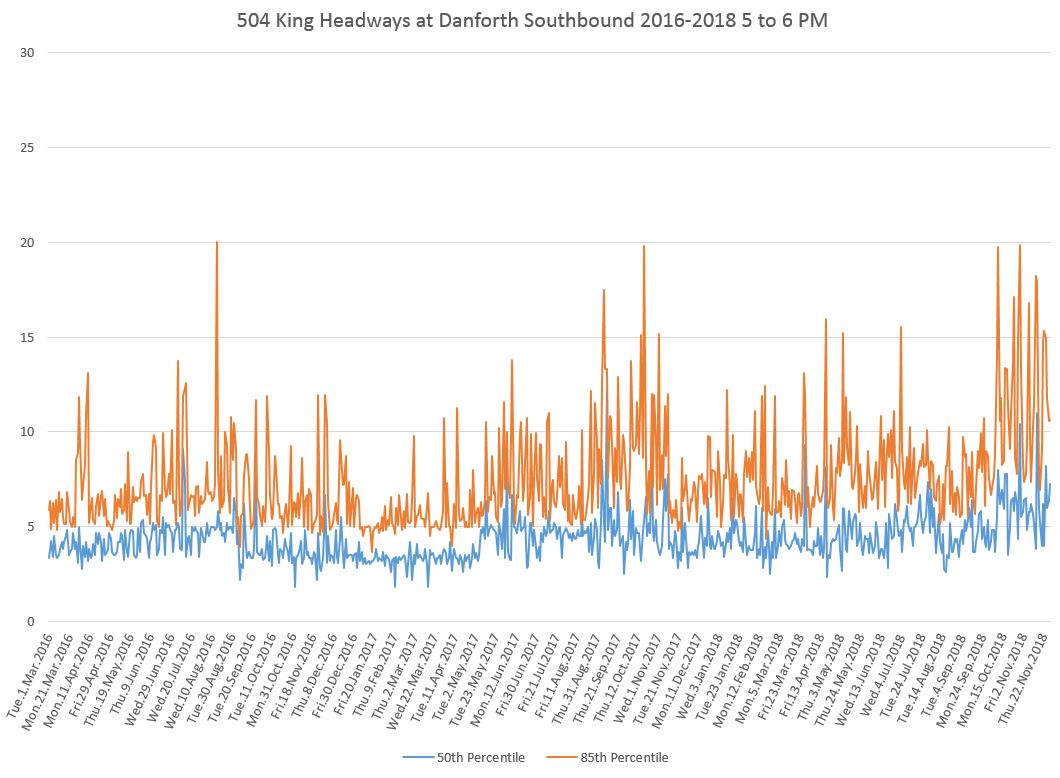
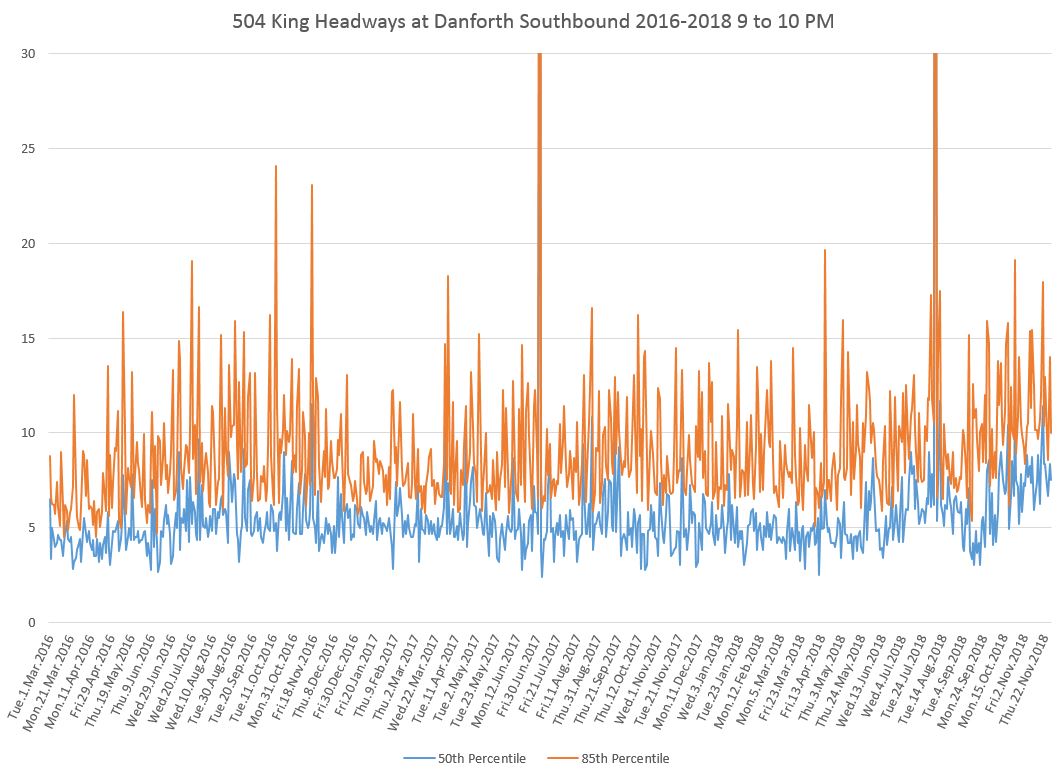
By mid-evening, the median headway is wider in line with the schedule, but both this and the 85th percentile lines bounce around indicating an inconsistent service quality from day to day.
Full chart set:
504_201603_201811_DanforthSB_Headways
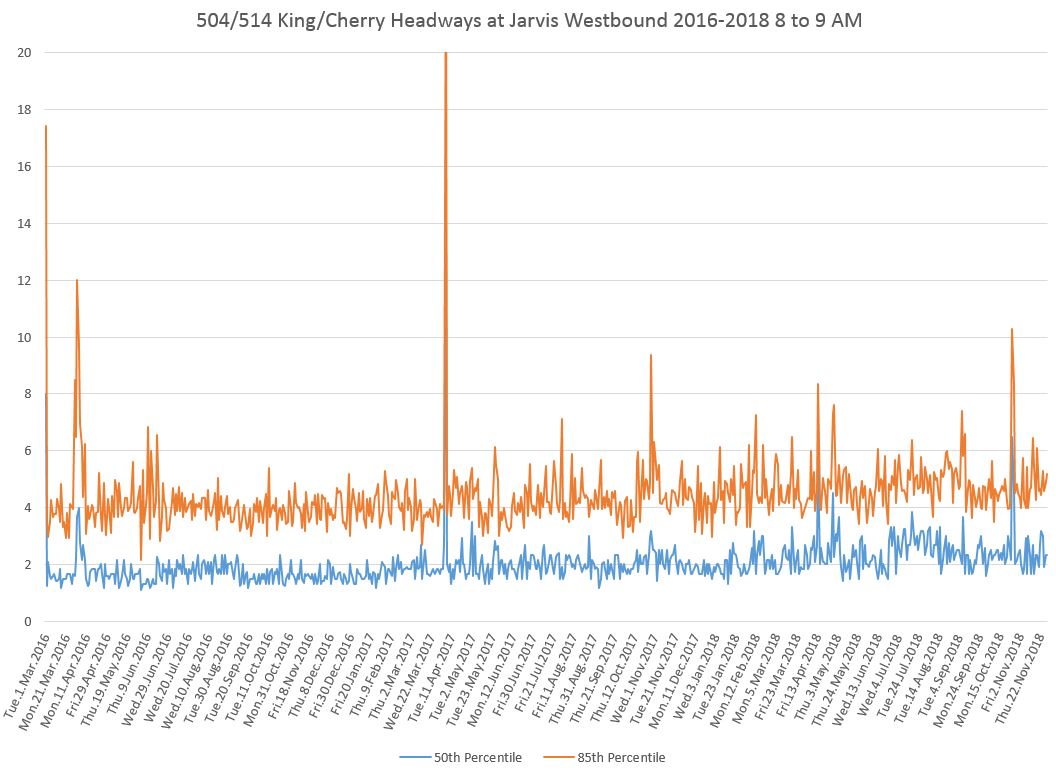
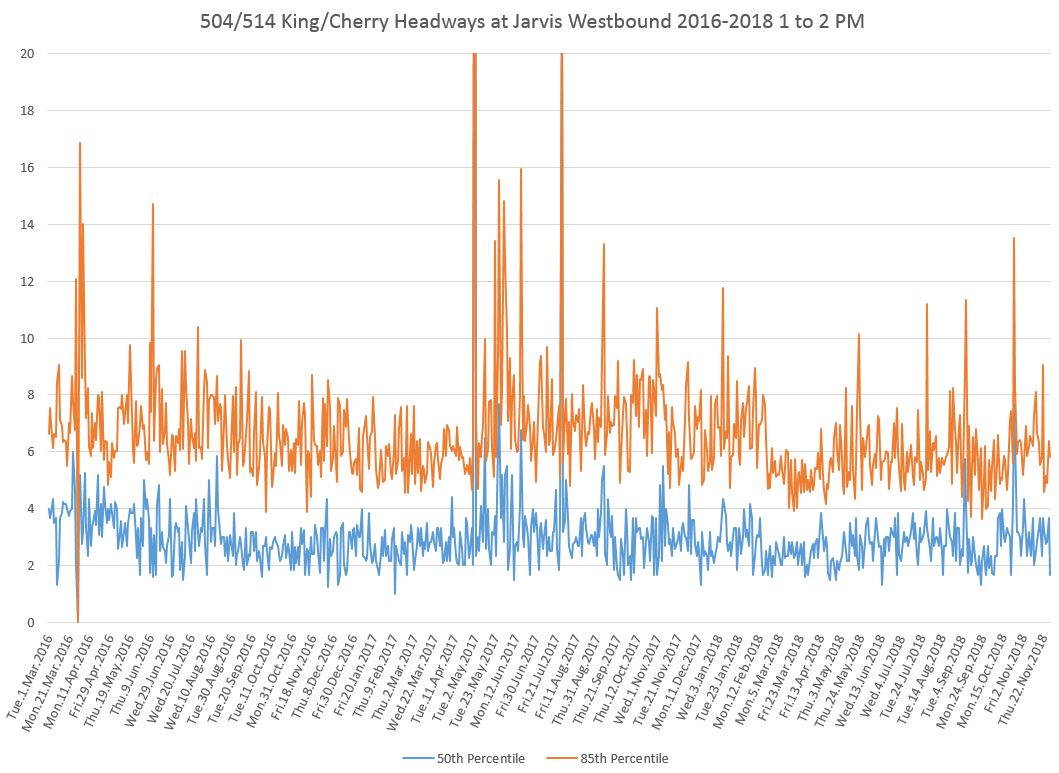
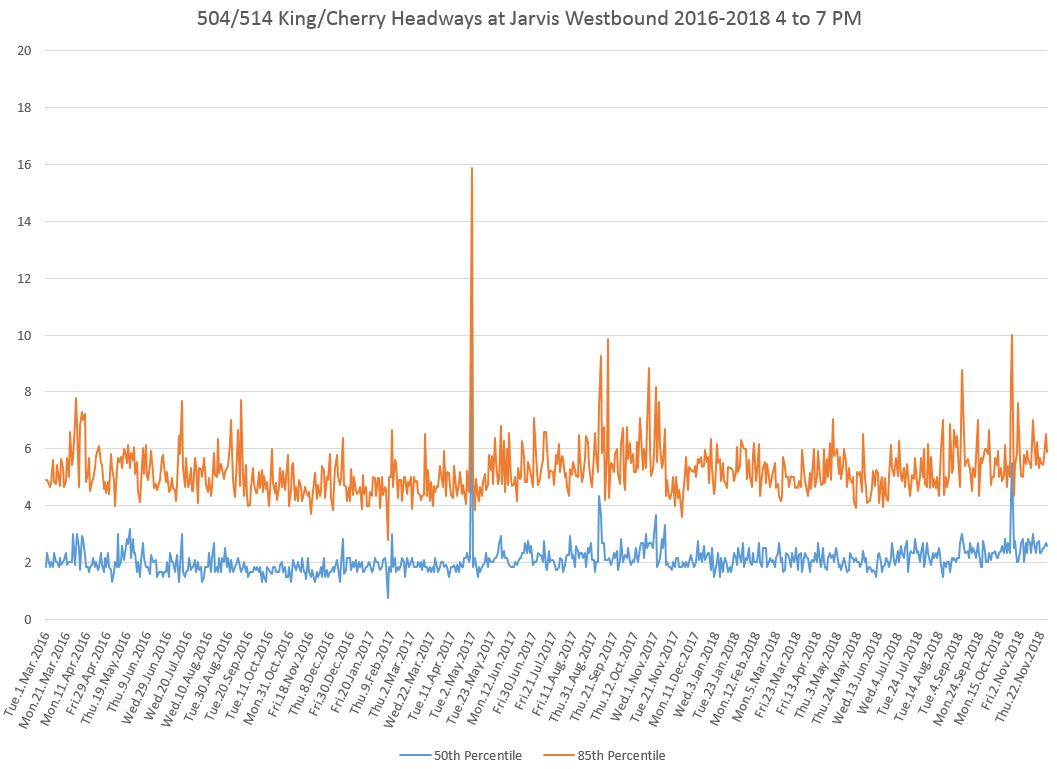
Westbound at Jarvis
November continues the pattern seen in October. The spike at the end of October is on the 26th which is one of the days when the 504A Cherry service did not operate east of Church Street because of a failure in the power supply near Sumach substation. This meant that gaps in the 504B service to/from Broadview had a more severe effect at Jarvis than would otherwise have been the case, and even the median headway was wider because only half of the service operated at Jarvis.
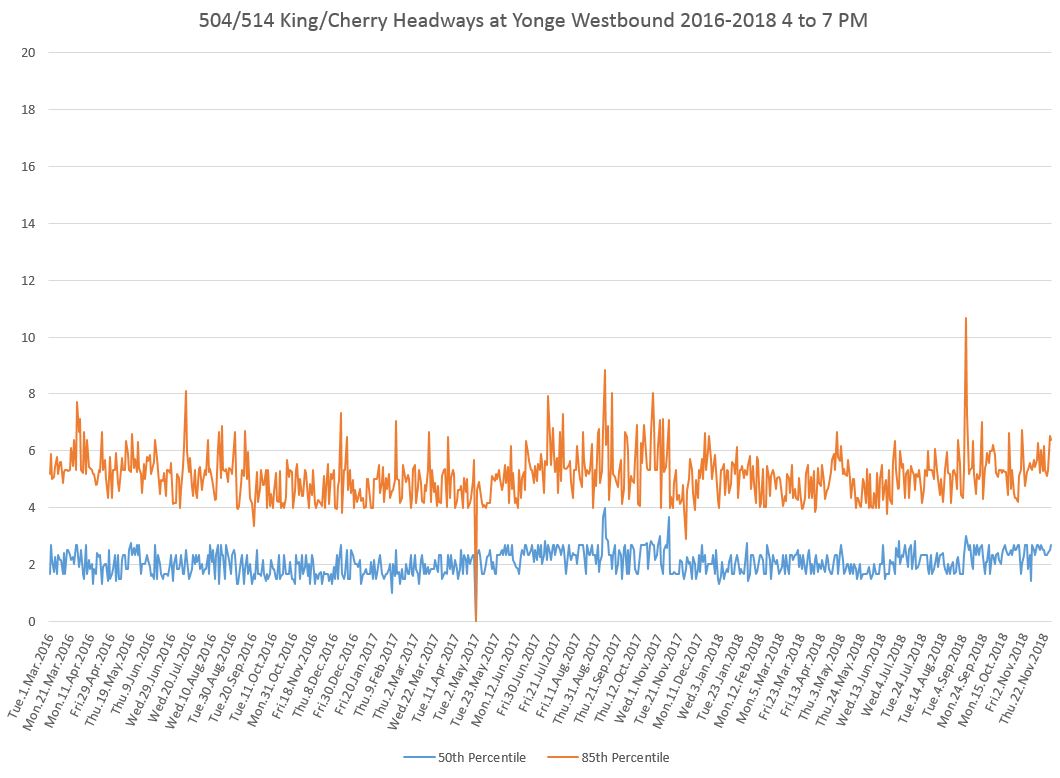
This caused spikes in the 50th and 85th percentile values throughout the day at Jarvis Street. In the next set of charts, at Yonge, these spikes disappear because the 504A service has merged in at Church.
Full chart set:
504514_201603_201811_JarvisWB_Headways
Westbound at Yonge
There is no change in the behaviour of the data at Yonge in November compared to October.
Full chart set:
504514_201603_201811_YongeWB_Headways
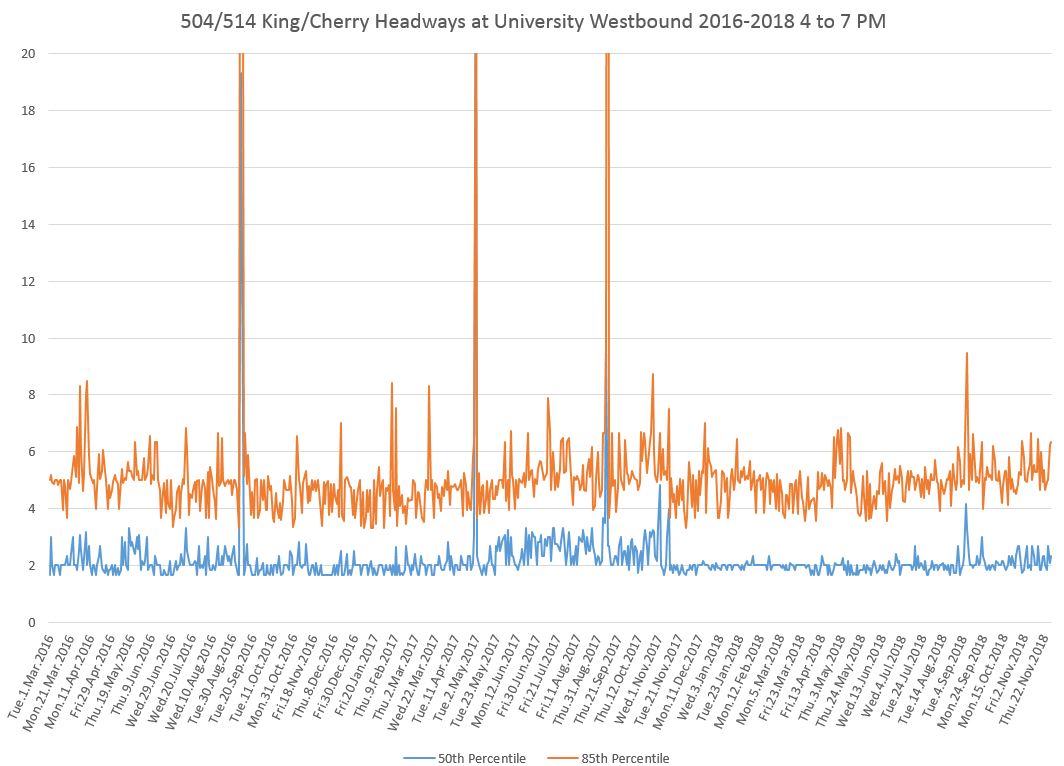
Westbound at University
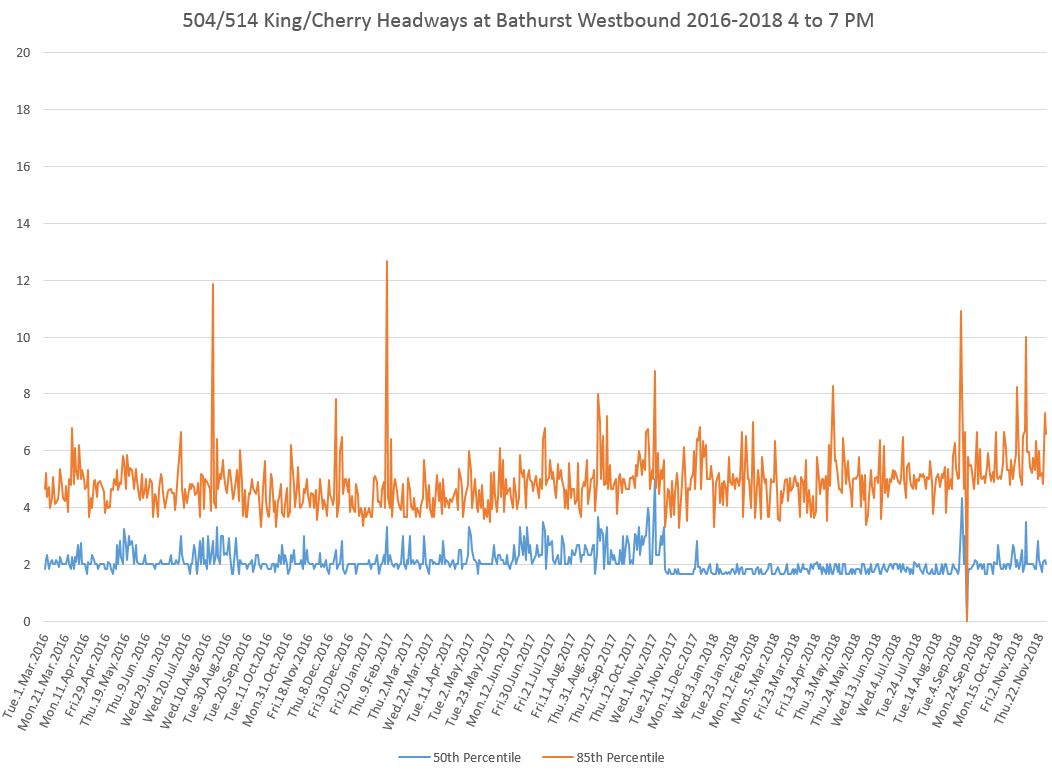
At University and at Bathurst, the median values vary a bit more in November than in October.
Full chart set:
504514_201603_201811_UniversityWB_Headways
Westbound at Bathurst
Full chart set:
504514_201603_201811_BathurstWB_Headways
Headway Reliability on Cherry Street
Although service on the common section of the two 504 King routes is fairly reliable with scheduled service at the same level on each branch, it is not uncommon to see at least two cars for one branch with no intervening car from the other, and for these cars to be close together. At the scheduled off-peak headways, this can produce gaps on the outer parts of the route well beyond the “frequent service” that riders should expect. Service does not leave Dundas West and Broadview Stations on a regular spacing, nor does it from the Dufferin Gate and Distillery loops. It is no surprise that when these merge on King Street, the result is considerably different from the scheduled alternation of cars on two branches.
This will be no surprise to riders who use branching bus services such as 54 Lawrence East which I have reviewed previously, but on 504 King there is the additional factor that the route is branched at both ends rather than only one.
The source data for the charts here is the same as for the percentile charts above, but the information is presented in a different format.
- Individual data points are shown for all trips.
- Only data for November 2018 is shown.
- Charts for weekends are included.
- Trend lines reflect the overall “shape” of the headway data as opposed to percentiles by hour used above.
The purpose of these charts is to illustrate in greater detail the wide variation in headways on a route that is advertised as being part of the “ten minute network”.
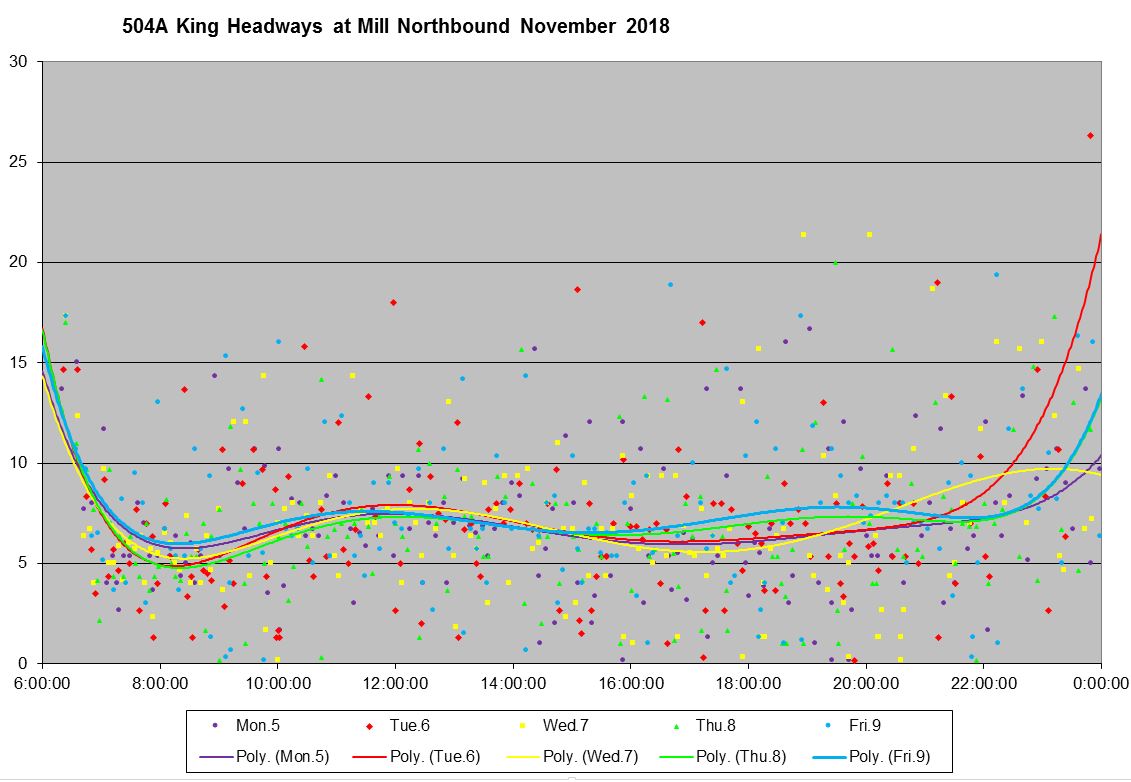
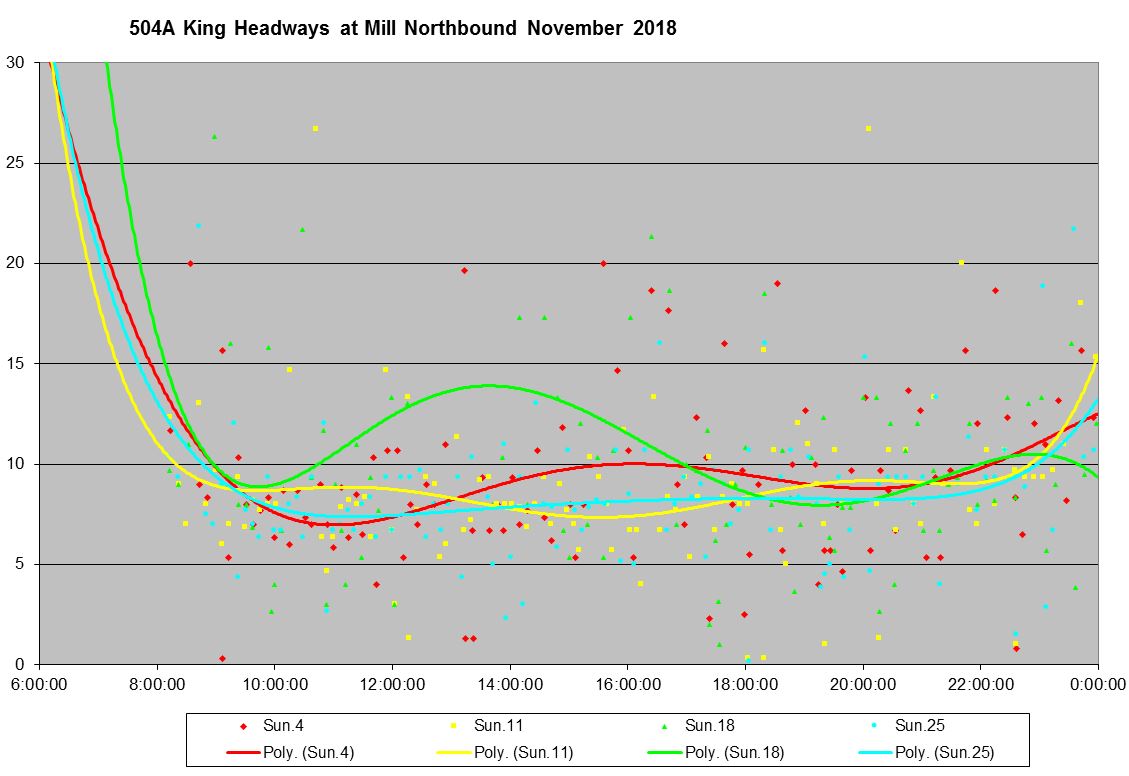
The chart below shows the data for trips leaving Distillery Loop in the second week of November 2018 (see the full set of charts linked below for other weeks).
Each dot represents one trip with colour coding by day. The trend lines show the overall shape of the data and they generally follow the scheduled level of service. In other words, most of the scheduled trips are operated, but they do not depart on anywhere near the scheduled headways. This is the “best behaved” week of the month, but there are many data points well above the ten minute line and also many that are close to zero. This is a classic pattern for service bunching and gapping, and shows that there is little or no regulation of service leaving the terminus.
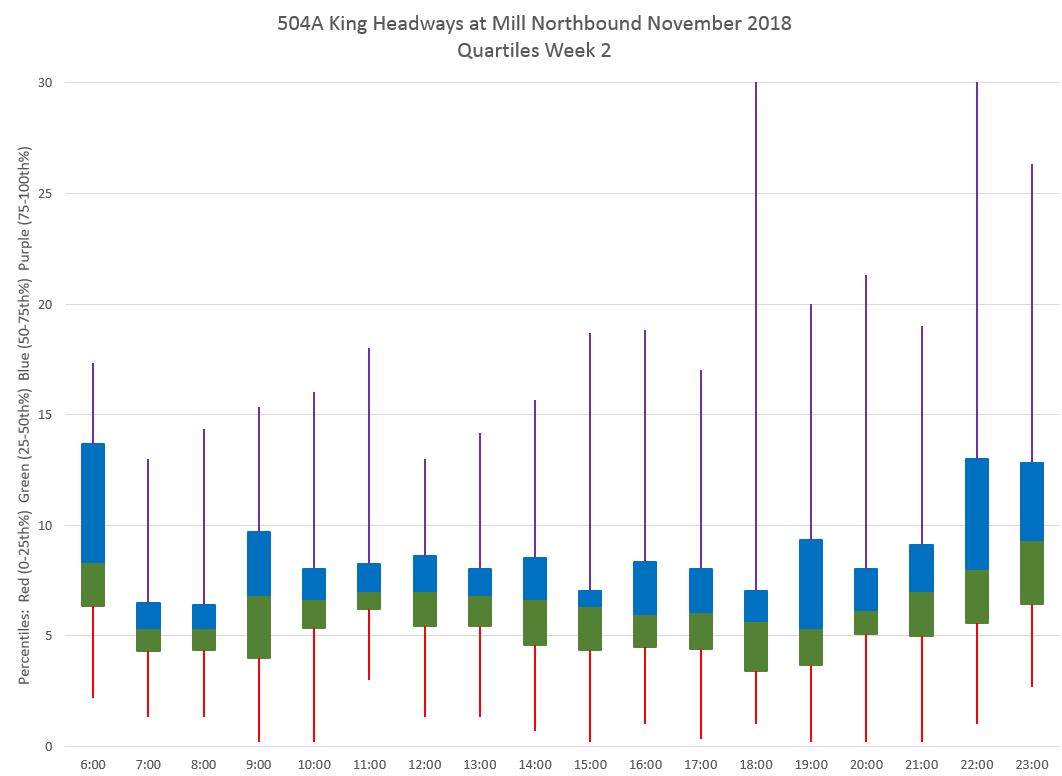
Another view of the same data groups the points in quartiles by hour. For most of the day, the two middle bands (green and blue boxes) representing half of the service lie within a band of three to five minutes, the other half of the service includes minima that are close to zero (red bars below) or well above 10 minutes (purple bars above).
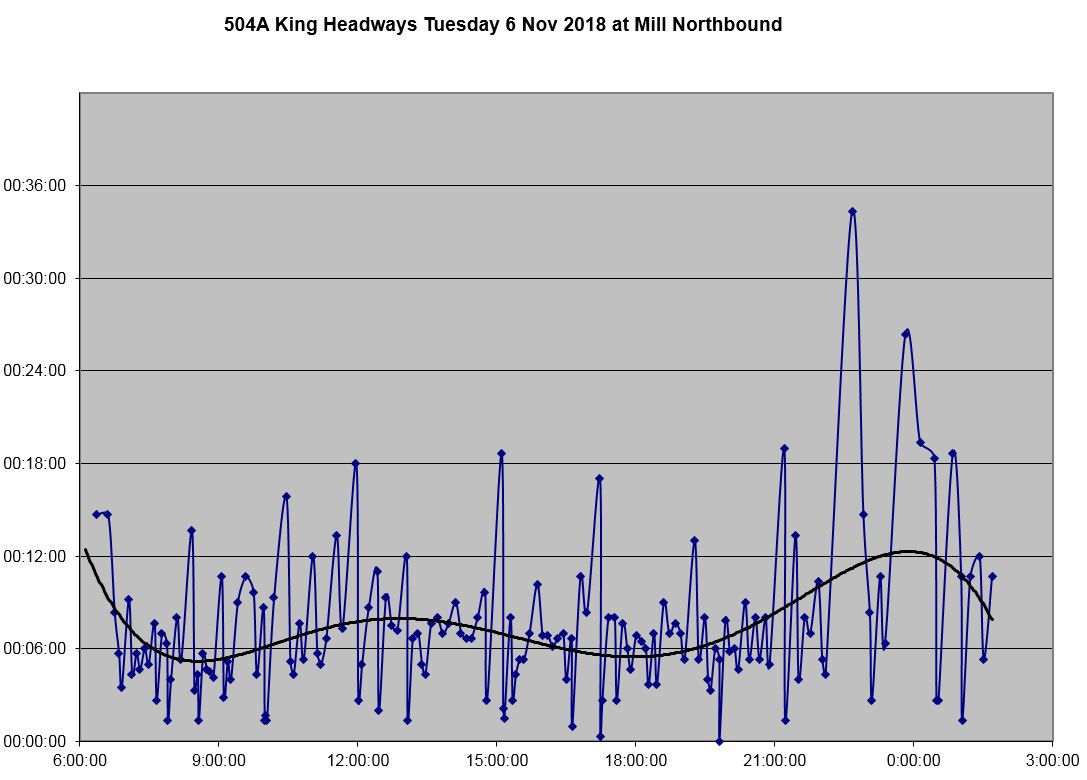
At the level of a single day’s data, here is Tuesday November 6 (red dots on the scatter plot above). The very large gap late in the evening at 22:40 was caused by a delay that blocked service. An hour later, there is another gap that is the “echo” of the first one and was caused by an eastbound car that would have split the gap running out of service to Leslie Barns without serving the Distillery.
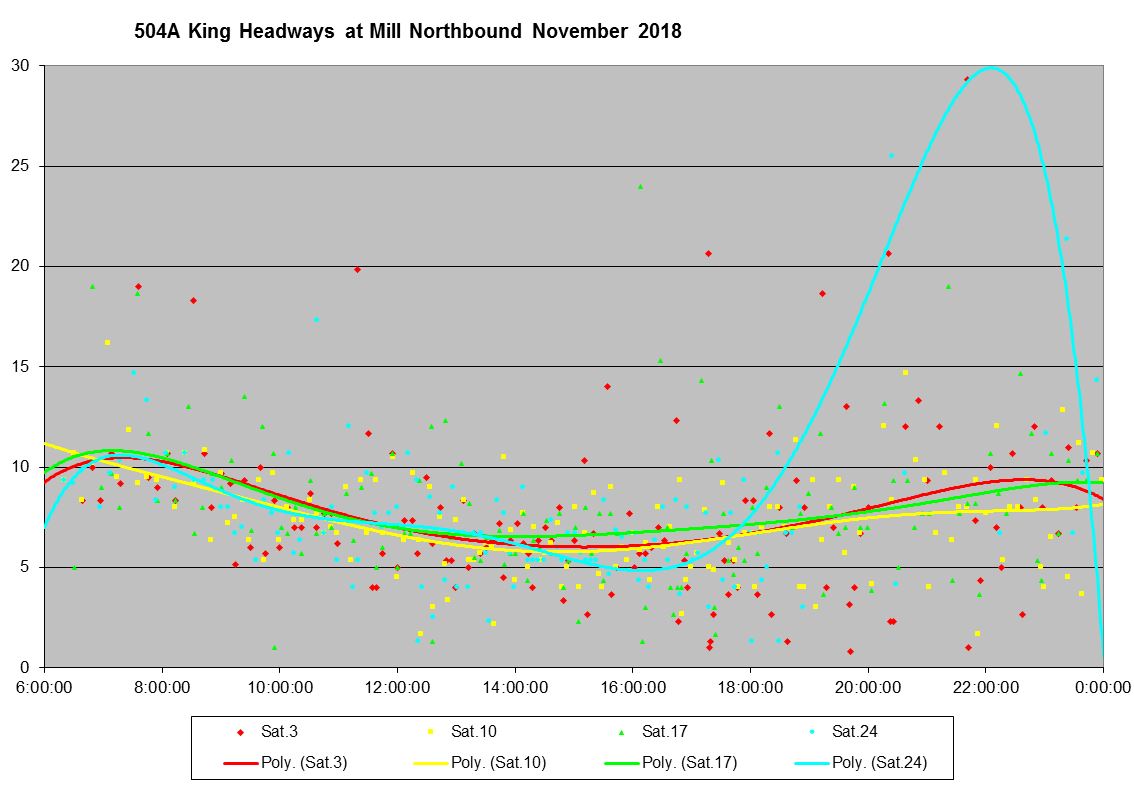
The situation on weekends is similar with headways spread over a considerable range.
- Saturday November 24: A collision on King at Sackville blocked service for almost five hours through the evening.
- Sunday November 18: The Santa Clause Parade caused traffic congestion downtown and produced extended headways.
Full chart set:

It’s interesting you posted this today. Shortly after reading it I left for home from work, about 2:30 p.m.. It was Christmas Eve so I was expecting traffic and streetcar ridership to be very low. It was in fact quite low, yet service was still somehow borked to the point of mass bunching. When I left the office downtown there were no cars in either direction between Parliament and west of Spadina. Almost the entire pilot area had no streetcars at all. It was a 10 minute wait at King and Bay as the first one to finally arrive, trailed by two others, was operating at a very leisurely pace. Not sure why since by then the car in front of it was already in Distillery loop.
LikeLike