
This article continues the series reviewing the effects of the King Street Pilot with data up to November 29, 2018. [November 30 will be included with the December update.]
November 2018 was the first full month of the consolidated 504/514 King/Cherry services with subroutes from Dundas West to Distillery (504A) and Broadview to Dufferin (504B). The new service design does not affect running times through the pilot area, but is does have an effect on headways depending which portion of the route one is travelling.
The transition to 100% low floor operation on 504 King is now complete and there was no change in the scheduled service capacity after the mid-October route consolidation. 503 Kingston Road trippers continued to operate with the smaller high-floor cars to the Charlotte Loop at Spadina through November. In January 2019, the 503 will revert to bus operation and will loop over the standard streetcar routing via Church-Wellington-York. This will slightly reduce the capacity for short trips within the pilot area during peak hours.
This article deals with travel times and line capacity. In Part II, I will turn to headways (the time between vehicles) and reliability.
Travel Times
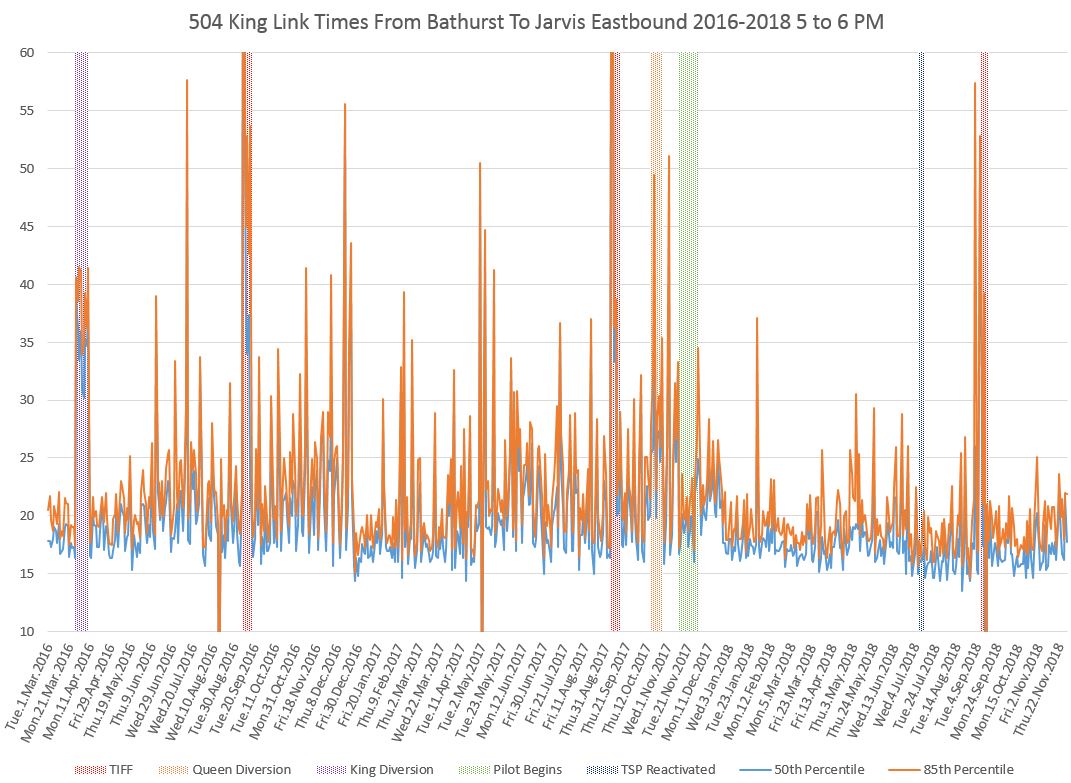
The following charts show the travel times between Jarvis and Bathurst (the pilot project limits) in each direction for the pm peak hour, 5-6 pm, over the past three years. The 50th percentile (median, blue) and 85th (orange) are shown. As with all previous charts, there is a small reduction in travel time compared to the pre-pilot data, but there is also a marked reduction in the range of values showing a much more consistent travel time.
The values swing upward a bit in November, although they are still slightly better than a year ago when the pilot began. Some of this change is probably seasonal, but that will be verified with data from December and January. In the sets of charts showing the data for various times of day, this rise occurs mainly in the peak period.
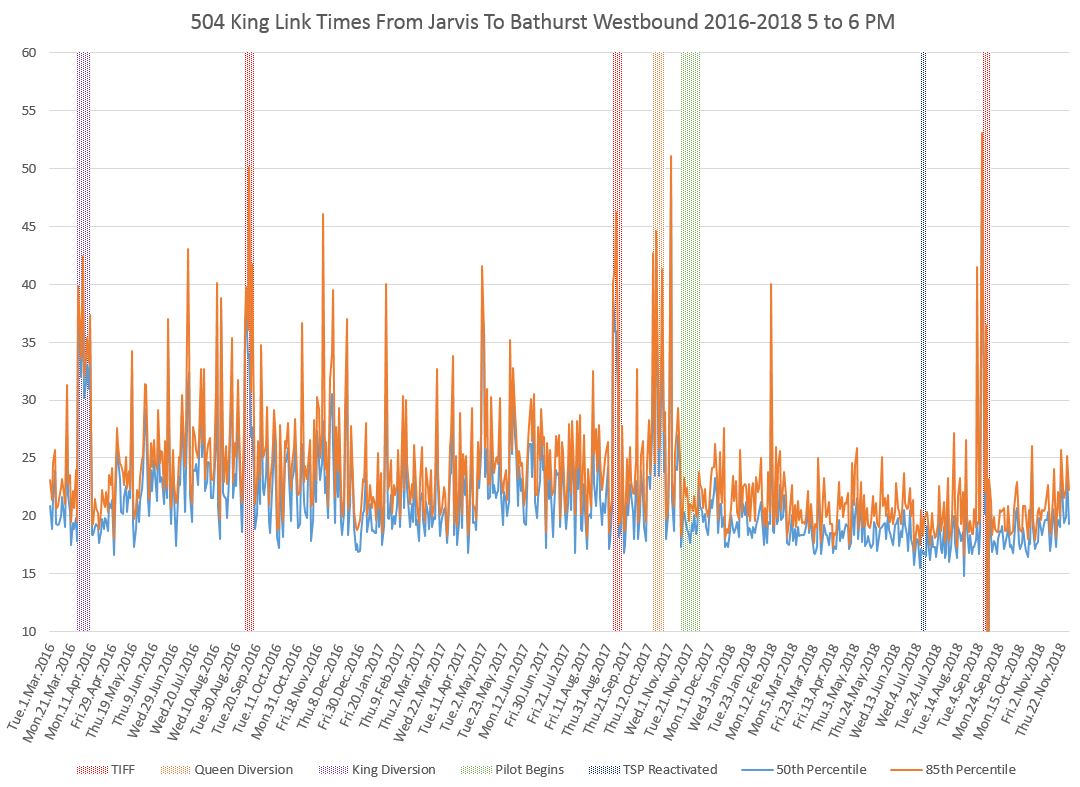
The rise in November travel times does not show up in the westbound data for the preceding hour, 4-5 pm.

However, an increase is visible in the following hour, 6-7 pm.

The full sets of charts are linked below.
- 504_201603_201811_JarvisBathurst_50th85thPercentiles
- 504_201603_201811_BathurstJarvis_50th85thPercentiles
For a more thorough discussion of past events and trends in these charts, please refer to the October 2018 update.
