
Updated November 27, 2018: A major section has been added comparing travel times between Jarvis and Bathurst on Queen and King Streets.
With the King Street Pilot a year old, one area that also deserves a review is the effect it has had on transit service on Queen Street. The short answer is “very little” with the usual caveats about seasonal variations and unusual events that complicate direct before and after comparisons.
The charts presented here cover the period from March 2016 to October 2018, the same period as King Street charts in recent articles. Selected images are included in the post, and more extensive sets are linked in PDFs.
(Note that the level of detail in the three-year charts is such that they suffer when reduced in size to the scale of a blog post. Click on any of them to open a full size version in a new browser tab.)
Major Events on Queen Street
More so that on King Street, Queen has been affected by many construction activities over the three years, and of course it also has more special events disrupting service in the area parallel to the pilot on King. The major events affecting travel times between Jarvis and Bathurst Streets are highlighted in these charts.
- April 2016: Reconstruction of King and Charlotte diverted service onto Queen adding to streetcar running times there primarily through delays where King cars turned off of Queen without assistance from traffic signals.
- May to December 2016: Water main reconstruction on Queen west of Spadina triggered a long-running diversion of service via Spadina to King. The times shown are measured between King and Bathurst and Queen and Jarvis for this period where vehicles were diverted.
- September 2016: Although TIFF closed part of King Street, the service was split rather than diverted. There is no effect on Queen running times beyond that already seen for the diversion of the 501 route.
- May to August 2017: Construction continued for another summer on Queen including completion of work started in 2016 and replacement of the pedestrian bridge at Queen and Yonge. Buses operated on 501 Queen.
- September 2017: Streetcars returned to Queen. Reconstruction of Dundas from Church to Yonge caused some traffic to shift south to Queen. King services diverted onto Queen during the opening weekend of TIFF.
- October 2017: Reconstruction of Queen & McCaul caused Queen service to divert via King between Church and Spadina.
- November 2017: King Street Pilot begins.
- June 2018: Construction delays.
- September 2018: TIFF diversions delay Queen service.
Chart Format
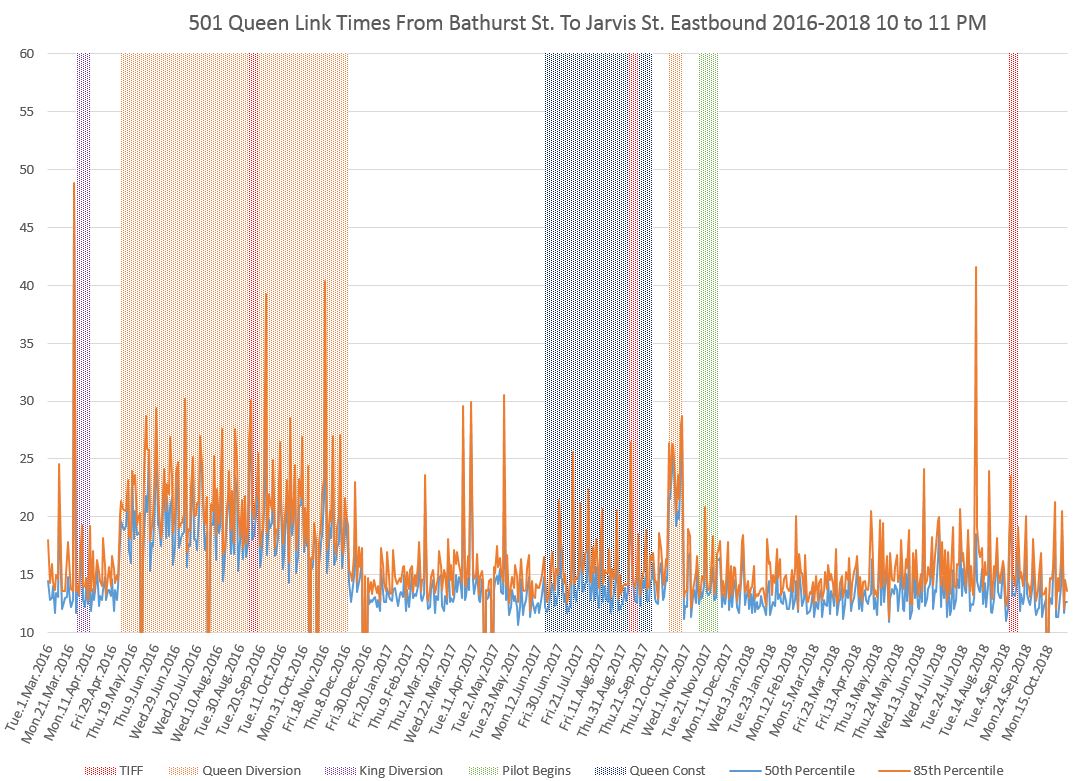
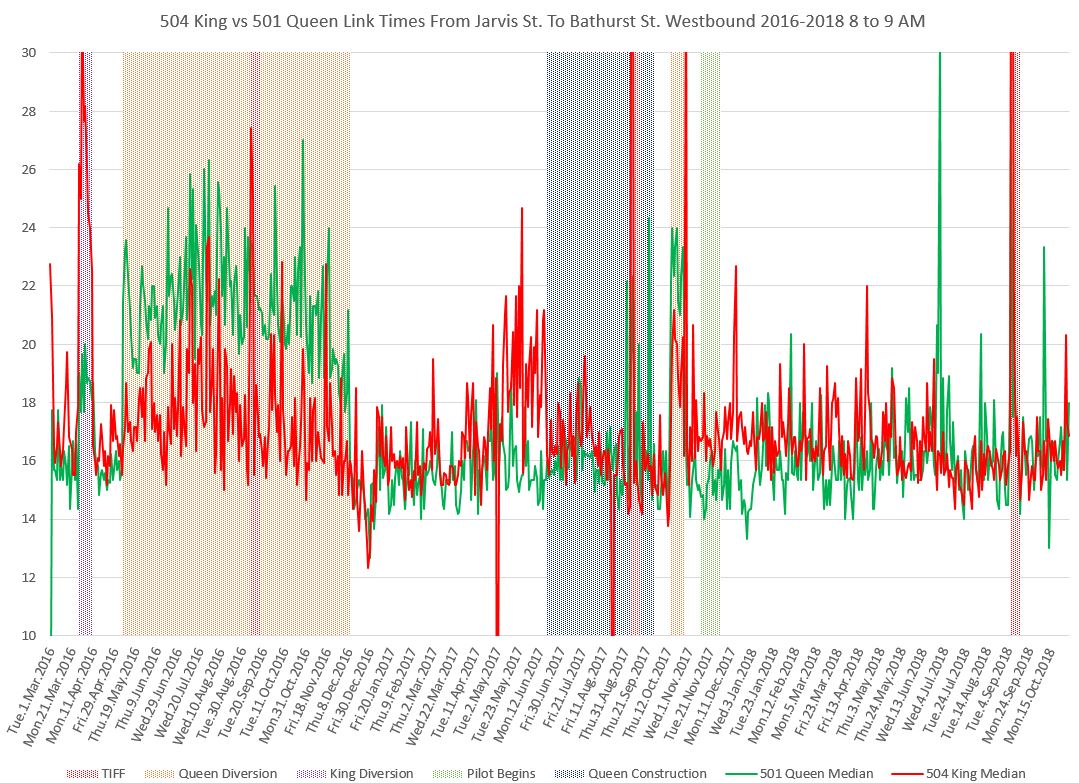
As with the King Street analysis, the charts here show the 85th percentile values for travel times in orange. This includes most trips across the area parallel to the pilot on King. The median value (50th percentile) is shown in blue. Half of the trips took longer and half shorter than this value. When these values track close together, most trips will lie in a fairly narrow band of values (see details for October 2018 later in this article). Where the lines pull apart, travel times seen by riders will have more variation in length.
Where the route was on diversion in 2016, the time shown is measured between Bathurst & King to Jarvis & Queen via Spadina.
For the diversion in 2017, the time is measured between Bathurst and Jarvis on Queen, but includes the diversion both ways via Spadina, King and Church.
Where a value drops to zero, this indicates that no car was observed between the two points usually due to a short-term diversion around a major blockage.
AM Peak 8 to 9 am
Westbound
The beginning of the pilot in November 2017 had no effect on AM peak travel times. The spike in late June 2018 was caused by construction delays according to TTC eAlerts.

Eastbound

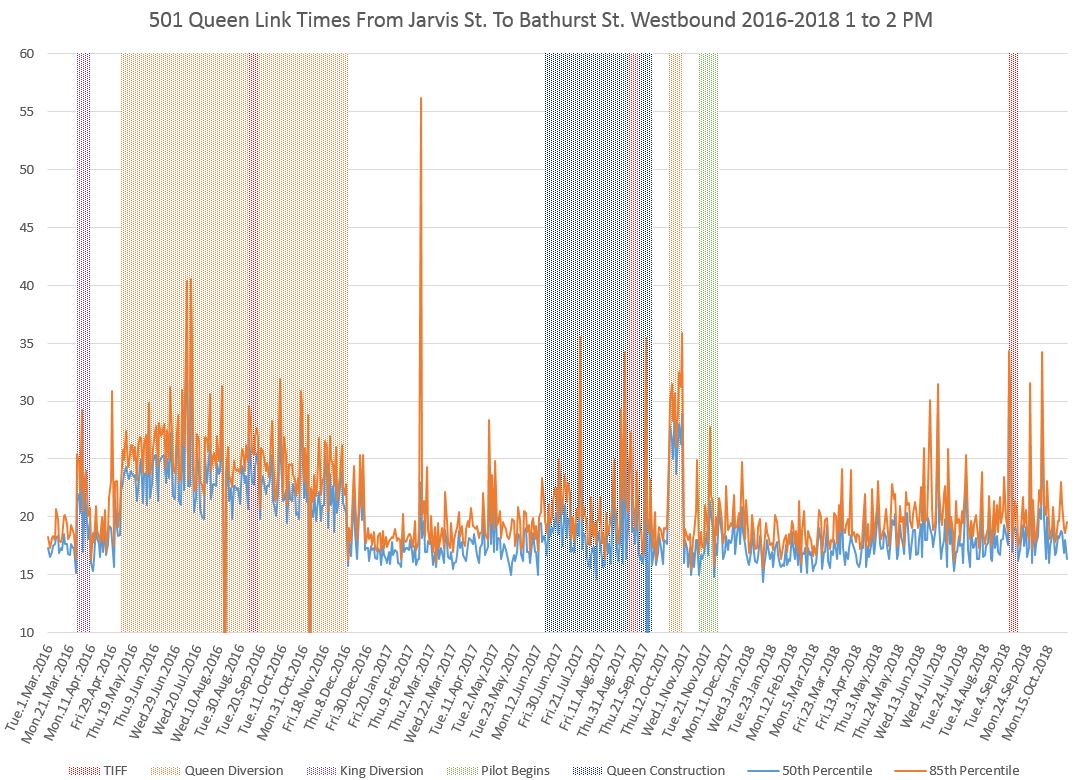
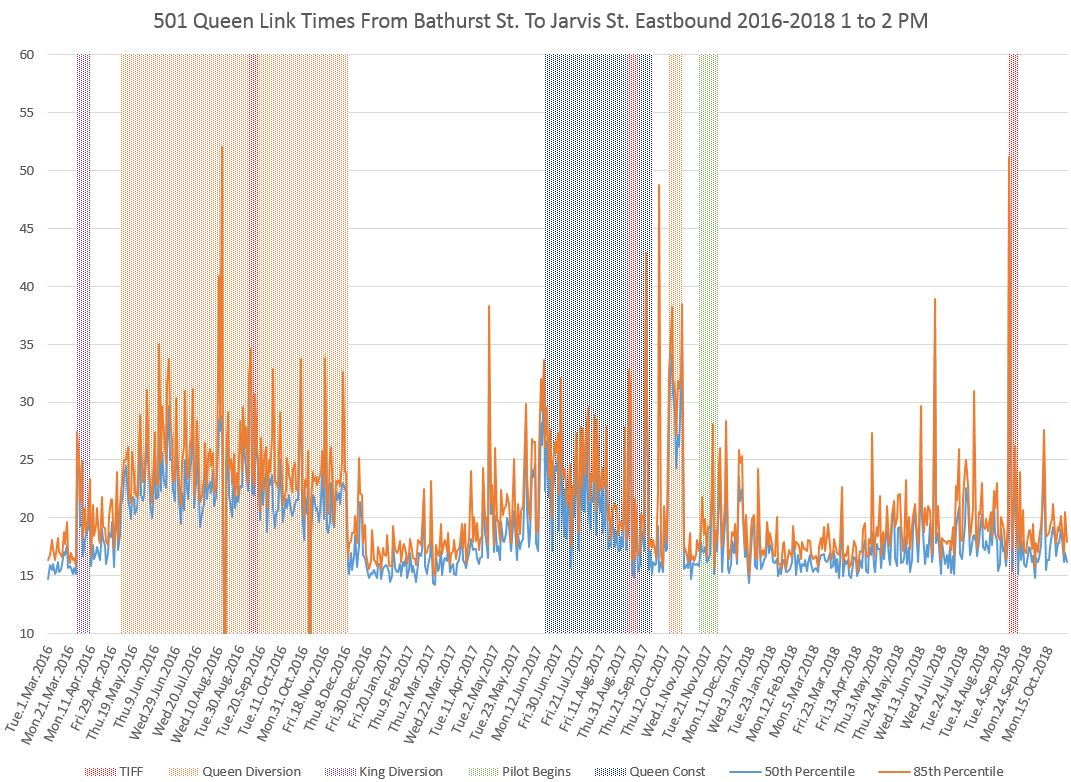
Midday 1 to 2 pm
The midday data show a slight increase in travel times with the beginning of the pilot, although these fall back in early 2018. This could be due to traffic readjusting to the new conditions in the core area. By comparison to previous years, the drop in January is probably a seasonal effect. There is also a rise in travel times in April-May of both 2017 and 2018.
Westbound
Eastbound
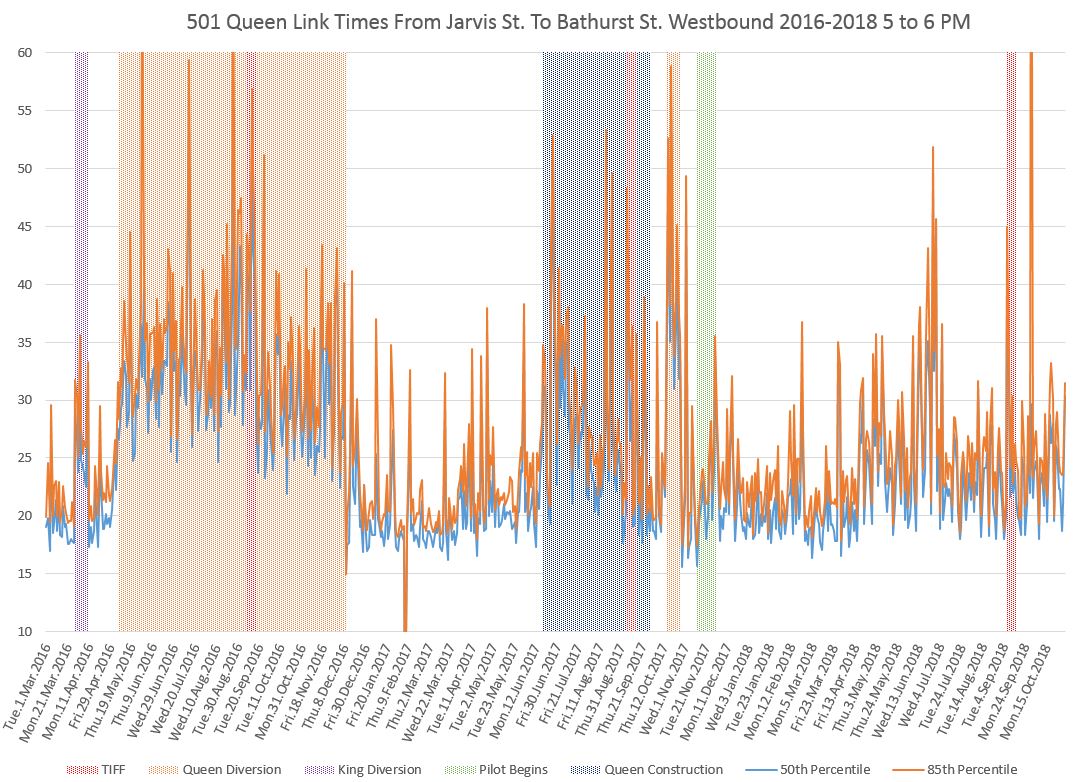
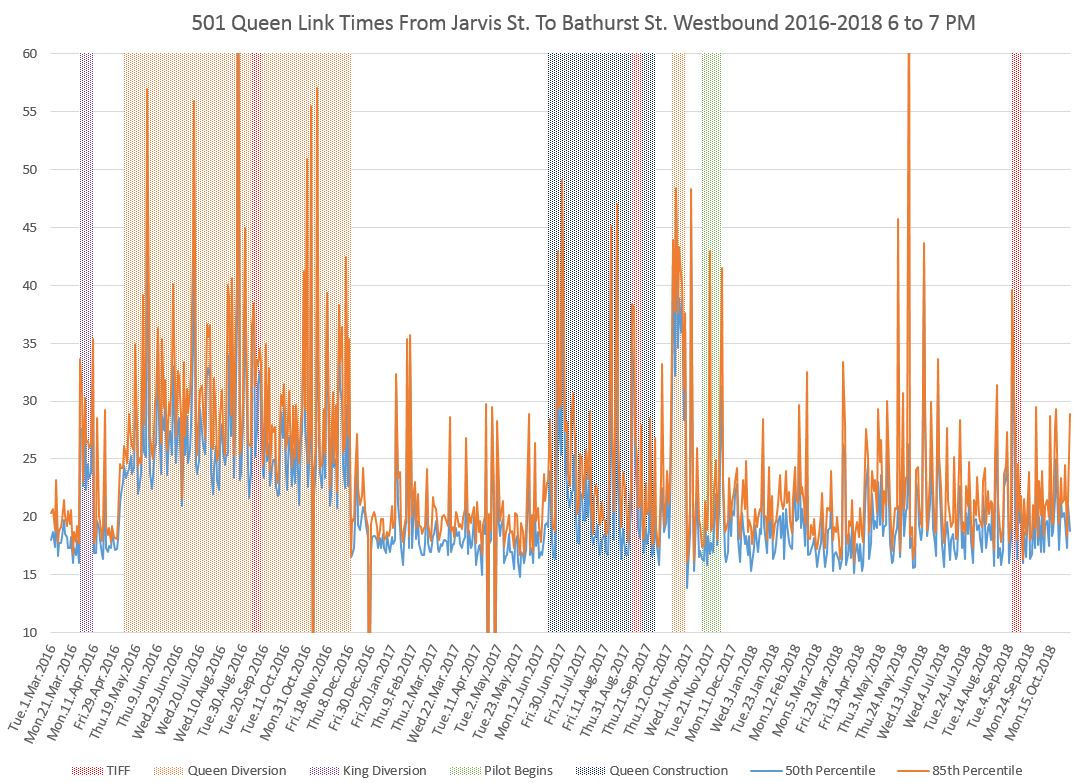
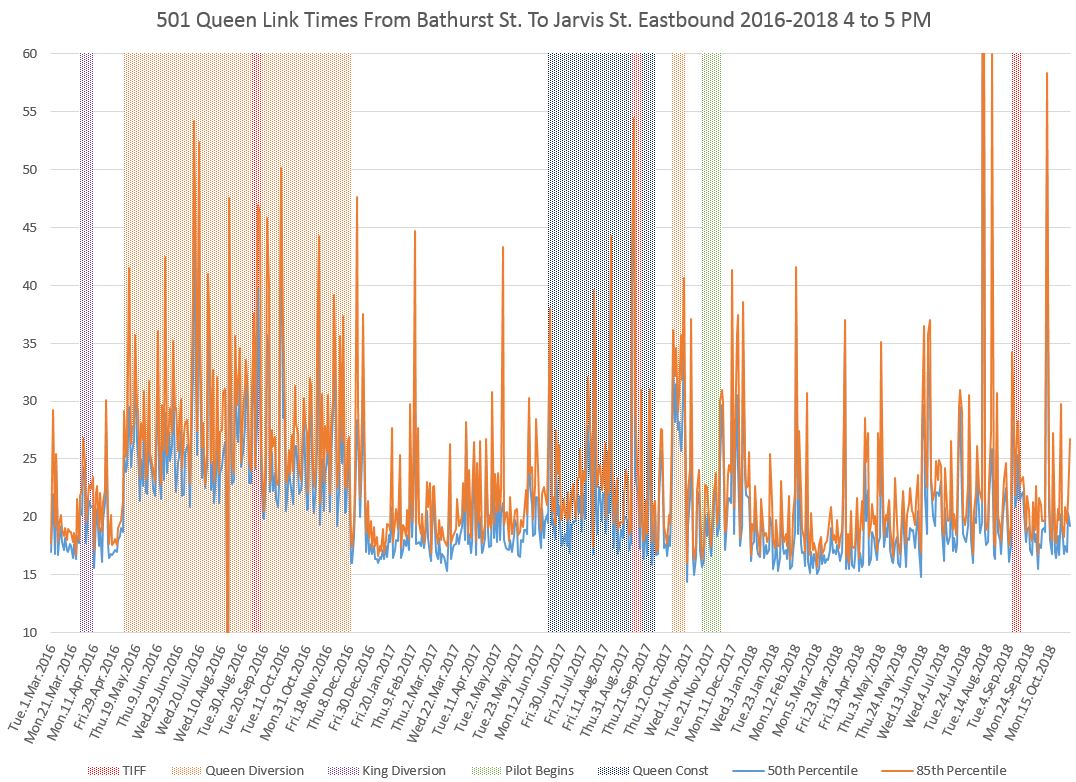
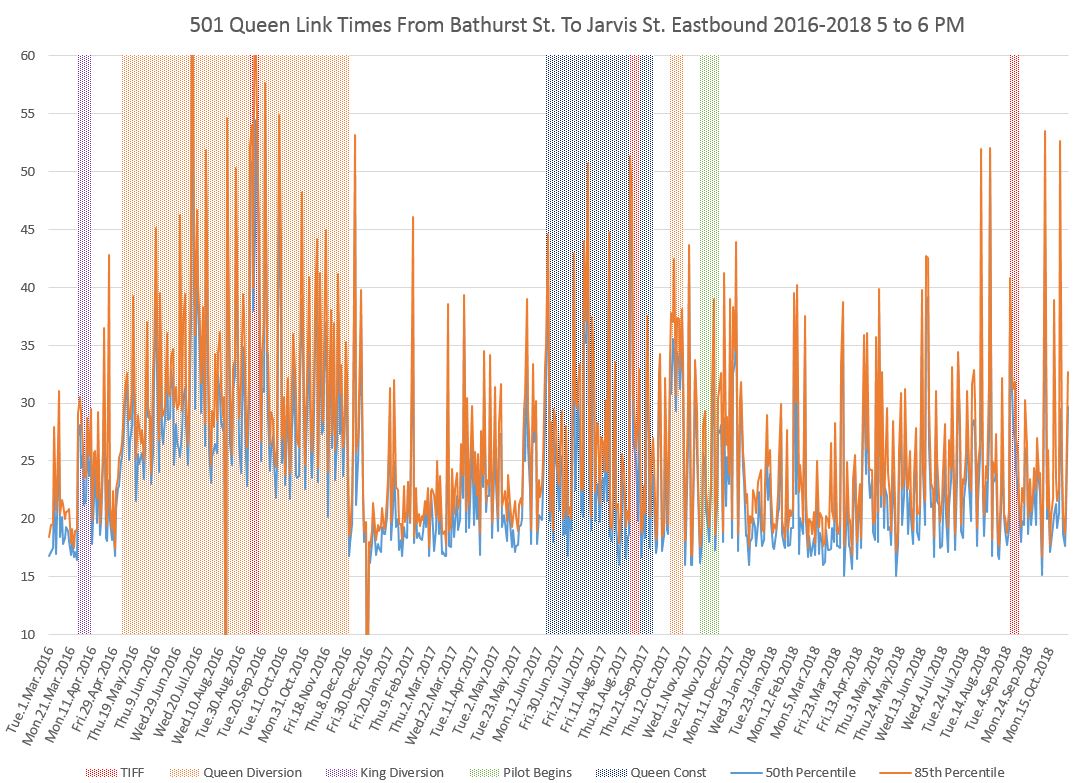
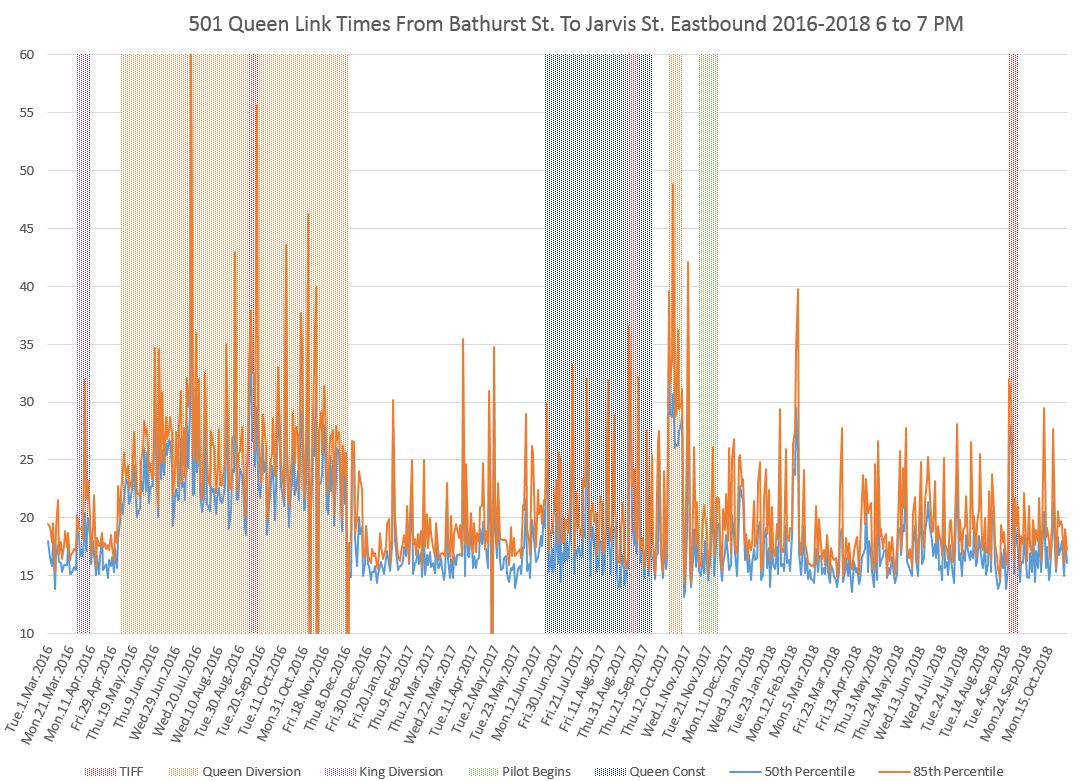
PM Peak Period 4 to 7 pm
Looked at over the three-hour period there is a substantial difference between the hours of 4-5, 5-6 and 6-7 pm showing a clear peak-of-the-peak effect in the middle hour.
At the height of the peak period, there is a considerable variation in the values from day to day both during periods with diversions or construction, and comparatively “normal” conditions. Although there is a rise after the pilot begins, this does not occur immediately and appears to be more the effect of December conditions. By spring of 2018, values have settled down to a similar behaviour to that of 2017.
Westbound

Eastbound
Late Evening 10 to 11 pm
By late evening, the effects of all changes, even the diversions, is much less than during the peak period. Also visible here, as on King but at a lower scale, is a regular “heartbeat” pattern corresponding to the busier conditions on Friday evenings.
Westbound
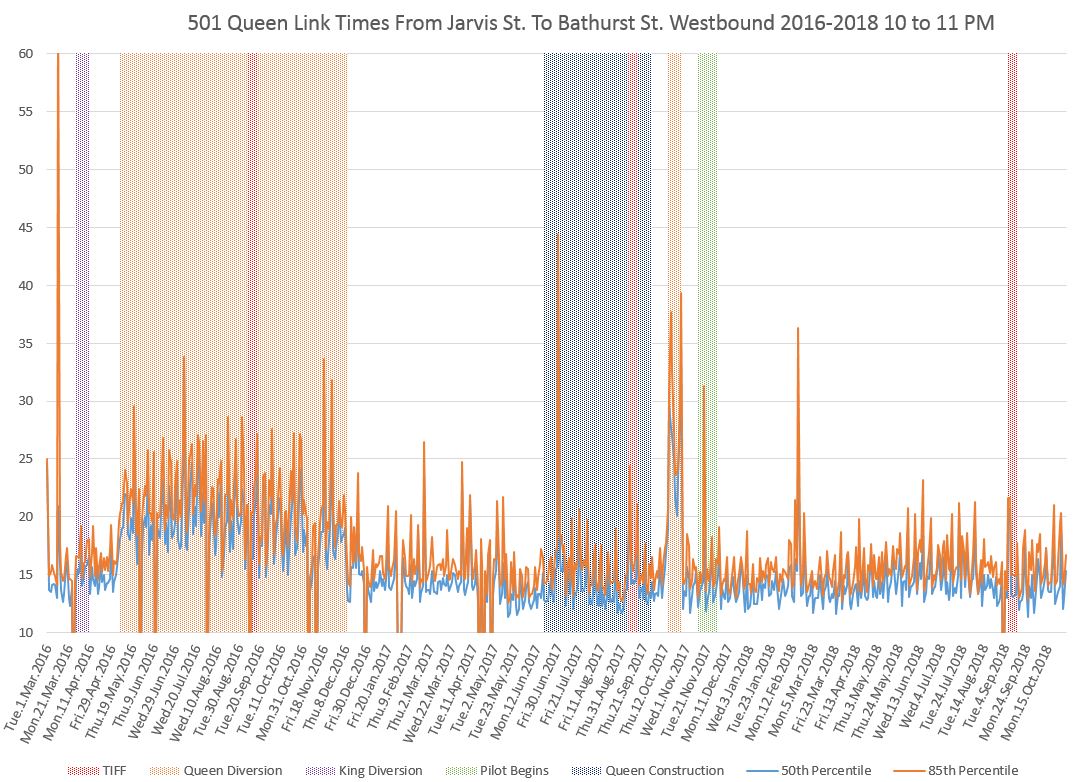
Eastbound
Full chart sets
October 2018
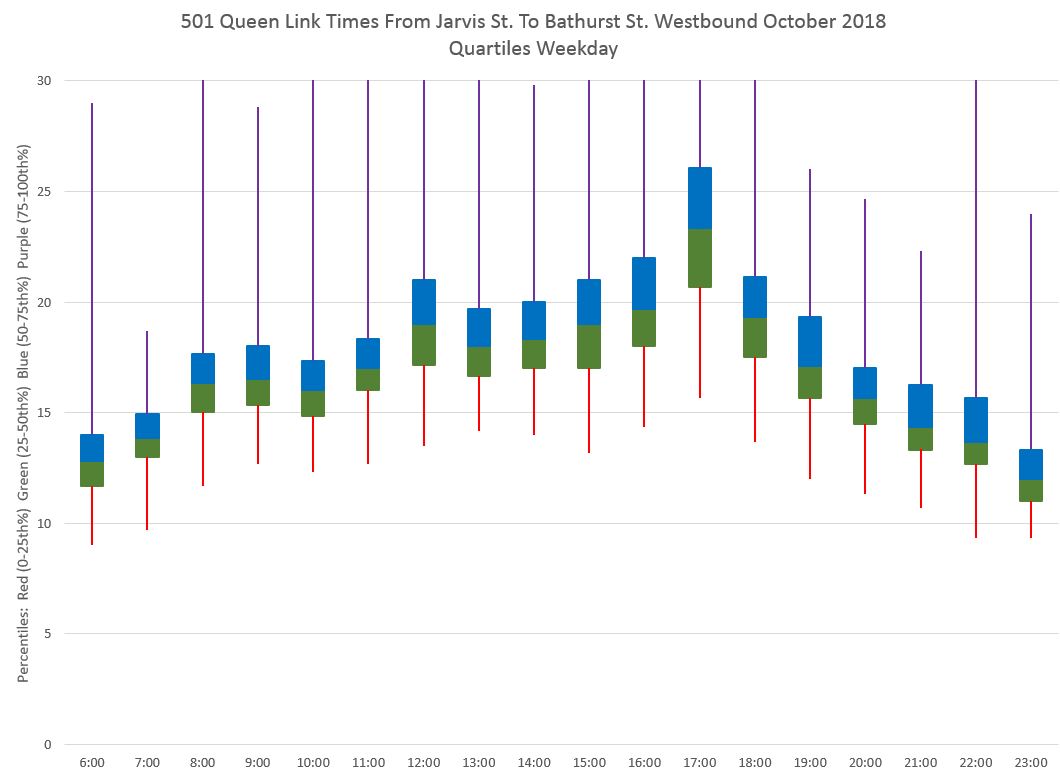
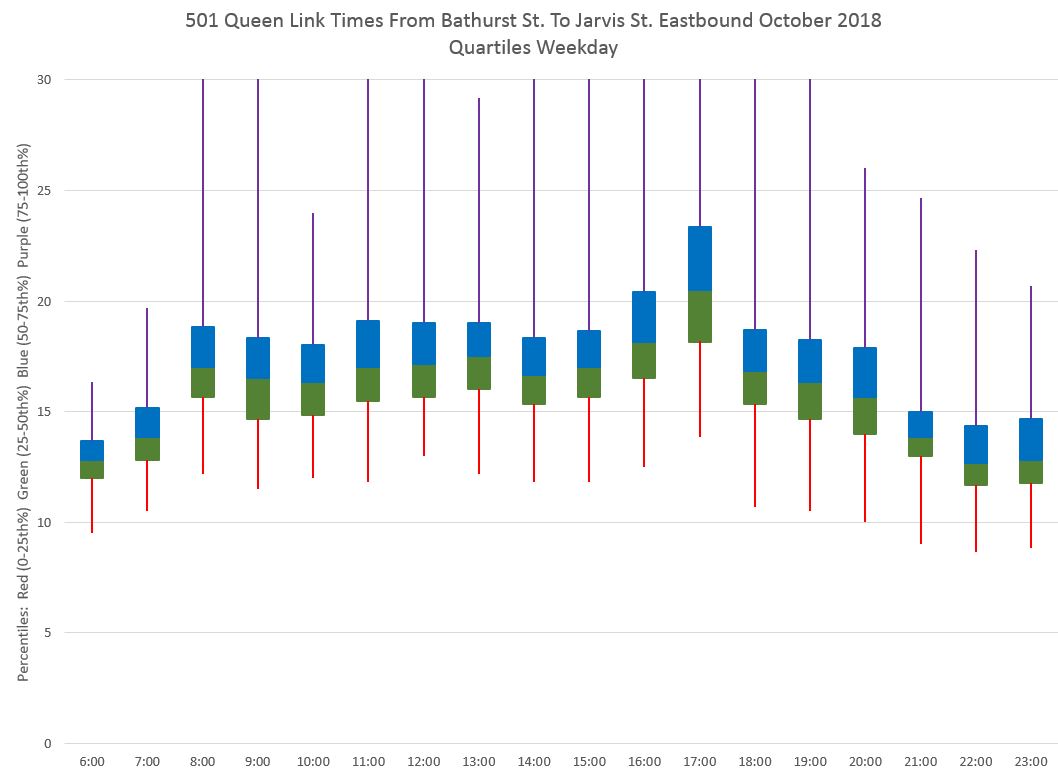
The charts below summarize the weekday data for the most recent month available by hour of the day. Weekly breakdowns are available in the PDFs linked following the charts.
The values are grouped by quartile with the two central groups, covering the 25th to 75th percentile, shown as green and blue boxes respectively. The ranges of outlying values are shown as lines extending above (purple) and below (red) the boxes. Ideally, what one would want to see is a small central box showing that half of the trips were made in a fairly narrow range of times, as well as short “tails” below and especially above. In practice, the upper values (75th to 100th percentile) range considerably above the central boxes indicating that on at least one day per month within most hours there was an extended travel time across the central part of the route. Looking at the week by week charts (in the PDFs), one can see that this does not apply to all hours within all weeks. Going down to the daily level would show even more detail corresponding to the peaks and valleys in the charts above.
Any detailed review of Queen Street, including proposals to expand the King Street Pilot there, needs to understand what is happening with the day to day fluctations in travel time and the type of event that causes this, especially the worst case peaks.
Week 2 shows a particularly bad set of values with the upper end of the 75th percentile box hitting the top margin at 30 minutes for the 12-1 pm hour (the 75th percentile value is actually 34 minutes, but this is clipped by the boundary of the chart). This was caused by one extremely bad day, Tuesday, October 9, when there was severe congestion westbound from Yonge to University during the midday.
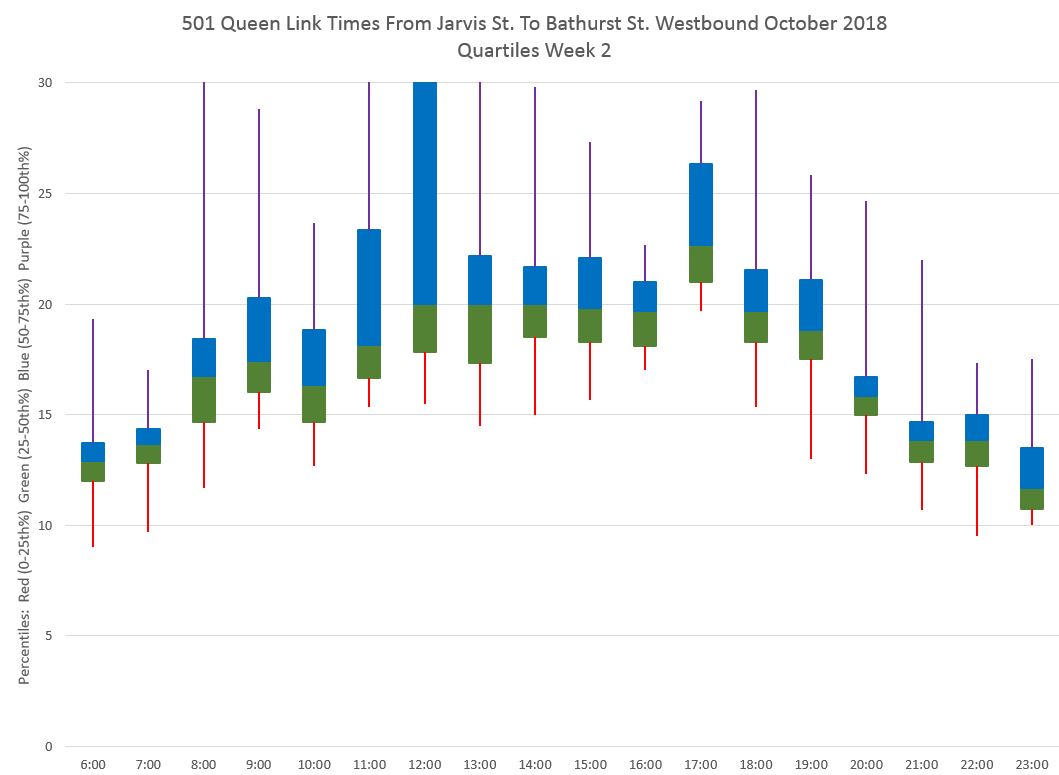
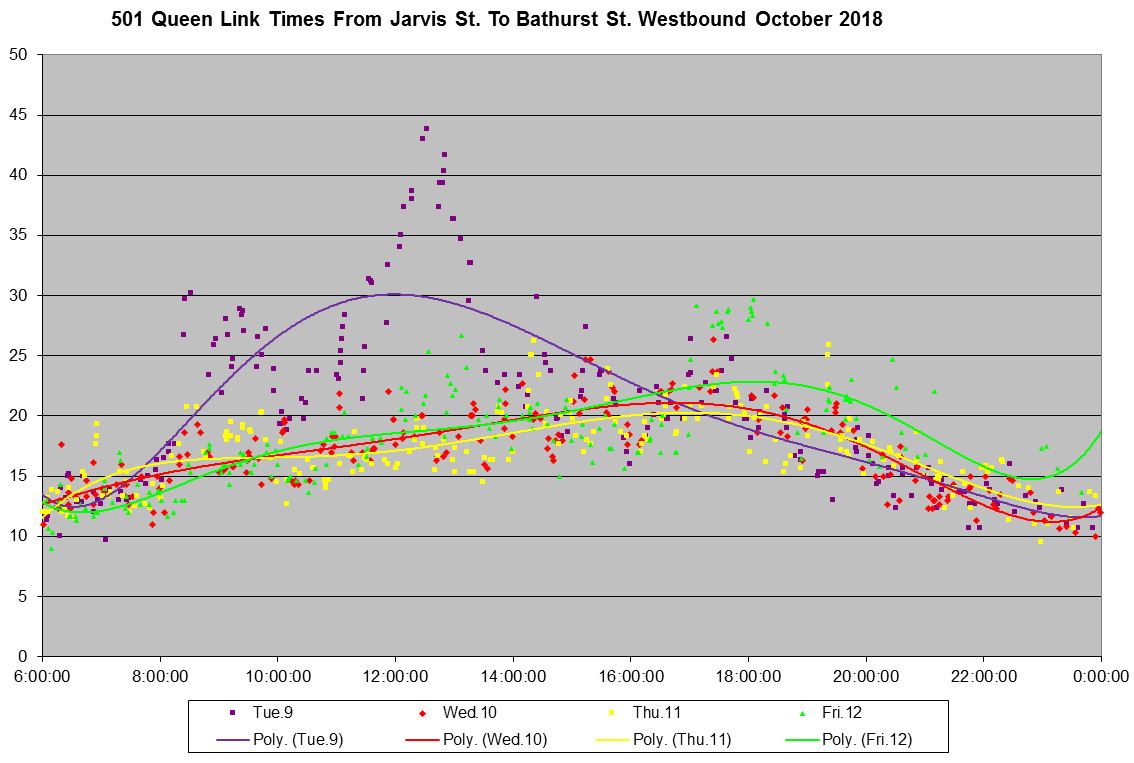
The moral here is to beware of summarization where details and variations can be masked by averaging. Riders travel every day and they experience the peaks and valleys. Someone viewing only the averages might conclude that things are not as bad as riders claim.
- 501_201810_JarvisBathurst_MonthLinks_QuartilesByWeek
- 501_201810_BathurstJarvis_MonthLinks_QuartilesByWeek
Comparing Travel Times on Queen and King Streets
A comment on this article prompted me to create charts tracking the median values of travel times across the pilot area for both King and Queen Streets. The data shown here are the same as in the earlier charts (they are built off of the same template) but with the following changes:
- Only the median (50th percentile) values are shown for each route to avoid clutter.
- 504 King data are shown in red, and 501 Queen in green to avoid confusion with the colour scheme used on the route-specific charts.
- The vertical scale is set to 30 rather than 60 minutes. This clips the very high values, but gives more clarity to the differences between the routes when values are close together.
The results, in some cases, are surprising.
Stop locations on the two streets vary from east to west:
- Jarvis Street: During the pilot period, the westbound farside King stop is “inside” the pilot area and the eastbound stop is “outside”. On Queen, the stops at Jarvis are nearside. Also, the stops on King are busier due to nearby residential and school populations.
- Church Street: Common to both routes.
- Victoria Street: On Queen only. There is no traffic signal on King.
- Yonge Street: With the nearside stops on Queen, streetcars can serve these busy stops while waiting for a red signal. Moreover, multiple (albeit shorter) cars can serve the stops at the same time.
- Bay Street : The same caveats about stop service time apply as at Yonge.
- York Street: On Queen only. King has a traffic signal, but no transit stop.
- University Avenue: The same caveats about stop service time apply as at Yonge. This is also a location where backlogs of north-south traffic can block streetcars, especially at King in the afternoon and early evening.
- John Street: Common to both routes.
- Peter Street: Common to both routes.
- Spadina Avenue: The same caveats about stop service time apply as at Yonge. During diversions, the left turns west-to-south at Queen and east-to-north at King bring delays because there is no transit signal priority for these moves. The reason for this is that the intersection geometry is such that detection of a car wishing to make the turn occurs after it has entered the intersection, not before.
- King has a stop at Portland, and Queen has a stop at August. Both have traffic signals.
- Bathurst Street: The eastbound stop on King is farside, and therefore is inside of the pilot area (the screenline is the middle of Bathurst Street).
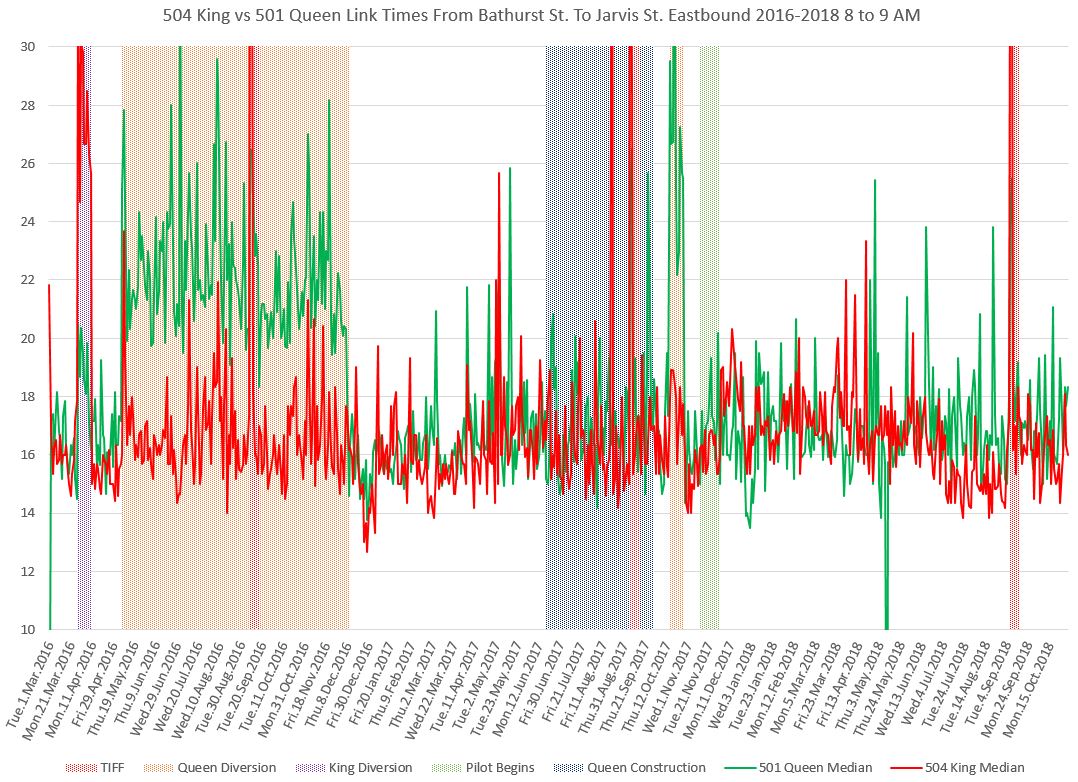
AM Peak Hour 8 to 9 am
The AM peak downtown is an area where traffic flows fairly freely on both King and Queen Streets in the absence of construction delays or diversions. The travel times across the pilot area do not differ much between the two streets, and Queen actually wins out in some cases.
The jump in 504 King times in May 2017 was caused by water main construction in the westbound curb lane. Eastbound data do not show a comparable jump in travel times.
The drop in 504 King times in July 2018 compared to 501 Queen coincides with the restoration of transit signal priority on King Street.
Westbound
Eastbound
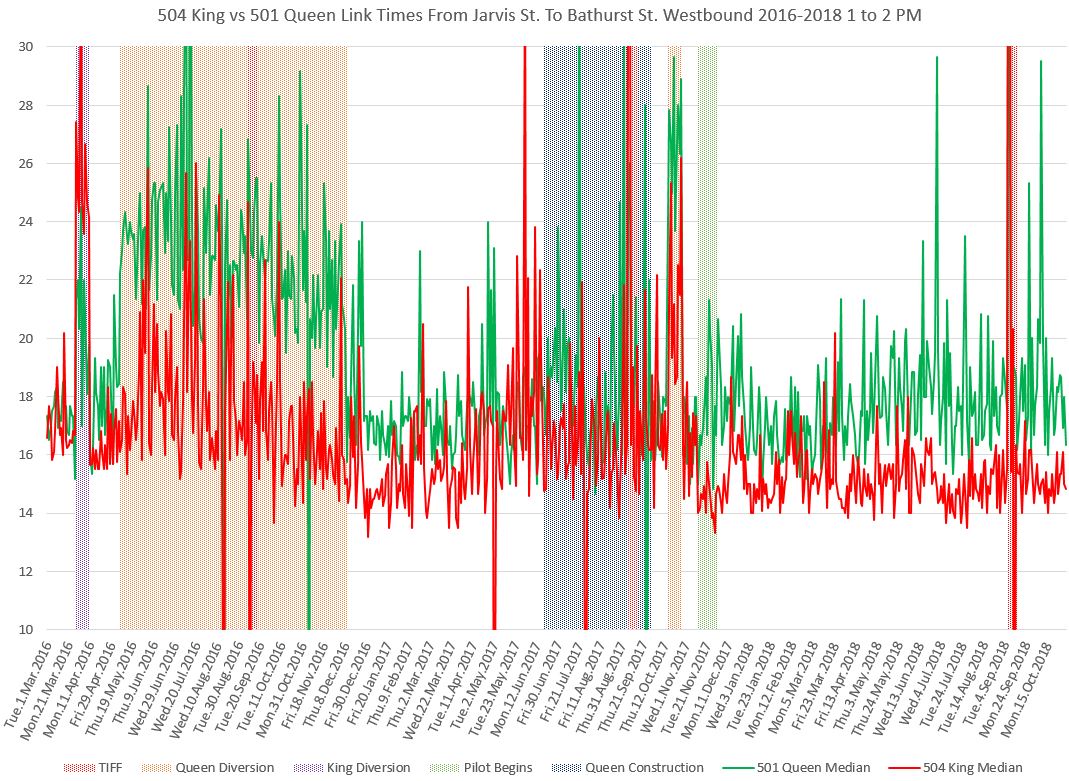
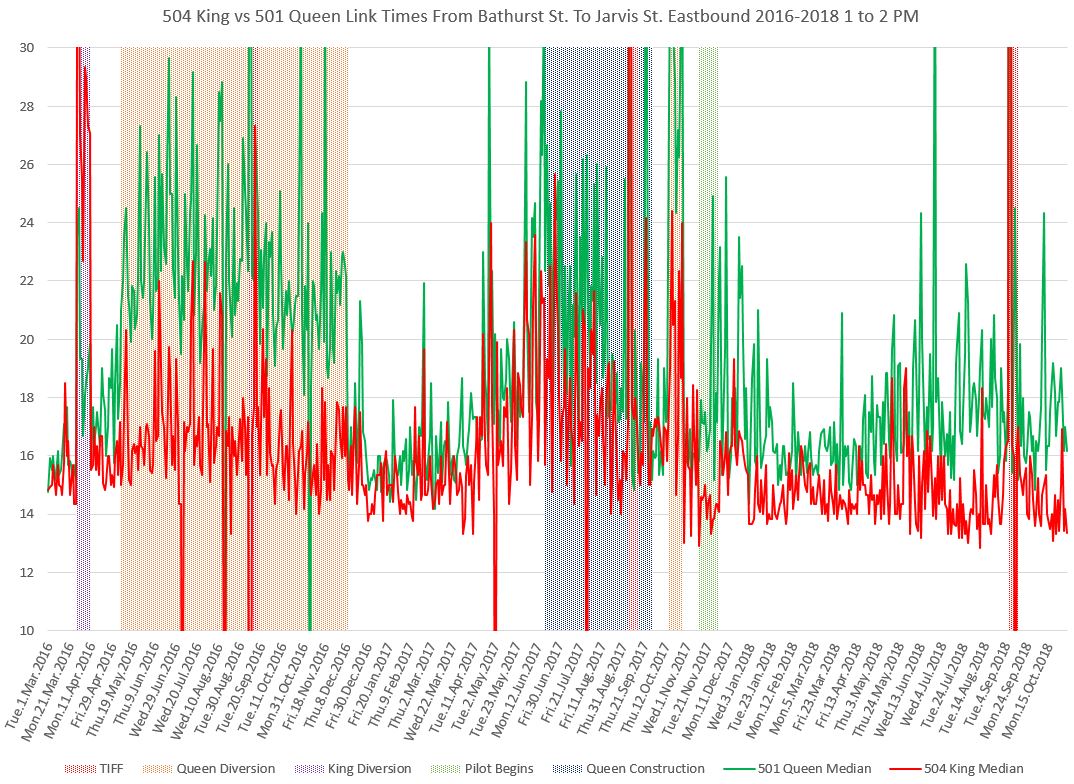
Midday 1 to 2 pm
By midday, the travel time advantage of King over Queen is quite clear. Although this existed to some degree even before the pilot began, the difference is greater with the pilot in place.
Westbound
Eastbound
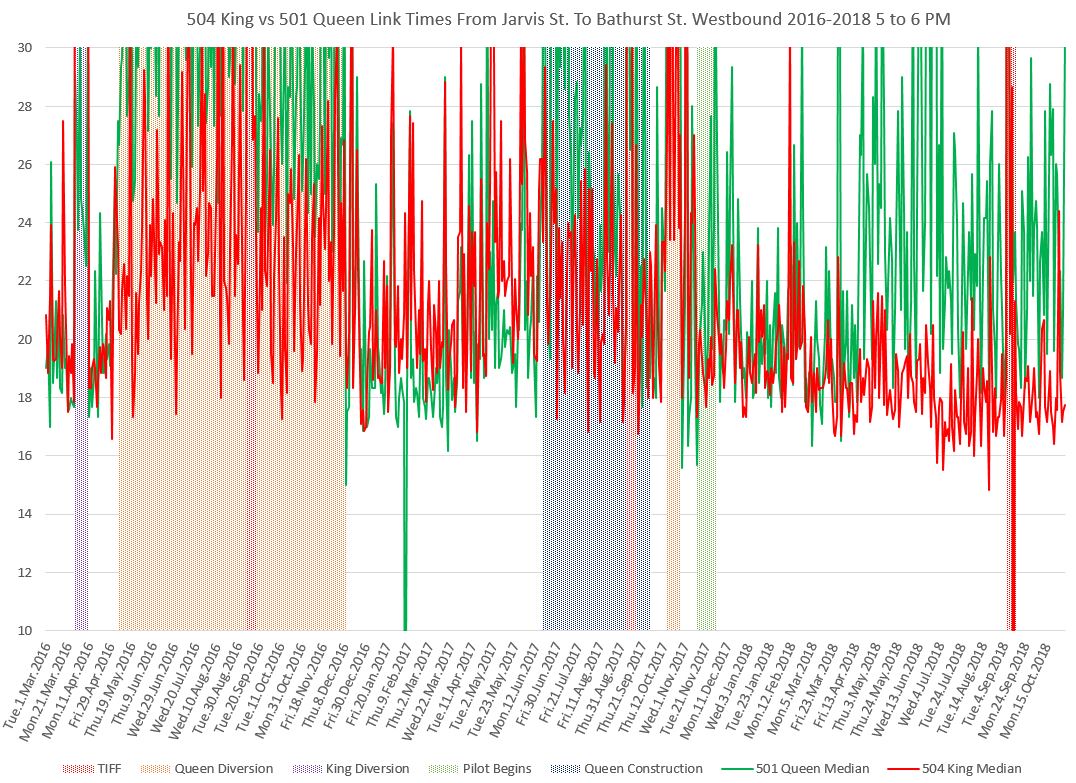
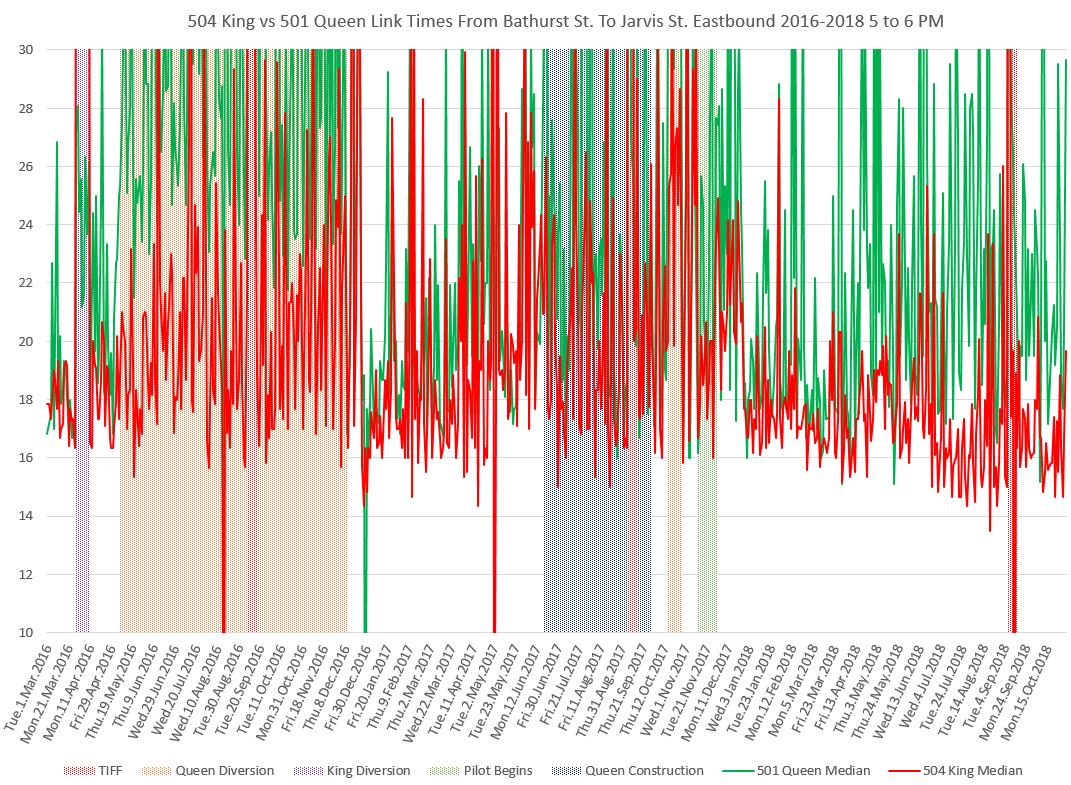
PM Peak Hour 5 to 6 pm
The PM peak hour shows a large variation in median values for both routes before the pilot, and this continues, particularly during the summer, on Queen after the pilot begins. These are median values, and the degree to which they bounce around shows the highly variable nature of conditions on both streets from day to day. Reducing this variation is a specific target for the King Street Pilot.
Westbound
Eastbound
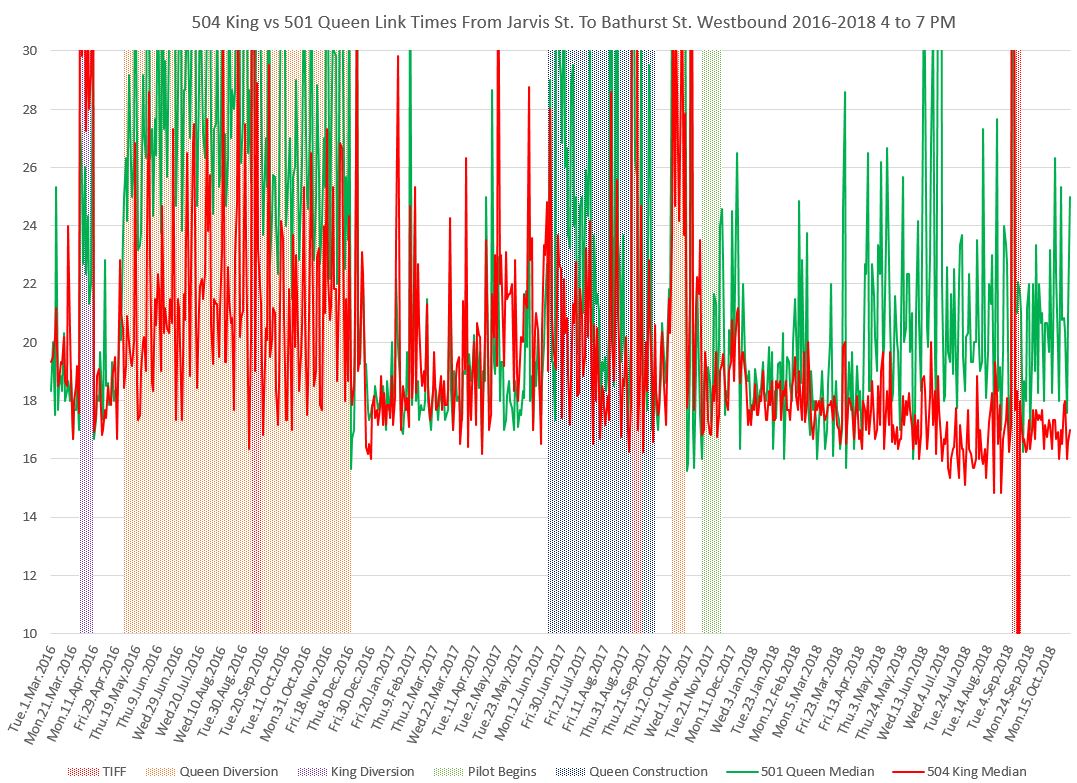
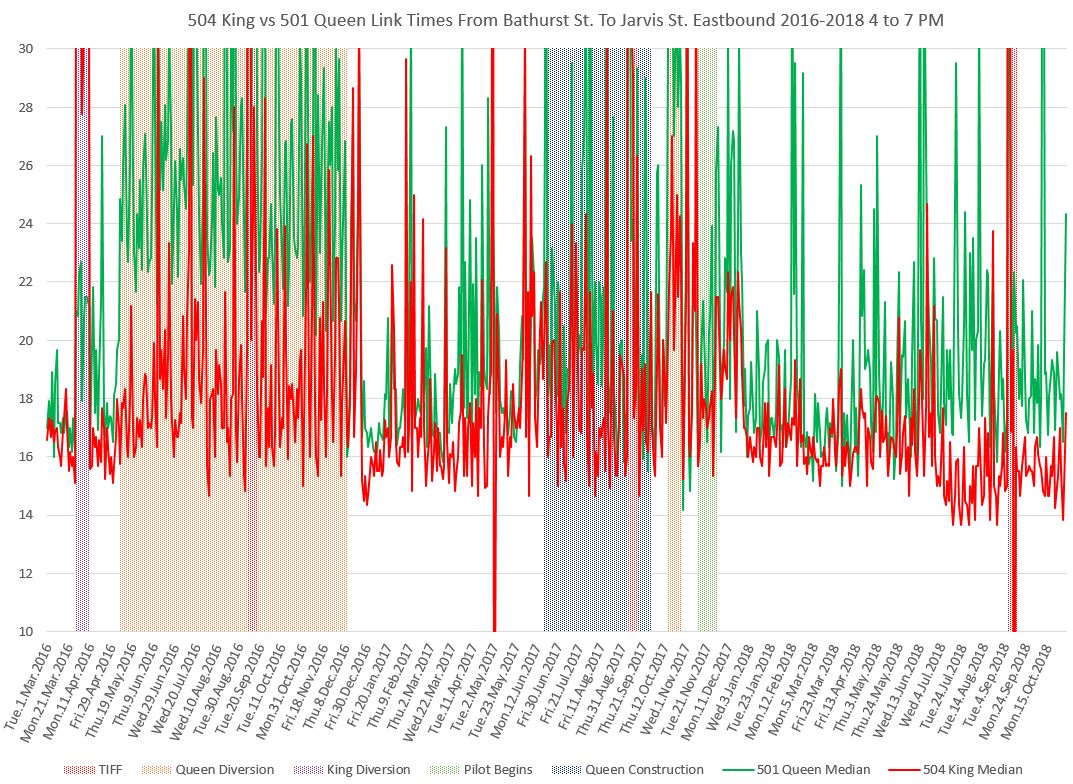
PM Peak Period 4 to 7 pm
Over the three-hour peak period, the benefit of the pilot on King shows up strongly especially with improved weather and higher activity on Queen. Comparisons with previous years are complicated by construction projects and diversions.
Westbound
Eastbound
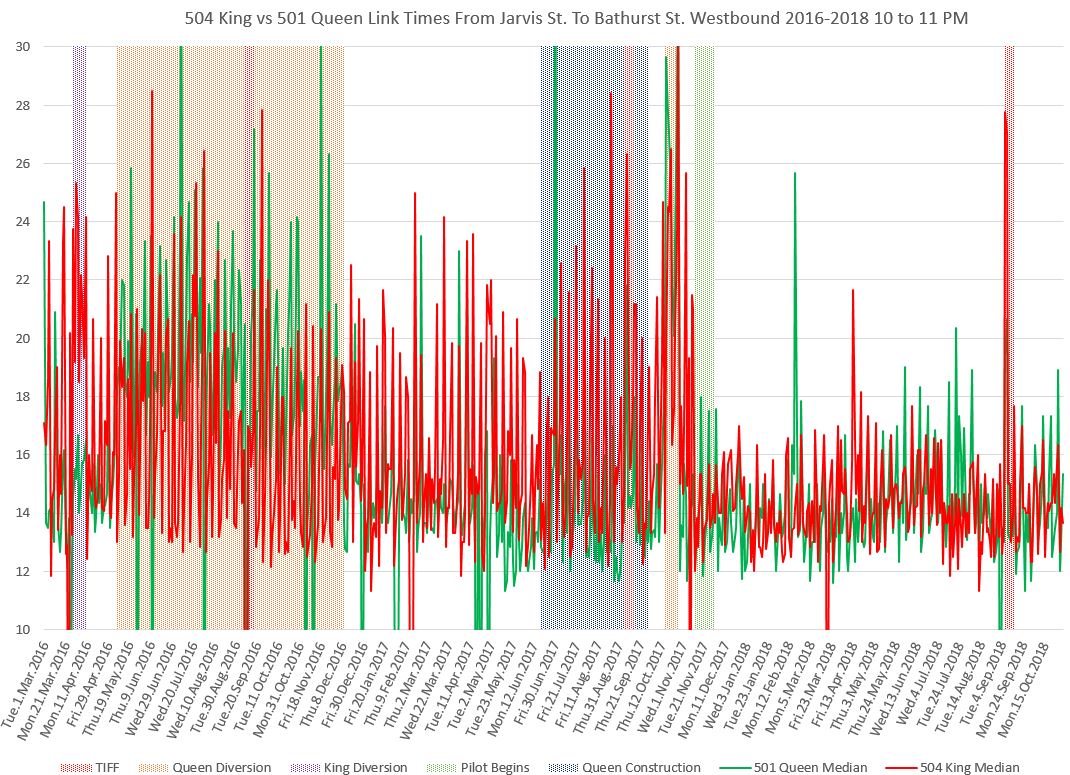
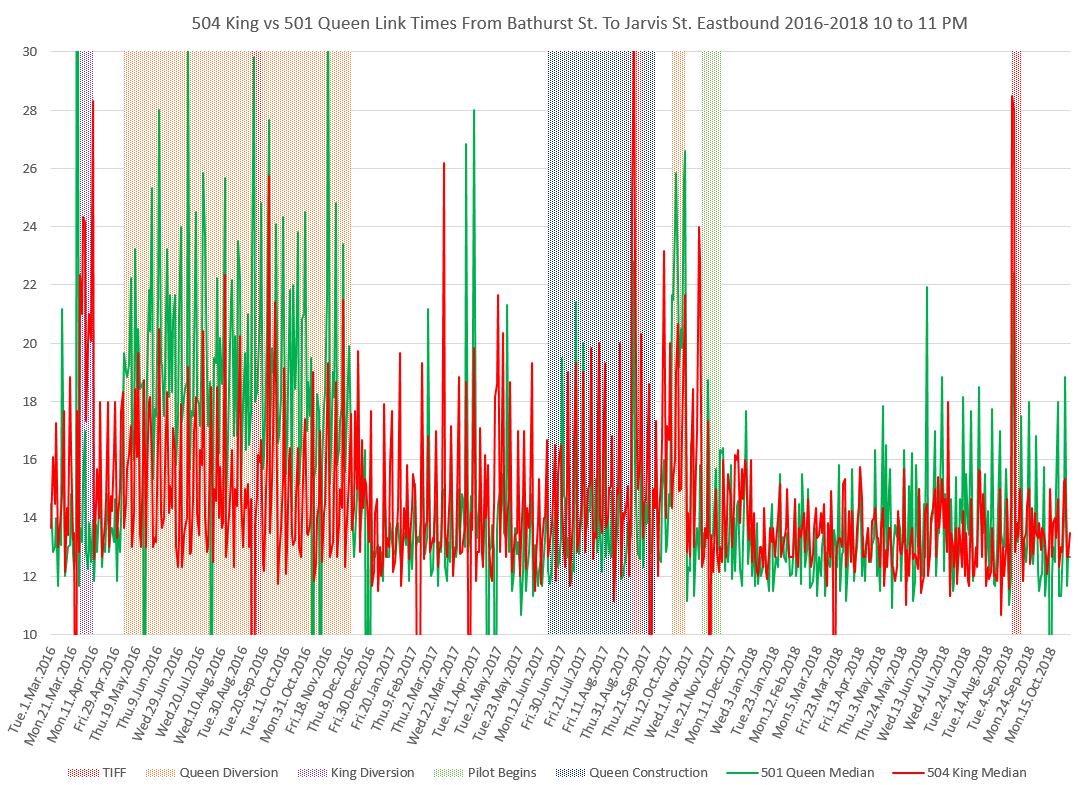
Late Evening 10 to 11 pm
The weekly spikes in travel times on busy Friday evenings shows up on both Queen and King, but the effect on King was usually higher before the pilot. The delays westbound tend to be worse on King, while Queen travel times are longer eastbound especially after the pilot began.
Westbound
Eastbound
Full Chart Sets:

A bigger change will be the 2019 reconstruction of The Queensway, west of Roncesvalles, and that intersection.
Too bad the TTC and the city will not be following the practices done when they rebuilt the intersection in the 1920s and 1930s, and still were able to run the streetcars (no buses). Too many single-occupant automobiles that get in the way these days.
LikeLike
Looks like all the concern trolls who “worried” that the King Street Pilot Project would cannibalize passengers off Queen Street were wrong. All those new passengers on King are just that: new passengers.
Which leads to the conclusion that expanding the Pilot to Queen would also result in passenger gains on Queen Street.
Steve: I am not sure your conclusion is valid. The quality of service on Queen is still demonstrably worse than on King with regard to headways, reliability and travel times.
However, if the travel times on Queen have not changed, irregular though they may be, then the diversion of traffic from King, if any, has not affected the Queen route. I suspect that the traffic has shifted mainly to Richmond and Adelaide Streets.
LikeLiked by 1 person
I have tried to compare Queen travel times with their King equivalents, but the charts don’t seem to line up for time spans very well. For instance, there are charts for Queen from 5 to 6 PM, but I don’t see them for King. Still, it looks like King is on average quicker, and way more reliable, than Queen now.
What I think would be interesting would be whatever conclusions we could make about the questions:
1. Prior to the pilot project, to get across downtown, at a given time of day, if you had a choice, should you try for King or Queen?
2. During the pilot project, are there any times you wouldn’t take King if you had the choice?
If expected wait times were thrown in, I’m sure King would have the advantage because of so many more streetcars allocated to the route, especially if you are only travelling within the central core part of King (east of Dufferin, west of Sumach).
Steve: The full chart sets for both routes are based on the same template and have the same collection of charts by time of day. Not all charts are included in the body of the text as illustrations. All of these are linked in the articles.
King Westbound
King Eastbound
Queen Westbound
Queen Eastbound
It is interesting that there are periods where westbound times for the two routes are similar (particular the median values), but King after the pilot begins has lower 85th percentiles showing less fluctuation day to day. Eastbound times for King are better even in the pre-pilot period. Looking at the same periods for each route shows that King generally wins, but the amount varies by time of day and season.
The point about wait times is important on two counts. First, scheduled service is generally more frequent on King. Second, King service fluctuates less and so the odds of landing in a gap while awaiting a car is worse on Queen.
LikeLike
Could a Queen pilot be conducted differently? Possibly parking one side only alternating every other main north/south cross street. Through vehicle traffic but just slower which can be avoided for long distance drives but all businesses can be reached. Possibly more off street parking even if necessary to demolish a few old buildings here and there.
Steve: It’s not that simple. Demolishing building for parking in an area where there are fights just to preserve the 19th century streetscape is really a non-starter. Parking is only an issue west of University. The larger problem is the absence of parallel streets to the north to absorb diverted traffic.
LikeLike
Interesting.
Hopefully they expand this pilot to Queen soon as well!
LikeLike
I think we need to sit back for a second and think carefully before extending the (excellent, in my opinion) King Pilot to other streets. From my observations, many problems with transit (and traffic in general) are caused by illegal parking blocking lanes, vehicles entering junctions they cannot leave and vehicles making turns and either blocking other traffic and/or being blocked by pedestrians. A major re-think like the King Pilot may (in fact seems to) work well on some streets but may not be necessary (or even possible) on others IF the City and the Police actually enforce the existing parking/turning and driving laws.
LikeLike
Where are those TRAFFIC WARDENS?
LikeLike
I haven’t driven in downtown Toronto in a long while but I had to go to Queen’s Park for and entire day, 7:00 – 16:00. I parked at city hall and left there at 17:40 after dinner. It took 10 minutes to go south on University from Armoury to Queen and another 7 minutes to go to Richmond. I went west on Richmond to Bathurst then south to King, another 20 minutes. King was fairly quick but the backup to go west on the Queensway was 4 or 5 blocks so I went north on Roncesvalles 2 blocks turned right and went south to Queen. There were 4 WB King cars ahead of me when I went across Queen and 3 were still there when I went by westbound.
There was a short turn Queen car as I went north and another as I came back after going around the block and an east bound car with no one on it so I believe 3 consecutive short turns. The line up at the WB car stop was 4 deep at least the length of a low floor car. I saw one low floor signed 501 but it was going east on King east of Shaw. Westbound along The Queensway I saw one EB 501 at the Kingsway crammed to the doors, none WB and none in the loop. Swansea does not exist for the TTC.
I came down Park Lawn and saw a WB 501 Long Branch with only 4 people, hadn’t been a real 501 at Humber for a while. I saw 2 501 Neville Park Buses EB on Lakeshore, one was crammed to the doors and the other was at 30th. The service seemed quite regular and the cars were picking up passenger both ways on the Lakeshore with fully seated to standing loads. Perhaps the old Long Branch ridership is returning with regular service. I don’t know if today was normal but I am not driving in for a Queen’s Park meeting again, GO train for me. I did not see one ALRV.
LikeLike