Analysis of Service on 60 Steeles West Part II: Travel Times

In the first section of this article, I reviewed the headways on 60 Steeles West which, to be charitable, are not particularly reliable, especially west of Pioneer Village Station.

In this article, I turn to travel times along the route and how they vary by time of day. The chart formats here are similar to those in the first article, with one change: the charts breaking data into quartiles have been changed so that each quartile has its own colour making them stand out better.

As with the headway data, the behaviour of the route is broken by timepoints or screenlines along the route. Where the headway charts showed the intervals between buses passing a timepoint, the travel time charts show the time taken between these points, organized by time of day so that the rise and fall is clearly seen.

Here are the charts for westbound travel from Finch Station in April 2018. The first page shows the route between Finch and Pioneer Village Stations. It is no surprise that the biggest peak period effect falls in the afternoon for westbound travel.

The first section of the chart below shows the time taken at Pioneer Village Station by buses that are continuing through to the west. The segments from Jane to Weston Road, and from Weston Road to Islington also show the effect of PM peak congestion.

Worth noting is that some of the peaks are fairly broad with longer travel times showing up well before the “peak” hour in the early afternoon. This means that any move to provide better transit priority must address a wider period than an hour or two traditionally thought of as the “peak”.

This chart shows the last segment from Kipling to the east side of the loop west of Highway 427 via Signal Hill and Steinway. Note that Steinway is the eastern limit of the on-street loop, and times are measured just east of this location so that terminal layovers are not included in travel times. There is no evening service here.

The route’s behaviour eastbound in a few ways notably that there is less of a peak effect in the AM eastbound direction that in the PM. However, from Kipling to Islington there is a marked rise in travel times for both AM and PM peaks.


The full sets of charts are linked below.

Continue reading

Analysis of Service on 60 Steeles West Part I: Headways

This article begins a series of reviews of major bus routes in suburban Toronto based on vehicle tracking data from October 2017 (before the subway extension to Vaughan opened) and April 2018. It includes charts showing the behaviour of headways (the times between buses) and travel times in a way that consolidates more information in an overview of how these values change by time (through the day) and along the route.

Many thanks to readers who contributed to the discussion of improvements in how these data are presented. For those interested in the underlying methodology of digesting the TTC data, please refer to this article.

Data for fall 2018 operations are not available because the TTC is in the process of shifting their vehicle tracking to a new system (“VISION”) and do not yet have a data extract tool to provide the kind of archival data I have been using for these analyses. Discussions about how this will be done, including the possibility of an Open Data Portal, are in progress. Buses which have converted to the new system do not appear in the data I receive from the old “CIS” system.

This article deals with headways, the time between vehicles. In Part II I will turn to travel times.

Headways and Service Reliability

A major issue for transit riders is the dependability of service. On most routes, the scheduled frequency is good enough that “on time” is a meaningless concept, but regular spacing between vehicles will guarantee that the typical wait is fairly short and predictable. If service is supposed to be 10 minutes or better, but just missing a bus could cost someone a 20 minute wait, for that rider the concept of a frequent service network rings hollow.

For its part, the TTC only measures service quality at the ends of routes, and then only against the schedule on the premise that if vehicles are on time, regular spacing will take care of itself. This simplistic view ignores the real world of transit operations and presents a rosy picture of service compared to actual experience.

For reference, here are the scheduled levels of service on 60 Steeles West during the months covered by this article [click to enlarge]. Both before and after the opening of Pioneer Village Station on the north side of the York University campus, the route operated with three branches:

  • a local service from Finch Station to York U/Pioneer Village
  • a local service from Finch Station to Highway 27
  • an express service from Finch Station to York U/Pioneer Village (peak periods only)

The level of service during peak periods on each of these is almost identical before and after the subway extension opened.

Continue reading

TTC Service Changes Effective November 18, 2018 and December 23, 2018

The TTC will only make a few changes to its schedules for the November and December board periods.

November 18, 2018

Express Service Rebranding

Five routes will be rebranded into the new 900-series of Express routes. In all cases there is no increase in service, only a change in the route number.

  • 41E Keele express becomes 941
  • 95E York Mills express becomes 995
  • 131E Nugget express becomes 903, and will interline with 131 “local” service between STC and Old Finch.
  • 188 Kipling Rocket becomes 944 Kipling South Express.
  • 192 Airport Rocket becomes 900.

It will be interesting to see how long the 192 route number will live on in TTC maps to confuse the tourists.

Construction Changes

Work at Bathurst Station will be complete and the bus routes will resume their normal platform assignments.

Work at Kennedy Station will be complete to the point that routes normally on the north side of the bus terminal can use their regular bays.

Service Changes

One additional gap train will be scheduled on 1 Yonge University during each of the peak periods to fill service gaps.

Service on 505 Dundas (still operating as a bus route) will be rescheduled to remove some of the excessive running time with reduction of scheduled vehicles in some cases, and service improvements in others, notably Saturday evenings.

Service on 511 Bathurst (also still operating as a bus route) will return to the split version with a short turn at Front Street.

81 Thorncliffe Park will be changed so that it circles Thorncliffe counterclockwise at all operating hours rather than changing direction at 3 pm. The official “end of the line” will be moved out of the loop to Thorncliffe and Overlea so that passengers do not sit part way around the loop while the bus waits for its time. This will improve transfer connections with other routes on Overlea.

Weekday Run As Directed service will be reallocated as weekend Standby and Service Relief for the November-December shopping season including Sunday, December 23 (which is technically part of the next schedule period).

Other minor changes are listed in the details linked below.

December 23, 2018

For the two week holiday period, the usual arrangements will apply with many routes reverting to summer schedules.

No subway construction buses will be scheduled as there are no planned shutdowns during the holidays.

Late night service will be operated on most routes on New Year’s Eve. There has not yet been announcement about a sponsor for free service.

[The table linked here was corrected at:

  • 11:15 pm on October 20, 2018 to reflect that the Keele express buses terminate at Finch West, not at Pioneer Village, and at
  • 10:00 pm on October 21, 2018 to specify (a) articulated buses on the 41 Keele local service and (b) to include “before” figures that had been omitted.]

2018.11.18_Service_Changes

Where Have All The Riders Gone?

TTC ridership has been static for the past few years, as set out in the October 2018 CEO’s Report. Year-to-date ridership is down 3.2% compared to budget and 2.0% compared to 2017.

This is attributed to several factors:

Ridership has flatlined since 2014 due to various factors, including congestion, changes in customer mobility, and growth in digital ride-hailing services.

Another important factor that has adversely impacted ridership is the ongoing decrease in Metropass sales, which currently generate approximately 40% of total ridership. Specifically, there were 163,000 (-7%) fewer passes sold between January and August 2018, compared with the corresponding months in 2017. Although some of these lost sales have likely been offset by an increase in PRESTO e-purse transactions, the declining Metropass sales continue to have a significant impact on overall ridership trends. [p. 19]

The statements here present many factors, but do not attempt an analysis. One vital and missing component in the list is the question of service quality and capacity. If people cannot get on their bus, streetcar or subway train, or if the service is unpredictable enough, they will use transit as a matter of last resort, not as a first choice.

The entire concept of a monthly pass was to remove the incremental cost of taking another trip, something which (at least back in the late 1970s when the debate raged over whether Toronto could have monthly passes) was an important factor. Fares are still an issue, but service is a troubling component too.

The note about declining Metropass sales requires some explanation. The TTC, through user surveys, estimates the number of trips taken by the typical passholder in a month, and this sits at about 74. For every 100,000 passes they sell, they count 7.4 million trips. Obviously, the number of trips each passholder takes will vary, but things will average out. For example, in the first week of July when, by chance, I was part of the survey sample, I took 27 trips (and that’s counting a “trip” by the transfer rules then in effect). That translates to over 100 trips/month. The trips/day varied from a low of 2 to a high of 7. It was a busy week, and I made one or two round trips from home, plus a few stopovers, on the busiest days. If I had counted on the basis of the two-hour transfer, the “trip” count would have been close to 20 factoring out the stopovers and a few quick there-and-back-again round trips.

Because each Metropass sale translates to so many trips in the stats, the loss of a sale has a big effect on the total TTC numbers. However, the people who “fall off” the Metropass group are likely to be those whose usage was borderline break-even and for whom convenience of a flash-and-go card had a value in its own right. Presto eliminates that value, and it would be no surprise to see many passholders switch over. The actual trips lost to the TTC are, for these riders, fewer than the average Metropass usage.

The trips/pass for the remaining sales should go up if the low end of the market shifts to Presto, but it is not clear whether the TTC adjusts their multiplier frequently. The “lost” riding could be as much an effect of overcounting the lost pass sales (and associated trips), as it is a real decline in system usage. This problem will become even trickier with the two-hour pass available through Presto where trips that used to count as two (or more) fares will now only count as one.

Meanwhile, in response to the falling numbers, the TTC has plans:

To re-establish sustained ridership growth, a new Ridership Growth Strategy (RGS) is being implemented. RGS initiatives include implementing a two-hour transfer on PRESTO and relieving overcrowding on surface routes.

Research is also underway to analyze the changes in monthly Metropass sales and corresponding ridership impact. [p. 19]

If one goal of RGS is to relieve overcrowding, then it is clear that at least part of the system needs more service to handle demand even while official “ridership” is not growing. There may be routes with falling ridership, but even they must be viewed with caution lest the fall be the result of irregular or even reduced service.

Indeed, if there are overcrowded routes, why does the TTC not publish a list of routes, periods and locations where crowding is a problem that cannot be addressed without more capacity? Toronto cannot begin to talk about attracting new riders if it does not provide enough service to carry those who are already trying to use the system, or even understand the scope of the current system’s shortfall.

The two-hour fare will accentuate the split between the trend in “fares” (considered equivalent to “ridership”) and boardings on vehicles. (A “boarding” is one passenger getting on one vehicle, and each transfer counts as a new boarding, except on the subway which is considered one route for this purpose in TTC stats.) This will add to the confusion between apparently falling “ridership” and system crowding.

It is no secret that the TTC is capacity constrained. Although the bus fleet is now more reliable than ever thanks to better maintenance and the retirement of old clunkers, the actual size of the fleet is not growing because there is no place to put any more vehicles. Expansion plans are limited, as I have written before, and this is a major problem for the TTC’s future. On the streetcar fleet, new cars are gradually replacing old ones, and on close to a one-for-one basis bringing greater capacity to King Street this year, and to Queen in 2019. Subway capacity will not improve until early 2020 at best on Line 1 YUS, and 2026 or later on Line 2 BD.

Even the new Express Bus network has limited benefit because so much of it simply rebrands service that already exists rather than making a real improvement in what riders experience. Of the changes to date, the most striking has come on 29 Dufferin, but on many routes the service is identical to, or only a slight improvement on, the old “E” branches that are now 900-series routes.

The TTC has research underway on the effect of pass sales on ridership numbers, but this potential effect of the Presto migration was hardly unknown. If anything, the TTC has been derelict in placing so much focus on “ridership” while ignoring the basic question of service quantity and quality.

Former CEO Andy Byford set a management goal for a reduction of short turns and an improvement in on-time performance. This triggered various responses:

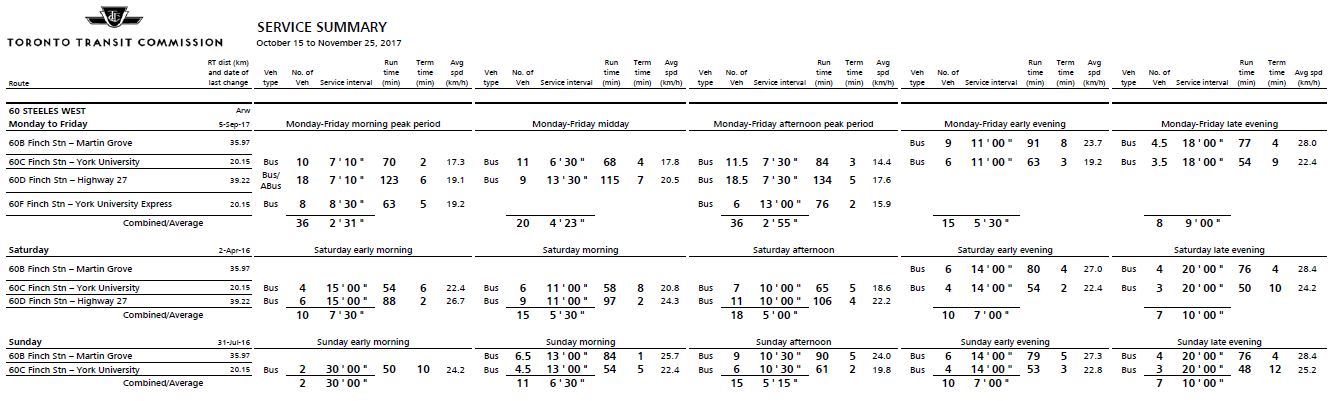
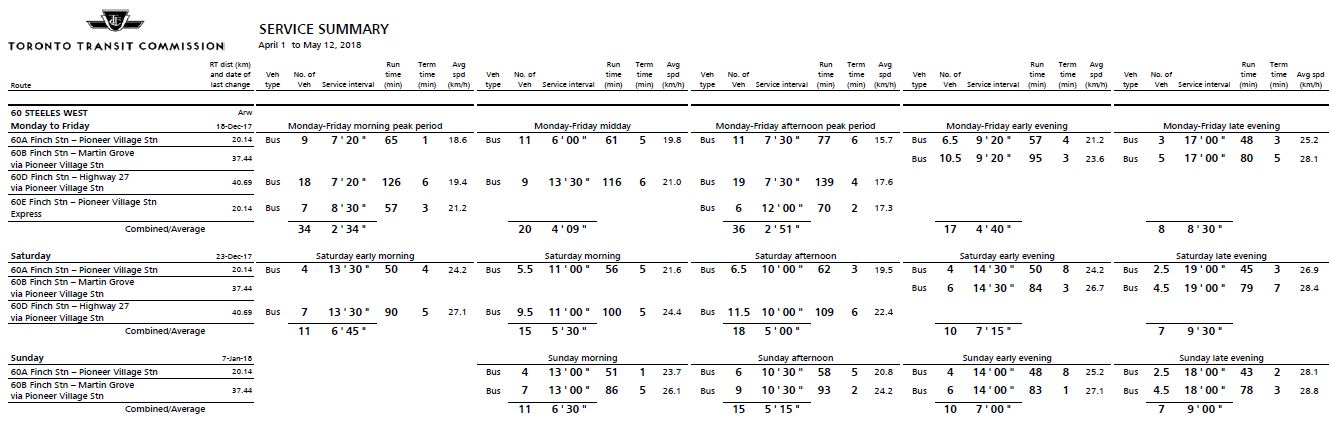
  • On some routes, scheduled running times were inadequate to actual conditions, and short-turning was inevitable. Running times were lengthened (and service was often scheduled less often to stretch available vehicles to match longer trips). However, in some cases the padding has been excessive leading to dawdling vehicles enroute and queues of buses and streetcars that arrive early at terminals.
  • When even padded schedules didn’t eliminate short-turns, the edict went out “thou shalt not short turn”. This can be counterproductive because there are cases where short turns are needed, but simply are not done and vehicles remain in a pack following a long gap.

The matter of “on time performance” is a blatant case of cooking the metrics to make management look good.

  • Previously, the TTC measured “on time performance” at various locations along routes. The results were not pretty.
  • The metric was changed to look only at terminal locations on the premise that service which is on time at the start of its trip will remain so as it moves across the city. Alas that is not so.

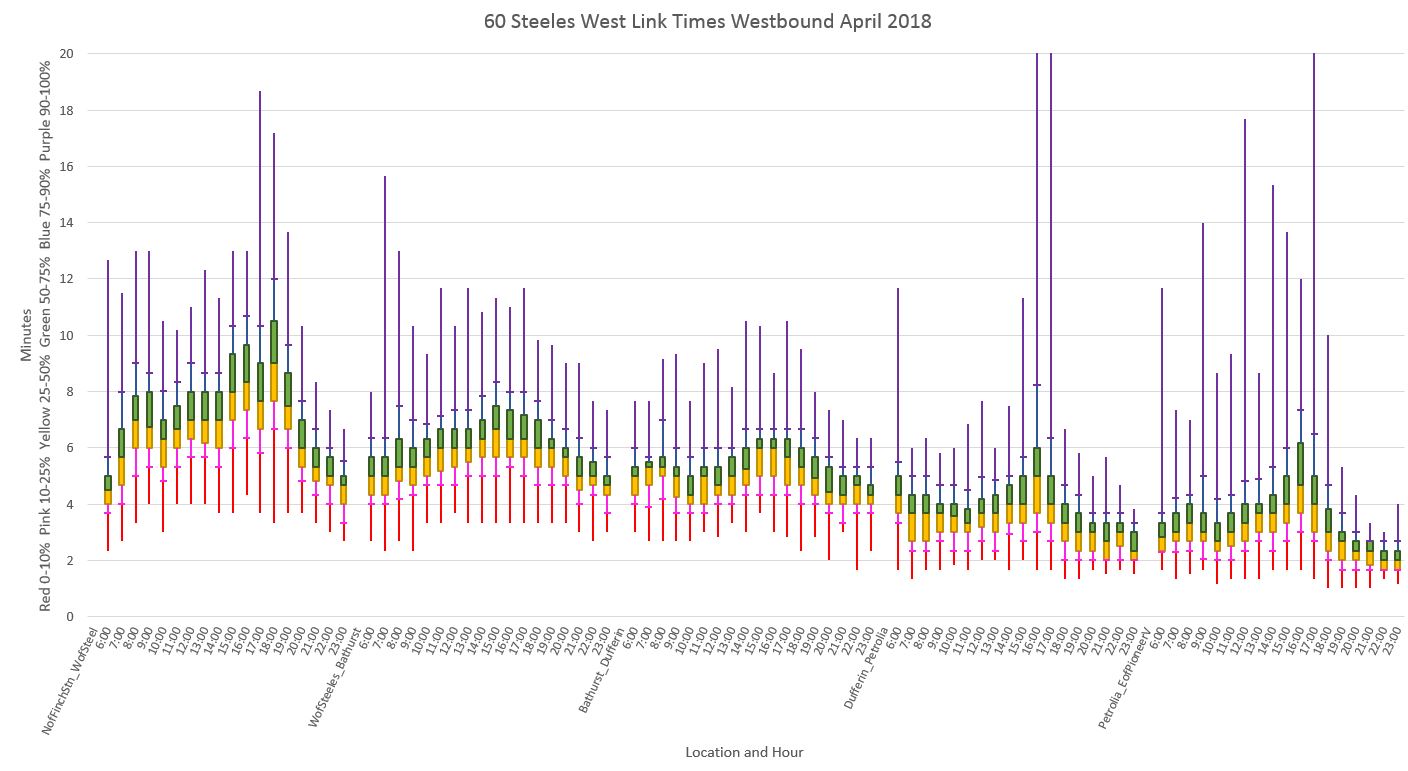
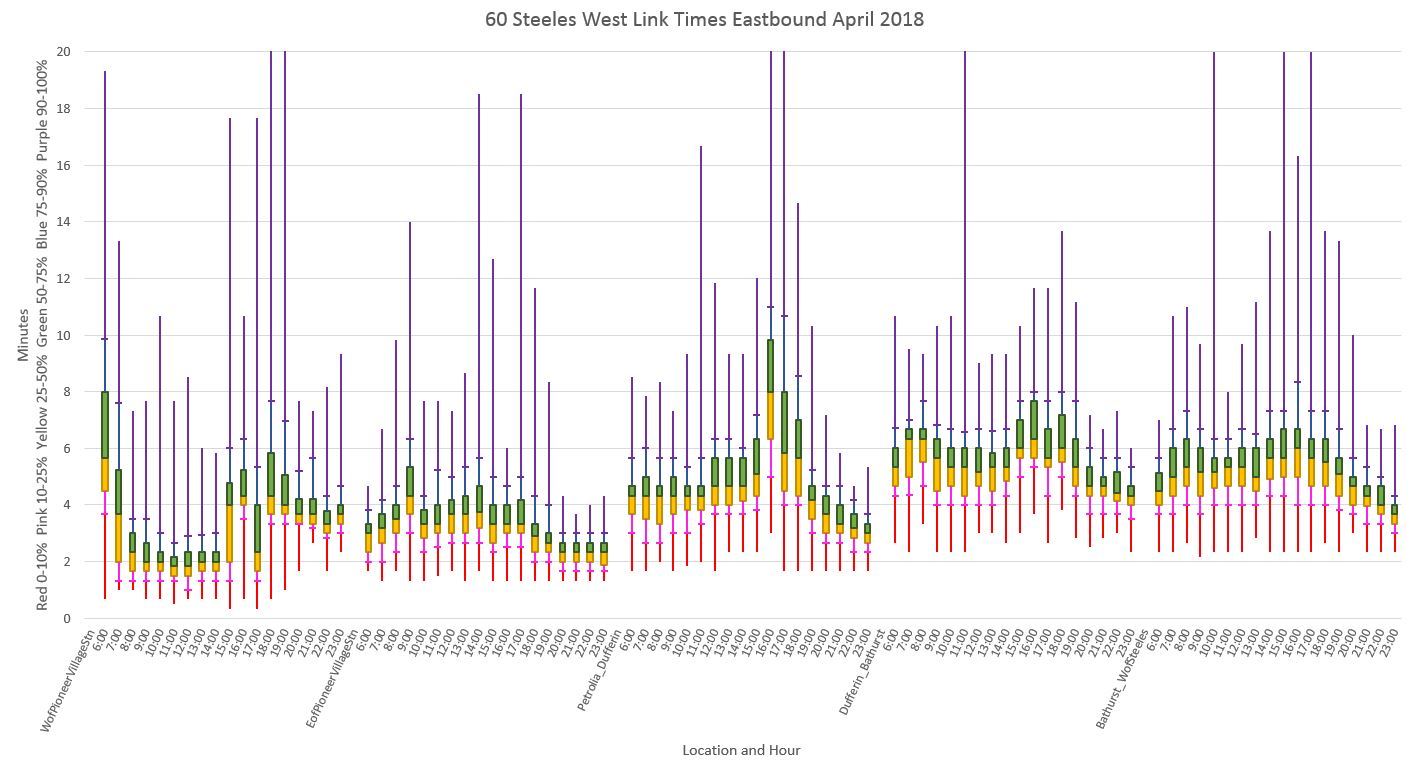
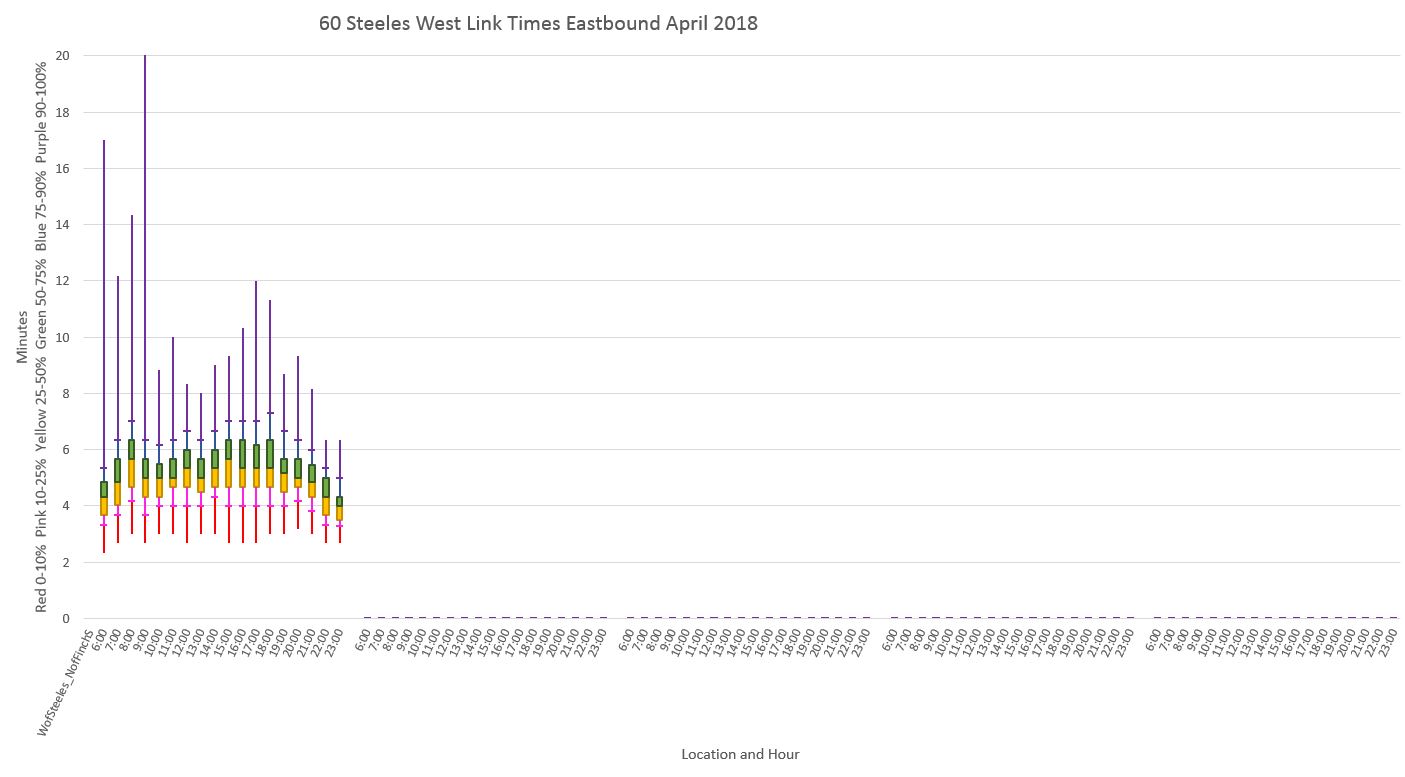
As we will see in a series of articles I will start publishing in coming days, there is a common problem on many routes that service may begin with vehicle spacing that is close to “on time”, but it takes only a short distance along a route for vehicles to catch up to each other and run in pairs or triplets. A further issue is that the TTC considers a bus or streetcar “on time” within a six-minute window, and this is meaningless for the frequent service on major routes. Because the service quality goal is only measured at the terminal, the actual reliability seen by most riders (who board elsewhere) is considerably worse than the values management reports.

For its part, Council looks at ridership numbers, sees a system that is not growing and says “why should we give you more money”? When added subsidy does come, it is as likely to go into fare reductions as to service growth, but lower fares are cold comfort if a rider cannot rely on transit for a timely and comfortable journey.

TTC Modifies Transition to Presto Annual Pass

Because of potential disruption in Canada Post services, the TTC has announced that it will end the mailing of Metropasses to Monthly Discount Plan (MDP) customers effective immediately. For the months of November and December 2018, the TTC will credit accounts of customers who would receive these passes with the equivalent of the discount.

This will allow those still receiving MDP passes to purchase a regular Metropass while having a net cost equal to the MDP value.

The TTC is also encouraging MDP customers to shift to Presto cards and will provide a $6 credit to MDP users on November 1 to cover the cost of purchasing a new card.

The use of physical Metropasses as we know them will end on December 31, 2018, and only the Presto equivalents will continue.

Tickets and tokens will remain available until the start of August 2019, and will be honoured for an as-yet unspecified time thereafter.


King Street Update: September 2018 (Update 2)

Updated November 2, 2018: ERRATA: Capacity charts in the original version of this article omitted 514 Cherry cars from February to June 2018. This has been corrected.

Updated October 11, 2018: Charts have been added at the end of the article giving more detail about the effect of TIFF on operation of the King Street service.

September 2018 brought a major change on King Street with the presence of the Toronto film festival, TIFF, and diversion of service around the festival district. The service design was the same as in 2017, but last year the King Street Pilot and associated traffic restrictions downtown had not begun.

Other service changes in September included:

  • The return to the standard 504 King routing from Broadview Station following completion of track construction on Broadview.
  • Reinstatement of 514 Cherry following a split 504 operation during the construction period. (The split operation will become standard on Sunday, October 7.)
  • The 503 Kingston Road car resumed tripper operations to York Street, but this lasted only to mid-September when the route was extended again west to Spadina (Charlotte Loop) to accommodate construction on Wellington Street.

Peak Travel Times

PM peak travel times continued the pattern seen over the past year, but the TIFF period produced major disruptions because of service diversions. Note that in the chart below, travel times across the pilot area from Jarvis to Bathurst include the time spent on diversion all day on Thursday and Friday, September 6 and 7. Diversions also occurred at some times in the week of September 10-14, but these trips are not included below.

  • Westbound via north on York, west on Queen, south on Spadina
  • Eastbound via north on Spadina, east on Queen, south on Church

The effect of TIFF diversions was worse in 2018 than 2017 with the 85th percentile of travel times on Thursday September 6 hitting 54 minutes. The chart below expands the first three weeks of September and includes four percentile lines rather than the two used in the chart above. Note that the four lines stay close together indicating there was little spread between the best and worst case values.

  • Thursday/Friday September 6/7: The diversion via Queen more than doubled the travel time between the bounds of the pilot.
  • Monday September 10: No diversion or temporary service blockage at TIFF affected the period from 5-6 pm.
  • Tuesday September 11: Service was blocked at TIFF during the 5-6 pm hour:
    • some cars were held producing higher travel times at the 85th and 100th percentiles;
    • some cars diverted (not included below);
    • some cars ran through unimpeded producing a 25th percentile similar to “normal” days.
  • Wednesday September 12: Emergency sewer repairs west of Bathurst required a diversion via Queen for much of the day. No cars operated through King and Bathurst and so there were no trips on King between Jarvis and Bathurst to measure.
  • Thursday/Friday September 13/14: Travel times returned to close to values seen before and after the TIFF period.

Travel times eastbound were also affected by TIFF and the diversions, and the effect was comparable to westbound data.

I will return to the effects of TIFF on all day travel times later in this article.

Here are the full sets of charts:

Continue reading

Request for Comment: Measurement of Service Bunching (Update 2)

Updated October 11, 2018

An updated set of charts has been added which show the evolution of headway values across the route by time of day, including an improved version of the “box and whisker” chart format. Scroll down to the end for this update.

Updated October 9, 2018

A substantial section has been added to this article with replies to many of the issues received in the comments and examples of revised and additional charts. Thanks to all who have commented on this.

Errata

I noticed that the data for the period from 6-7 am on 505 Dundas at Broadview Station has an unusually high value for headways below two minutes. On investigation I discovered that this was caused by garage trips that were inadvertently included in regular service. This only happens for buses that arrive via Danforth rather than via Broadview because of the geometry of the screenline in my model at Broadview/Danforth. This caused these trips to be counted twice: once on the way into service, and again when they left Broadview Station. Charts in the original article that were affected by this problem have been replaced.

Original Article

An ongoing issue for transit riders is the question of service regularity. TTC Service Standards call for vehicles to leave terminals no more than one minute early and no more than five minutes late. That by itself provides a huge amount of variation within “acceptable” service, but there is no attempt to measure route behaviour once vehicles leave the terminals.

One unfortunate effect of Andy Byford’s term at the TTC was the creation of service metrics without necessarily making things better for riders.

Riders do not care if a bus or streetcar is “on time” on many routes, only that they show up regularly. That is the whole idea of “frequent service” – you don’t need a timetable, you just show up and travel without an excessive, unpredictable wait.

I have been wrestling with how to illustrate the problem for some time. As part of preparation for a series on suburban bus service, I wanted to create a measurement that would be fairly easy to understand and which would allow comparison from route to route and place to place.

This article presents the work-in-progress for suggestions to improve or add to the charts before I start publishing data for many routes.

Continue reading