
Updated April 24, 2018 at 6:15 am: The axis title on the headway history chart at the end of this article has been corrected from “Minutes” to “Seconds” to reflect the units by which headways are stated in the chart.
In Part I, I reviewed the travel times for buses and streetcars on 506 Carlton since September 2017. In Part II, I will turn to headway reliability – the degree to which service actually operates with evenly spaced vehicles – as well as the capacity of service provided. A followup section looks back to September 2015 to compare operations over a longer timespan.
When the TTC reports on service quality, they have a very limited target: that vehicles leave their terminals no more than 1 minute early or 5 minutes late. Performance stats at the route level have not been published for three years, although there are plans to resume this practice soon. However, there are problems with summarizing data at the level the TTC reports:
- Results are consolidated for entire days and months so that variations are smoothed out, and the raggedness both in hour-to-hour and day-to-day performance is hidden.
- Relatively poor performance in peak periods can be masked in averages by better performance in the off-peak. Even though there are fewer off-peak vehicles, there are more off-peak hours and hence more trips.
- There is no measure of service quality except at terminals even though that is not where most riders use the service.
- The absence of mid-route measurements means that there is no penalty in a missed “target” for line management quality over the length of a route.
- The six-minute window (+1 to -5) allows pairs of vehicles on routes with short headways to depart from terminals while still being considered “on time”.
- Route capacity is wasted because some vehicles run half-empty close behind their leaders, and the average rider experience is that vehicles are infrequent and crowded. The TTC has no metric to identify and monitor this problem.
Service on 506 Carlton has been erratic for many years and the shift to bus operation in February 2018 has not improved route performance. Although buses are scheduled closer together for capacity reasons, headways remain erratic and in some cases the variation in headways has widened since the move to bus operation.
Looking at these charts, it is a wonder that anybody tries to ride this line at all. It is a textbook example of providing bad and slowly declining service on what was once a trunk route in the system. As density builds up along the “shoulder downtown”, routes like Carlton have an important role, if only the TTC would make the effort to provide more attractive service.
Format of Charts
This article contains charts in formats that will be familiar to readers of other service analysis articles.
Note that there is a gap in the data for November and December 2016.
The charts showing percentiles give a sense of how dispersed the values are within the hour shown on a day-to-day basis.
- The red line (100%) shows the maximum headway observed.
- The orange line (85%) shows the upper bound of the headway seen by most riders.
- The green line (50%) is the median. Half of the trips ran at headways above this, and half below.
- The purple line (25%) shows the level below which one quarter of the trips operated.
When the purple line is close to the axis, at least 25% of trips are operating on very short headways (e.g. bunching), and this is offset by trips operating on very wide headways. If the four lines lie close together, then most of the headways are in a similar range.

The 85th percentile is charted for each hour to show how these values change over the course of the day.

Westbound Service
Note: When viewing these charts, some comparisons between locations can be made easily by opening all four charts at once and stepping between points on the route for the same time of day.
- 506_201706_201803_Danforth_SB_MonthHeadwayStats
- 506_201706_201803_Broadview_WB_MonthHeadwayStats
- 506_201706_201803_Yonge_WB_MonthHeadwayStats
- 506_201706_201803_Dufferin_WB_MonthHeadwayStats
AM Peak
Service leaving Main Station during the 8-9 am peak operates on a fairly consistent median headway of 4-6 minutes from June 2017 through to the transition to buses when the median drops to 3-4 minutes because of the more frequently scheduled service. Maximum headways, however, are much worse starting in late January 2018 up to the transition, and the 85th percentile is higher generally in 2018 for the streetcar data. When one compares this chart to the data at Broadview, the January-February maximum spikes disappear indicating that the problem at Main was likely caused by short turning cars at Coxwell.
By the time the service reaches Broadview, the percentile lines have spread apart with the maxima rising and the minima falling. This shows that the service is more bunched even though the median values are similar.
The pattern seen at Broadview continues at Yonge Street, but of particular note is that there is no difference in the behaviour of the maxima for the bus period compared to the earlier streetcar period. The maxima lie in the range of 10-15 minutes.
By the time service reaches Dufferin westbound, the maxima routinely exceed 15 minutes, and the 25th percentile is often at the 1-2 minute level. As the service has progressed across the route, the gaps get longer and the bunching worsens. This is during the morning peak period when traffic congestion is not much of a problem.
Another way to look at the data is to track the 85th percentile of headways on an hour-by-hour basis. This is the level of service most riders see, and the degree to which this value exceeds the scheduled headway is an indication of how badly the service “on the street” differs from the service the TTC claims to provide. Comparing the data starting at Main & Danforth and working westward, the values rise as one moves across the route reflecting the degree to which gapping and bunching worsen as “typical” service.
(At Dufferin, and to a lesser extent at Yonge, the 6 am line runs higher than the rest because the full peak service has not reached these points for that hour’s service.)
Midday
Service shows a similar pattern leaving Main Station from 1-2 pm. Maximum headways well over 10 minutes are common even though the medians stay roughly at the scheduled value. As the service moves west, the spread between the 100th and 25th percentiles widens with maxima over 15 minutes and low values for the 25th percentile common, especially for the bus service.
The 85th percentile charts show an evolution from fairly consistent values in the morning, including a visible drop with the more frequent bus service, at Main & Danforth, to a situation where, by Yonge Street, the mid-February 2018 change has almost completely vanished and the range of headways riders must deal with are the same with buses as with streetcars, but with smaller vehicles.
PM Peak
Between 5-6 pm, the situation continues to worsen compared to earlier in the day, and is particularly dire at Dufferin with maxima above 20 minutes on many days.
The 85th percentile lines show a marked drop with the onset of more frequent bus service and this drop is still visible at Yonge Street. However, the values at Yonge are well above the scheduled headways showing that many riders are not receiving the advertised frequency but rather they are getting bunched service.
Early Evening
By the early evening, 8-9 pm, service leaves Main Street badly disorganized even with the bus operation, and gets worse as it moves across the route. By the time it reaches Dufferin Street, there is no pretense of service spacing, and the 25th percentile has a low value, especially for buses which are running in pairs (or worse) separated by wide gaps.
Late Evening
Ironically, the service between 10-11 pm is somewhat better than a few hours earlier, but this is only a matter of degree. Maximum headways leaving Main Station are not as badly peaked and the 25th percentile pulls away from the very low values seen earlier in the day. Even so, a great deal of the service lies over a band from 5-15 minutes (25th to 100th percentile) and this exceeds even the TTC’s generous target.
Moving west across the line, the range of headways does not spread out as much as it did earlier in the day. However, the bus and streetcar services are essentially the same reflecting the underlying schedules.
Eastbound From High Park
Eastbound service shows many of the same patterns as seen above for westbound streetcars and buses. Headways lie over a smaller range leaving High Park, and the values spread out moving eastward. Maxima several times the scheduled headway are common with very low 25th percentile values indicating bunched, gappy service.
- 506_201706_201803_Parkside_EB_MonthHeadwayStats
- 506_201706_201803_Dufferin_EB_MonthHeadwayStats
- 506_201706_201803_Yonge_EB_MonthHeadwayStats
- 506_201706_201803_Broadview_EB_MonthHeadwayStats
Inbound service in the AM peak hour at Dufferin shows little difference between streetcars and buses, and the maxima are actually higher with the bus operation.
Outbound service in the PM peak hour eastbound from Yonge, as with westbound service, shows a wide range of headways and service that is routinely bunched. By the time the service reaches Broadview, many vehicles are operating on short headways with correspondingly wide gaps with 85th percentile values at 10 minutes or more.
In the early evening, the pattern continues but on wider headways. This is particularly striking for the buses which become more and more bunched as they move across the city. By the time they reach Broadview, the gap between the median, 85th and 100th perctiles has widened substantially, and the 25th percentile sits at 1-2 minutes. This pattern continues into the late evening.
During some periods, the 85th percentile values at Dufferin are much better (relatively speaking) than those at Parkside. This reflects the effect of short turns at Lansdowne.
Taking a Longer View
After I created the charts linked above, I wondered whether the service quality had only declined in recent years when the line has suffered from various construction projects, or if this is a longer-term issue. Going back to the fall of 2015, I added the data on hand (I don’t have every route for every month) and discovered that the Carlton route has behaved more or less the same way for quite a long time. There are periods when headway reliability is somewhat better, mainly from terminals, but at Yonge Street it’s the same old story.
Here are two samples of the view back to 2015. The first is southbound at Danforth & Main, while the second is westbound at Yonge, both during the 8-9 am peak period.


The chart collections for the termini and for Yonge Street both ways covering the period from September 2015 onward are linked below.
- 506_201509_201803_Danforth_WB_MonthHeadwayStats
- 506_201509_201803_Yonge_WB_MonthHeadwayStats
- 506_201509_201803_Yonge_EB_MonthHeadwayStats
- 506_201509_201803_Parkside_EB_MonthHeadwayStats
Capacity
The capacity charts show the variation in actual service capacity. These are taken back to September 2015 (with three gaps where I was not collecting data for Carlton). The spike in October 2016 corresponds to a period when both a bus and streetcar service overlapped at Yonge Street.
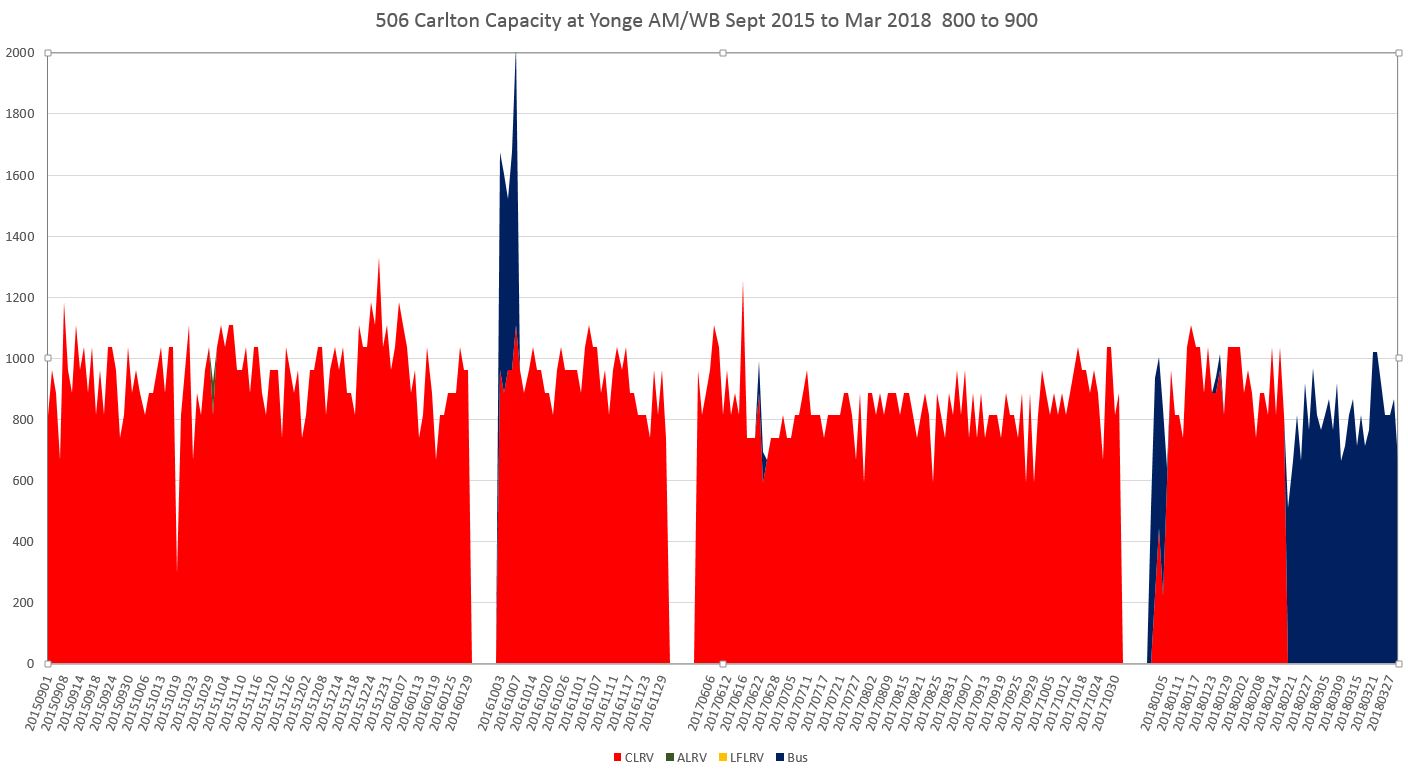
The capacity of service provided on Carlton has declined since 2015, although the degree of decline varies by time period. This is related to changes in the scheduled headway over recent years (see below). Also visible in these charts is the variation in day-to-day capacity actually operated which causes substantial changes in crowding even without the compounding effects of irregular headways.
The decline in capacity continues into the period of bus operation compounding other problems with service on this route.
There is a catch-22 in the capacity reduction. Due to a combination or vehicle shortages and a desire to extend running times by stretching headways rather than adding cars, the lower capacity becomes the “new normal”. This can be seen in the replacement bus service where the capacity is, at best, at the lower range of streetcar values. As capacity declines and riding is driven away by crowding and unreliable service, justification for further cuts becomes “obvious”. The effect of capacity additions has already been felt with the shift to larger vehicles on King and on St. Clair , and yet there is no recognition of this on other streetcar routes. Instead, the availability, such as it is, of new cars is used to push more of the old cars out to pasture.
With Carlton being at the end of the planned rollout for new equipment, it will be a few years before capacity will increase simply through equipment replacement.
AM Peak
PM Peak
Scheduled Headway History
Although the detailed data presented above only go back to 2015, I have consolidated the weekday headways operated on 506 Carlton for the past decade. Although there have been some improvements in evening service (at least partly due to the effect of service standards), there has been a long decline in peak and midday service.
Seasonal changes in peak service are visible in most years, but these were generally backed out with the fall schedules. The bumps up and down in 2017 were due to construction-related schedule changes, but the early 2018 peak streetcar service was less frequent than in fall 2008. The shorter headways across the board in 2018 are due to the scheduled bus service and the need for more of the lower capacity vehicles. Service quality, as discussed earlier, has not been good for several years, and the buses have not improved the situation.
(The values are presented below based on calendar months. In many cases, schedule changes do not occur precisely on month boundaries. For the purpose of the chart, the headway operated for the most days within a month is the one that is shown. For example, a change to summer headways in late June is shown as affecting July and August.)


The service has been far better with the buses and I dare say that the struggling TTC ridership will increase if the replacement of streetcars by buses is made permanent.
Steve: I have seen many comments to the opposite effect. Considering that the TTC is running less capacity with more bunching, I don’t think they will attract new riders.
LikeLike
Streetcars provide good surface transit when implemented correctly as in Europe (bi-directional with doors on both sides and track crossovers and NO time costly loops and good signal priority and much else). The TTC has got none of it right. It seemed that the Finch West LRT was going to be a well implemented streetcar route but the Liberals have been promising it for more than a decade and it was supposed to be completed in 2013 and now, the Liberals are promising it again as an election promise (as they did many times before) with ZERO intention to actually build it.
LikeLike
The service has been mostly atrocious with buses. Gaps and overcrowding are the norm. If you get lucky, you get a fast ride on an uncrowded vehicle, but I’ve only ever experienced that travelling in the counter-peak direction (heading to downtown from Main St. in the afternoon).
What is obvious is that the Orion VII buses cannot handle crowds anywhere as well as a CLRV. If there’s a ten-minute gap, which is sadly typical of both bus and streetcar operation, the streetcar will be crowded but it will still manage to carry everyone and not spend too much time dwelling at the stops. The buses simply can’t deal with the crowds, and dwell time at stops can be several minutes as riders fight to get off and on the bus.
Sometimes following buses will pass a struggling, overloaded bus that’s carrying a gap. But it’s a crap shoot–other times, the following buses simply amble along in the wake of the first bus, which is falling further behind at every stop.
I have gotten off an overcrowded bus, got on the following bus with empty seats, and then got to pass the first bus. On the other hand, you never know when and where a bus might be short-turned.
LikeLike
I’m sitting here in Europe with lots of service running with unidirectional trams (Bombardier-branded, no less) and loops, other service running bidirectional, and no apparent difference in reliability. Loops are really really really not the deciding factor in whether a surface service runs well. Signal priority and dedicated rights-of-way are far more important. Really strange to lead a list of complaints about Toronto transit with bidirectionality.
Steve: Some people have hobby-horses about what constitutes “good transit”.
LikeLike
My experience with the bus so far: 1. there is a lot more jerking, especially noticeable at higher speeds; 2. I use an app to see the arrival times – NextBus doesn’t seem to reflect the faster bus arrivals, I missed the bus a couple of times because of that.
Also, I noticed that often there are two buses running at the same time. I have seen the buses overtake each other, e.g one makes a stop, while the other passes by. Is this allowed? Often people prefer to wait for the second bus, if the first bus looks to be full. This used to work with streetcars, I am kind of surprised that buses don’t do the same.
Steve: Leap-frogging is a useful way to spread out demand, but there have been different approaches to its use on the TTC. In the case of a route like Carlton, all of the buses have the same destination, and so it does not matter to riders if they leap-frog. On branching routes, or streets with multiple routes, a leap-frog move can mean that someone waiting at a stop does not get to board the vehicle they need.
With streetcars, obviously they cannot do this, and would-be riders have the option of waiting for the second one in a group. There is always the chance a short turn will thwart this, and this can lead to crowding on the first streetcar of a group. Even if it does short turn, the second car is still available. That is not the situation with buses.
LikeLike
Kevin’s comment: The Finch West LRT, with the other six Transit City LRT lines, was cancelled by Rob Ford in December of 2010.
If Transit City had not been cancelled by Mr. Ford, but kept to its planned construction, these seven LRT lines would all be completed or nearing completion right now.
Instead, what we have is endless debate over items such as a proposed one-stop subway to Scarborough at an ever-ballooning cost and ever-receding completion date.
Instead of having service in place right now, what we have is a situation where improved service must be classed as an eschatological concept. Only in Toronto…
LikeLike
Apparently the TTC does not show the 175 on their website at this time.
Steve: It is not an official route until May 13, and it is included in the service changes that are now up.
LikeLike