
With recent events of major subway delays and discussions at the TTC Board about a “Ridership Growth Strategy”, the whole question of “what can we do” is swirling through the Toronto media and online. This article is an attempt to pull together threads from several reports and discussions.
This is a very long read and I salute those who stay the course to the end.
In brief, there is a capacity crisis on every part of the TTC system that is the product of years of pretending the problem is not as bad as it looks, and that a few magic bullets can solve everything. This is compounded by underinvestment in the bus network, by Bombardier’s sluggish delivery of new streetcars, and by subway planning that leaves major components either unfunded or missing from the long range capital plans.
There is no easy fix to any of this, but that is no reason to throw up our hands in hopeless resignation to further decline of our transit network. Recovery has to start somewhere even though the benefits will take time to appear. Politicians are afraid of spending money and driving up taxes. Staff act as enablers by concocting budgets that fit within available funding. The numbers “come out right” only because we ignore the full scope of our needs and how badly we have deferred addressing them.
This article does not propose specific remedies, but sets out the history of what has been done (or not done) over past years. Reading through all of it, I cannot help thinking that “Ridership Growth” is a laughable goal considering how hard Toronto has tried to stifle transit’s capacity and attractiveness. But at least the TTC Board is talking about trying to build more demand on its system. To do that, they must first acknowledge the accumulated shortfall between transit we think we would like and transit that is actually on the street.
For convenience, the documents referenced are all linked here:
- TTC Ridership Growth Strategy (2003) Report
- TTC Ridership Growth Strategy (2018) Report & Presentation
- TTC Corporate Plan (2018-2022) Report and Presentation
- TTC Crowding Standards (January 18, 2018) Presentation
- TTC Subway Crowding (January 18, 2018) Report
- TTC CEO’s Report (January 2018)
- Toronto Budget Committee (January 23, 2018) 2018 Capital and Operating Budget Reports & Minutes
- TTC Presentation to Budget Committee
- TTC Briefing Note on Overcrowding
- Yonge Subway Extension – Final Report on Transit Project Assessment Process and Future Actions (December 17, 2008) Report
- Yonge Subway Extension – Recommended Concept/Project Issues (December 17, 2008) Presentation
- Yonge Subway Extension Post Transit Project Assessment Process Technical Amendment (May 1, 2012) Report & Presentation
- Yonge Subway Extension Conceptual Design (March 2012) Report [Large PDF]
- VivaNext Yonge Subway Extension Page
- Metrolinx Yonge Network Relief Study (June 25, 2015) Presentation
-
Amended 2012-2016 Capital Program and 10 Year Forecast – Shortfall Reduction Plans (September 16, 2011) Report
2003 Ridership Growth Strategy
Although the 2003 RGS was recently dismissed by current TTC Chair Josh Colle as if it were yesterday’s answer to transit problems, the context in which it was written is as fresh today as it was 15 years ago.
There is a growing expectation that transit in general, and the TTC in particular, must take on an increased role in providing travel for people in Toronto if the City is to grow and thrive economically and in an environmentally-sustainable way. Each level of government has recently announced plans and policy initiatives, that highlight the need for greater use of transit in urban areas – the City with its Official Plan, the Province of Ontario with its “Smart Growth Council” and “Gridlock Subcommittee”, and the Government of Canada with its approval of the Kyoto Accord. Achieving these policy objectives will require a fundamental shift in transit’s role in Toronto and the relative importance of automobile travel.
Unfortunately, these initiatives follow on the heels of a consistent lack of government support for the TTC in the past decade. Provincial funding was reduced a number of times in the mid-1990’s and is only now being partly restored. The TTC’s ridership and market share has fallen significantly during this period, to a large extent because of lack of government support. While there is no simple “magic answer” that will reverse this trend, government support for the TTC must be real and pronounced if the current widespread public and government expectations for improved transit are to be met.
The TTC’s mandate is to operate and maintain transit services that provide safe, fast, reliable, convenient, and comfortable travel in a cost-effective way. The TTC’s highest priorities are to our current passengers, and to maintain the existing system in a state-of- good-repair. The TTC needs a substantial, ongoing, funding commitment to meet these basic priorities and fulfill its role of providing transportation services to a large proportion of Toronto’s population. Once these needs are met, the TTC could attract more people out of their automobiles and onto transit with a stable source of increased funding and a commitment on the part of the City to implement policies that support efficient transit operations and transit-oriented development in Toronto. [Executive Summary, p. E-1]
Two points here cannot be made too strongly:
- There is no magic answer, and
- Looking after the system and riders we have today is essential to attracting new riders.
Investing in improved transit service makes sense for many reasons, but it must be done in a way that provides significant, measurable, and real returns on investment. If taxpayers’ funds are to be used to improve transit services, there needs to be a strong business case to prove that the money is well spent, and that any funding provided will generate significant additional ridership. There is no simple, low-cost solution to achieving increased transit ridership, or to reduce congestion and pollution. Attracting new riders to transit will require substantial increases in government policy commitments and subsidy, on a consistent basis, over a number of years. One-time funding arrangements and individual mega-projects will not result in significant changes in overall travel patterns over the long term or over a wide area. A consistent, long-term, staged program of providing priorities for, and investing in, expanded existing transit services, using proven technologies and operating strategies, provides the best opportunity to achieve sustained increases in transit ridership.
The underlying issue will continue to be the extent to which the City and senior levels of government will be willing to take the steps necessary to invest in transit to achieve their broader objectives. [p. 3]
There is a section titled “Why people choose to use transit” that is too long for me to quote in full here [see pp. 5-6], but a few excerpts are worth including:
The key factors governing mode choice are speed, reliability, comfort, convenience, and cost. Different segments of the market put differing values on these factors, and an understanding of market segments is critical to determining the potential for attracting transit riders. In addition, some modes of travel are simply not available or practical for some trips – few people will make very long walking trips for example – and people do not necessarily have an automobile available for any given trip. The availability and attractiveness of various modes is also very dependent on the location of both the origin and the destination of the trip being made.
…
The situations where transit can compete effectively with automobile travel are those where there is good pedestrian access to transit at both ends of the trip, and where transit can provide comparable speed to automobile travel when all factors are considered. Under these conditions, transit travel becomes attractive to many potential users. These conditions exist for travel to and from downtown Toronto in peak periods, where the roads are congested and rail lines (GO and subway) provide a comparable travel speed to automobile travel. There is also excellent pedestrian access from the downtown rail stations to destinations in the downtown. Transit achieves a 60%-to-70% mode split to transit in these favourable circumstances.
There is an obvious problem with this observation, and it applied even in 2003: much GTHA travel is not oriented to downtown and its concentrated destinations, and riders will not fall into transit’s lap simply because this is the obvious way to travel. Indeed, in many cases transit will be the last, not the first, choice. This begs the question of whether there are some trips for which making transit even grudgingly acceptable simply is not economic, but at the same time whether there are trips that are poorly served by a downtown focus on travel. This question is not new to transit debates.
If we abandon trips that are harder (or more expensive) to serve, or provide only minimal service to “show the flag” with a route map whose many lines hide less-than-ideal service, do we risk alienating potential riders especially in an era of population and density growth? Market conditions could evolve to give transit a greater role provided that it is there to establish credibility and a base of demand. This is not just an issue for the far suburbs in the 905, but for areas in both the outer 416 and in more central, redeveloping industrial neighbourhoods.
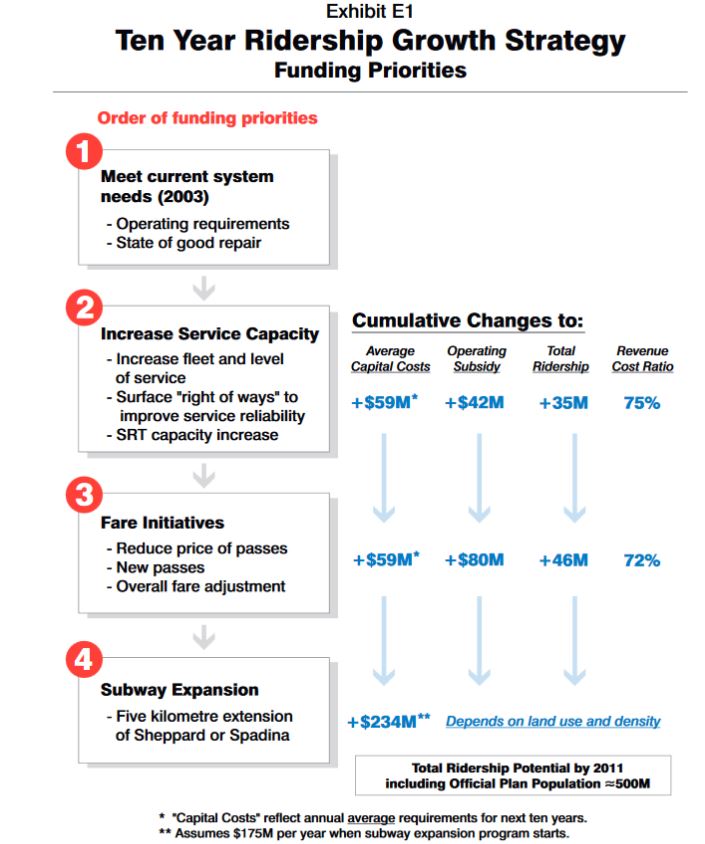
The strategy contained a mixture of proposals to be implemented over time including current operational and state of good repair funding, increased system capacity including surface rights-of-way and new larger trains for the SRT, fare structure changes to encourage use, and a modest extension of the subway network (either Sheppard East to STC or Spadina to York University). The revenue:cost ratio would be allowed to fall as a matter of policy to support increased service and new fare options.
Some of the RGS recommendations either were not implemented, or were rolled back in the austerity years of the Ford administration, notably the more generous crowding standards. The increase in capacity involved purchase of vehicles to address peak requirements, but more generally a recognition that crowded transit is not attractive transit. The initial beneficiaries of less crowded service would be existing riders, but this would also provide room for growth that would not otherwise occur because transit was seen as “full”. This is very much the situation we face today where people are less than willing to join the transit riding community, and adult trips are actually being lost on the system (the flat ridership stats exist only because of increased riding by children, students and seniors).
The recession of the early 1990s had a cruel effect on TTC service and ridership:
When service was reduced on a system-wide basis during the 1990’s, vehicles were removed from most routes in the system at most times of the day. This resulted in passengers having longer waiting times for vehicles, increased crowding on vehicles with less chance of getting a seat, and less-reliable service as the remaining services struggled to carry the increased passenger loads. In total, 232 buses and 60 streetcars were removed from morning peak service during this period and overall, service levels fell by 11.5% between 1990 and 1997 while the population in Toronto grew by approximately 10%. [p. 27]
The proposed new standards would reduce the accepted average load during the peak period, set the off-peak average to a seated load, provide service on all routes for 19 hours per day, and set a 20-minute maximum on the scheduled headway, the space between vehicles on any route.
Riding did improve, although capacity constraints on some parts of the network limited growth to off-peak and shoulder-peak periods (subway and streetcar). In the fall of 2010, Rob Ford was elected, and service improvements planned for 2011 were cancelled. Further cuts came in 2012 as the more generous loading standards were rolled back. In spite of this, the system continued to gain riders for a few years, but the rate of increase fell and by the Tory years, ridership stagnated. Despite the reintroduction of some services and capacity, the system has lost its momentum to attract riders.
Although some budgetary proposals for improvements have been passed by Council, others have been turned down, and there is a sense of only making enough improvements to give the appearance of bettering transit, but on as small a scale as possible with any vestige of credibility. This is where Toronto stands today.
Crowding Standards
Crowding Standards (part of the overall Service Standards) have evolved over many years going back to an era when the (pre-amalgamation) City of Toronto under Mayor John Sewell proposed that the TTC have a standards for evaluating and allocating its service. Politicians and riders could count on these to determine when routes needed more or less service, although there was always a caveat “subject to budget availability”. Service to the standards was a nice-to-have, but not if the City could not or would not “afford” it.
This produced situations over the years which continue right to the present day where routes can be overcrowded by the standards, but there is no public reporting of the overall shortfall. The TTC Board recently directed that this information be included quarterly in the CEO’s Report, and it is amusing that for a “customer focused” organization, the absence of such basic reporting has gone on for so long.
By the early 2000’s, the standards dictated that routes with frequent (10 minutes or better) service would allow standees during the off-peak period, while less frequent routes would be designed for a seated load. This is calculated as an average across the peak hour, and with the irregularity of headways, some vehicles can be well over the standard and others well under it even though the overall average is maintained.
This is a critical factor in looking at attempts to shave route capacity because most riders see the crowded buses and streetcars, not the half-empty ones following closely behind. Bunching is a chronic problem on transit systems, but the TTC makes little effort to ensure that vehicles are evenly spaced. Indeed, their own “on time” metric used in the CEO’s report is such that service on frequent routes can be within the standard even when buses and streetcars run in pairs. The problem here is that service is measured relative to scheduled times, rather than by the space between vehicles which is the way riders experience the system.
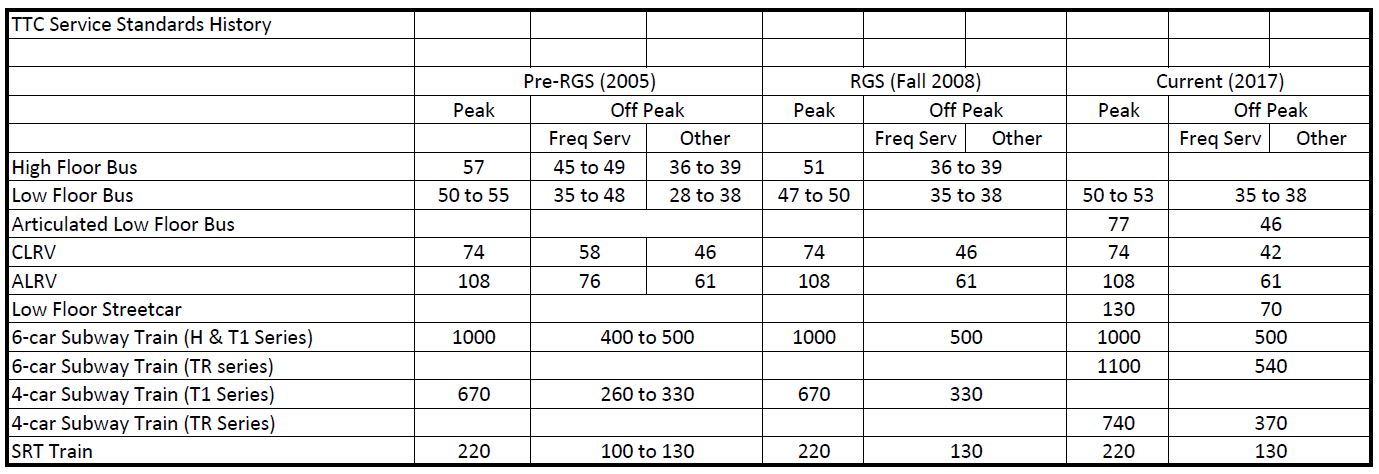
Although the original RGS report dates from 2003, it took several years before the more generous standard could actually be implemented. This was caused both by the need to acquire vehicles, but also by delays in staffing up to the required level thanks to a wave of retirements and to labour legislation that mandated limits on work hours. The new standards were actually implemented in November 2008.
The RGS standards reduced the peak load on buses by about 10%, and eliminated the provision for standees during off-peak periods on both bus and streetcar routes. Riders might be forgiven for wondering whether that standard was ever actually achieved given the usual level of crowding on busy routes.
With the election of Mayor Ford, the transit changes set in place by Mayor Miller were reversed, and the standards reverted to the pre-RGS levels. Another change was to roll back service on off-peak routes with low demand. Originally, the target set for a “non productive” route was that it had less than 15 boardings per hour (a boarding could be a new fare, or a transfer from another route). This was adjusted to 10 boardings per hour to save some periods of service, although there were debates about the accuracy of riding counts the TTC used to decide what would be cut.
After Mayor Tory was elected and he discovered the damage Ford had done (a rather disingenuous stance for someone who ridiculed the need for more buses during his election campaign), the standards reverted somewhat back toward RGS levels with peak bus loads set half way between the Miller and Ford standards.
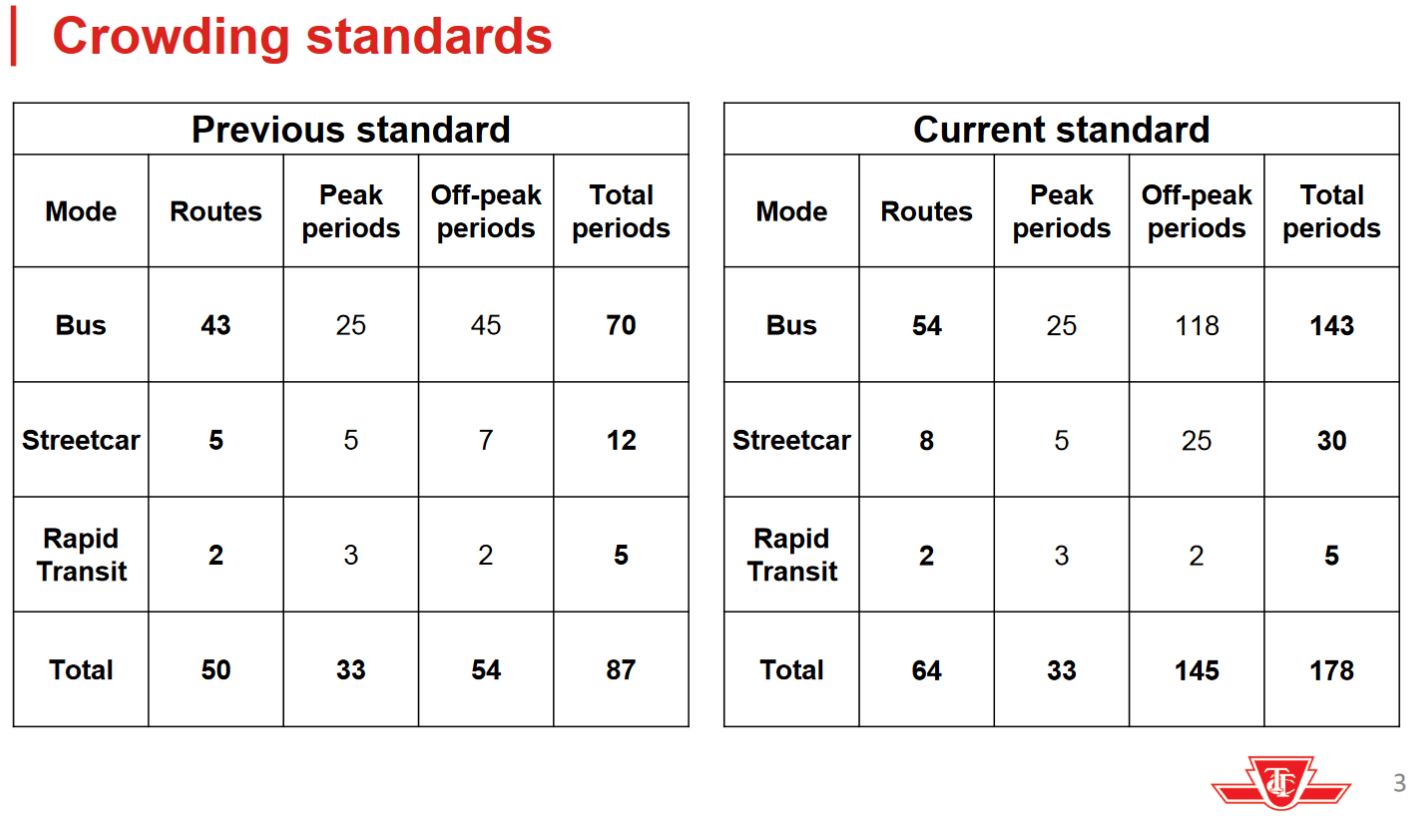
Recent debates about overcrowding have cited TTC figures about the number of routes and periods of operation where average loads exceed the standards. The two tables below show the degree of crowding based on the Ford and Tory eras of standards. Within TTC schedules, there are five periods over the course of the day and three types of schedules: weekday, Saturday and Sunday/Holiday. This gives a total of 15 periods for the week, of which 2 are the weekday peaks.
In the “current standard” section, this means that 64 routes have overcrowding relative to standards at some time during the week. There are 33 cases where a route is overcrowded during the peak period and 145 cases where a route is overcrowded during the off-peak. The information is not subdivided to show whether the problems exist mainly on weekday middays or on weekend evenings (for example). It is worth noting that the rapid transit system which only has 4 routes (and hence 8 peak periods) is overcrowded during 3 of them relative to standards, and also has 2 off-peak periods where crowding is a problem. Improved off-peak service on Line 1 Yonge-University was proposed by TTC staff, but this did not make the cut in the TTC’s budget discussions due to cost.
This is subdivided in another chart showing the degree of crowding on off-peak bus services.
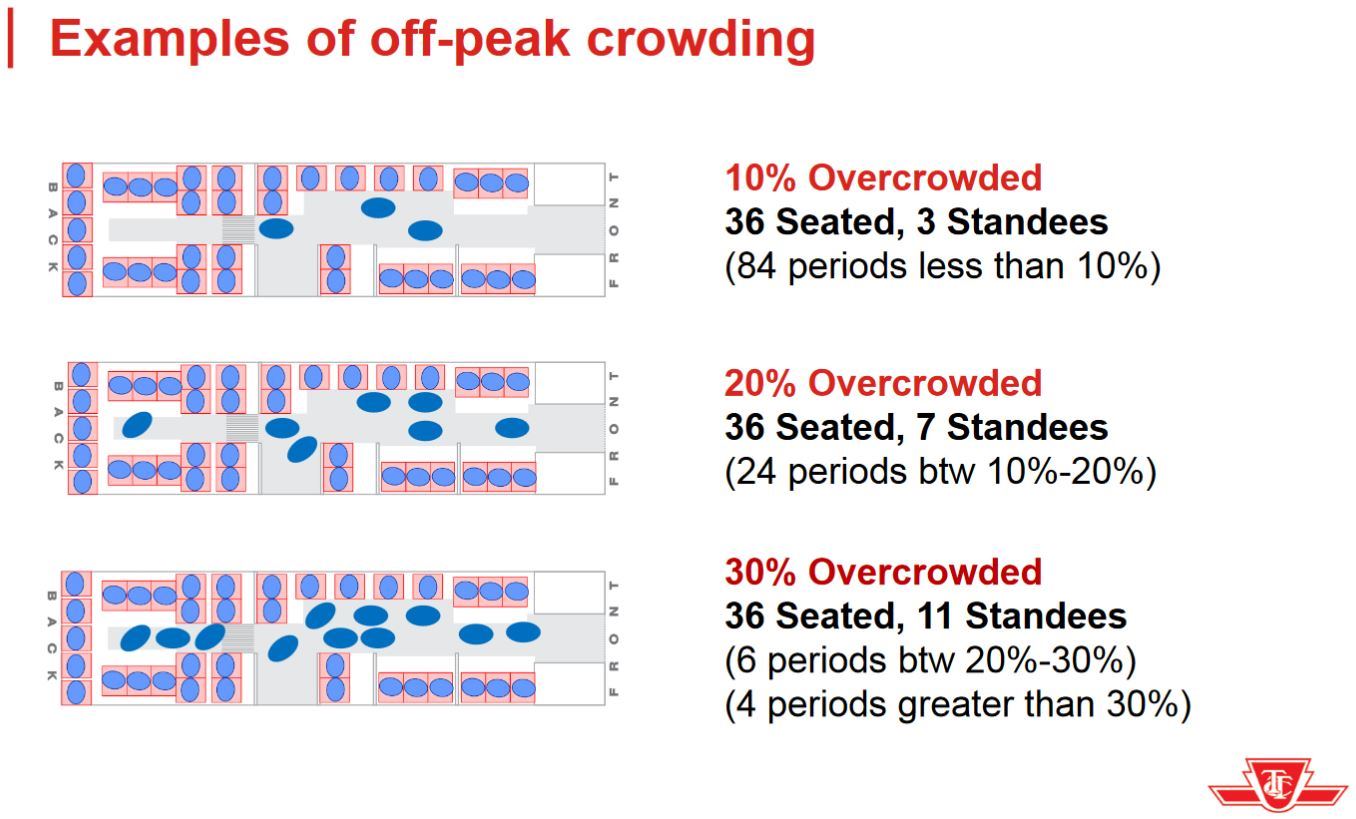
The majority of the 118 cases involve 10% or less crowding, in other words a few standees, on average. TTC Chair Josh Colle has mused that this standard is too generous, and there will likely be a move to change it when the matter comes to the TTC Board in April so that some degree of standing is permitted going forward. This will not change the actual situation on services, merely reduce the count of “overcrowded” routes.
A particular issue during off-peak periods is the disruption that can be caused by shopping buggies, luggage and baby carriages. These consume aisle space and effectively reduce the capacity of a bus while adding to stop service time as passengers make their way past obstacles that are usually near the front door.
Allowing a higher number of off-peak standees can also make a bus “full” with conditions close to peak periods. Remember that the peak standard is 50-53 riders/bus (depending on model), and at 30% over a seated load (47 riders), crowding approaches peak period levels, particularly when vehicle-to-vehicle variation is taken into account.
TTC riding growth, such as it has been, has come more in the off peak when the system has capacity and is less crowded than in the peak period. Making space for new riders was one of the RGS goals, but it is often sacrificed on the altar of “efficiency” and packing as many riders as possible on transit vehicles.
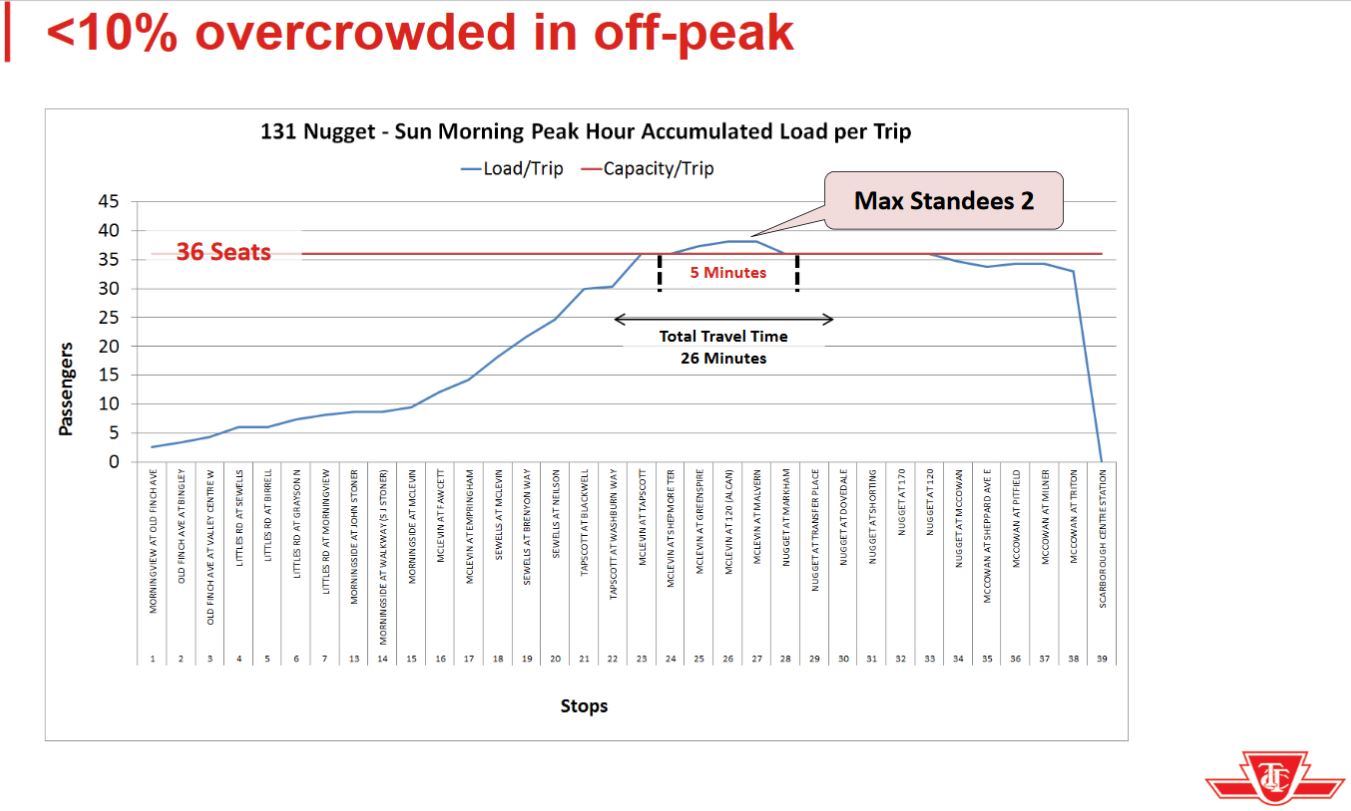
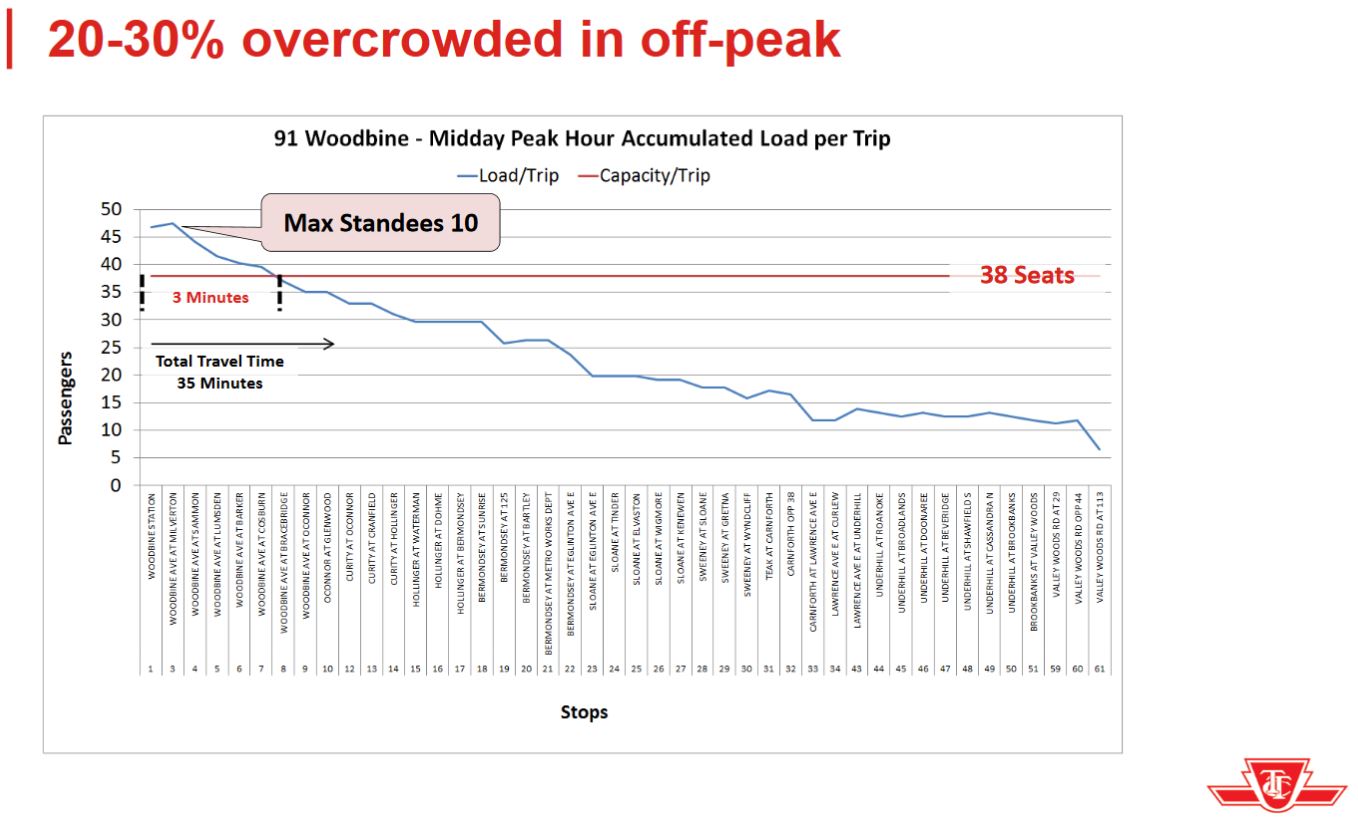
Another variation of the question of crowding is the length of time for which crowding persists on a route. This was illustrated by two charts in the crowding report.
The first shows minimal “crowding” on the Nugget bus on Sunday mornings. On average, there are a few standees, and the condition does not last for much of the trip.
The second shows the Woodbine bus on weekday middays where it goes well above standard, but only for the portion of the route closest to the subway.
In both cases, the demand on the outer parts of the routes is well below the seated load line, and this is typical for transit services that accumulate riders to a peak point. One could argue for a service design with a short turn partway along the route to raise the “efficiency” of those outer segments. However, the effect would be to cut headways to a point where service would be unattractive with a wait time making up a substantial portion of the total travel time. This is a balancing act in service design but a constant source of annoyance to those who see near-empty buses as a waste. They are part of the cost of doing business.
Another factor to be considered here is the portion of a route (measured in distance or time) where the standard is routinely exceeded. Brief “blips” are inevitable and might even be tolerable, but it is easy for these to grow into a chronic problem over longer sections of a route thanks to “budget availability” for more service.
The danger in nibbling away at the standards, whatever they may be, is that this begins a trend where unfavourable stats are made to vanish simply by changing the standard. Moreover, these are one-time savings, to the degree that the new standard saves any money at all rather than simply avoiding service improvements that the old standard would have triggered.
Finally, one goal of the off-peak seated load standard was to ensure that riders with mobility issues would be guaranteed a seat, and that all riders would have a comfortable trip especially considering longer wait times for off-peak service. Yes, there are now the “blue seats”, and with some good fortune they might even be occupied by riders who deserve them, but there is no guarantee.
By using examples of minimal overcrowding (few standees, short periods), the overall problem is downplayed as if we really shouldn’t worry ourselves about it.
During the TTC Board’s recent “Strategy Meeting”, Chair Josh Colle asked whether having three off-peak standees on the 90 Vaughan bus would trigger an additional vehicle at a cost of $97/hour when they might only have to stand for a few stops. How does the crowding standard fit, he asked, with what “any reasonable person” would think of as “crowded”. This misses the point that the standard is for comfort and attractiveness of the service, and it applies to much longer and busier routes than the Vaughan bus.
Staff will present a post-implementation review of the current (Tory era) standards to the April 2018 Board meeting. This could trigger adjustments and shifts of resources between routes later in the year.
Colle went on to talk about how one additional bus on Vaughan and other such routes would trigger the need for a larger fleet and another garage. Here he was completely off the mark because the standard under discussion is for off-peak service when no additional vehicles would be needed, only the operator hours to drive the bus and the marginal cost of its operation.
He asked how adding a bus drives riding and wondered whether customers show how much they need service based on usage. Would the TTC simply be adding an empty bus? Again this misses the point that riders choose whether to use or to avoid transit based in part on convenience and comfort. A short route like Vaughan requires a big jump in capacity when it crest the “overcrowded” line because there are so few vehicles on the route to begin with (2 or 3 during off-peak periods). One cannot add 10% of a bus to make a small change in capacity on such a route. Using this as an example misrepresents the more general need to add service as riding grows rather than using up all available capacity until it is full. This is a balancing act, but the issue deserves more than a superficial analysis.
Colle dismissed the 2003 RGS as being out of date with the idea that simply running more service will gain more riders in the face of modern alternatives such as Uber. This is a distortion of the situation. More buses on 126 Christie (another of Colle’s targets) would not necessarily bring more ridership, but this depends on the level of demand and on the perceived quality of the service. There are other routes where capacity and quality of service deter riders such as 29 Dufferin with which Colle should be familiar.
Saying, as Colle did, that “throwing more buses out there” is “1960’s thinking” misrepresents the whole concept of service standards. As a city we might decide that a seated load plus ten percent is acceptable if the condition only exists for a short distance on a route. However, once we set that standard, we cannot avoid the need to pay for the service it demands.
Counting Passengers
A long-standing challenge in reviewing the level of TTC service is the infrequency with which riding counts occur and are published. The most recent route-level counts on the TTC’s website are from 2014. (This is the list from which the “65,000 riders” on King, a value recently updated to “71,000”, came from.) Fine-grained stats on riding by time period are rarely published, although this may change with the planned quarterly reports of overcrowding.
There are three ways that the TTC counts passengers on surface routes:
- A “standing count” is taken by staff positioned at a route’s peak point (typically) estimating the ridership on each passing car. The same approach is used on the subway.
- A more detailed count can be done by having staff ride a selection of vehicles recording the ons and offs along the way.
- Vehicles equipped with automatic passenger counters (APCs) can perform detailed counts without the need for staff.
Counts involving people standing on the street or riding on the vehicles are labour intensive, and they are performed rarely. This exposes the results to the inherent variation in demand based on weather, day of the week, time of the year and other factors that can easily swing ridership up or down by 10% or more. For busy routes, it was not unusual in past years for the same count to appear in annual ridership tables (while the TTC still published them) for two or more years in a row.
Counts with APCs can be conducted every day on every vehicle providing an avalanche of data. The TTC’s problem is that only about 900 buses have this equipment, and none of the streetcars. Data transfer occurs separately from the APCs as the old vehicle monitoring system (“CIS”) has no capacity for additional data in its feed. This should be corrected with the new “VISION” monitoring system that will begin its implementation later in 2018 at one bus garage. There is an obvious benefit in having the loading and location data (among other information) transmitted in one package to eliminate the need to integrate multiple sources of data. Moreover, real time display of crowding problems should assist with line management.
There were plans to install APCs on 40 new cars, but this has not happened yet given other problems with Bombardier’s delivery. It is not necessary to have 100% of the fleet equipped as vehicles with counters can be assigned to routes as a group when a count for that route is needed. However, 100% coverage is needed to do real-time monitoring.
While riding counts, especially at the detailed stop-by-stop level, can tell us a lot about those who use a route, they do not tell us anything about those who chose not to ride, or who give up in frustration. The latent demand for service on King was obvious from the jump in ridership with the transit priority pilot, but even now with full streetcars, we do not know just how high the demand would go if capacity were there to carry it.
There is a similar problem in the subway where a service that is packed to the doors cannot carry more riders, but counts only tell us how many are on the trains, not how many would ride if service were improved.
The Role of “Micro Transit”
Another issue at the Strategy Meeting was the role of micro transit – basically anything smaller than a standard transit bus – in the TTC’s service offerings. What is the role for Uber or some similar service in areas of lower demand and density?
This topic comes up in discussions of the “last mile problem”, particularly for carriers with widely-spaced routes and lighter demand such as GO’s connections to local transit systems. Would it be preferable to ferry riders to and from major terminals with a jitney system that operated more on demand and closer to riders’ destinations than a conventional bus route? There may be a role for this type of service, although the cost per rider is likely to be higher than a typical transit service. Moreover, the day will come when some areas served by demand-based micro-transit reach a point that a regular bus route is justified. Prying riders out of a more convenient door-to-door service could prove difficult.
However, that is not the real issue in the ridership growth debate. Last mile rides can make transit a viable choice for those living and working in low density areas, but jitney services will not replace the busy trunk bus routes.
For example, in 2014, the peak bus requirements for routes carrying fewer than 3,000 riders/day amounted to 125 out of over 1,500 peak buses in service. That cutoff level brings in routes such as 62 Mortimer, 126 Christie, 83 Jones and many others which are not exactly “minor” routes. (It also includes the “premium express” bus routes which, in 2014, carried fewer than 2,000 riders/day between them and are classic examples of “squeaky wheel” benefits to riders in wards whose councillors have at some point sat on the TTC Board.) Setting the bar lower would reduce the number of affected buses to a trivial level – only 54 buses serve the routes with fewer than 2,000 passengers/day. One can argue that at the margins, the evening and weekend services where demand might be quite low, there is a role for a micro-transit service, but this would not eliminate the need to have a conventional fleet, garage space and operators for periods of higher demand.
A last-mile jitney service would be an enhancement to, not a replacement for, transit service on the vast majority of the network.
The Bus Network
Plans to expand the bus network have come and gone over the years thanks to changes in rapid transit plans. When Transit City was on the table and expected to be finished within this decade, the replacement of major bus routes with LRT would have offset the need for new buses. Nonetheless, as part of the original RGS, there were plans to buy more buses to improve peak services. At the time, garage capacity was thought to be sufficient to get through this period. Because of the budget cuts instituted in the Ford era, plans for this bus order were dropped in fall 2011 for the 2012 Capital Budget.
Bus Procurement – ($49.8 million): Bus procurements will be reduced by 134 forty foot buses (from 340 40 foot equivalents) as a result of the removal of 108 peak ridership growth buses and 26 contingency buses. It should be noted that the majority of these reductions, ie 108 of 134 are contingent on the policy RGS loading standard being approved to return to the pre RGS level. The reduction in contingency buses will impact TTC’s ability to respond to unexpected events as well as respond to higher than expected ridership growth.
…
Temporary Bus Storage Facility – ($23.1 million): With the removal of 134 buses from the fleet, additional storage will no longer be required as current garage capacity will only be slightly exceeded and crowding will cease with the opening of the new Eglinton – Scarborough Crosstown LRT.
This also left the TTC in a situation where no new bus garage would be required, and it was not until 2015 that the partially funded McNicoll Garage appeared in the Capital Budget. This garage will not open until 2020, and the remaining garages are badly overcrowded by the existing fleet. This has produced a convenient situation for the TTC in that it can claim not only to have no buses available for service, but no place to put them even if magically they appeared tomorrow. The more subtle issue is that owning and running more buses means a higher operating cost and subsidy call on the City of Toronto.
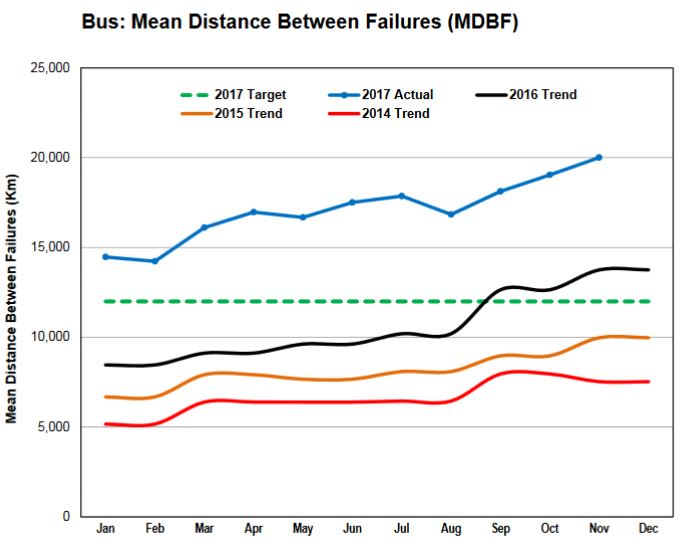
In recent years, the TTC has increased the provision for maintenance spares in its bus fleet so that more pro-active, “fix-before-fail” work can be done and bus reliability in service will rise. The benefits show up in the mean distance between failures (MDBF). However, the more-reliable fleet comes at the cost of having fewer buses available for service unless there is an offset between the higher spare ratio and a lower rate of buses being “available” in name only.
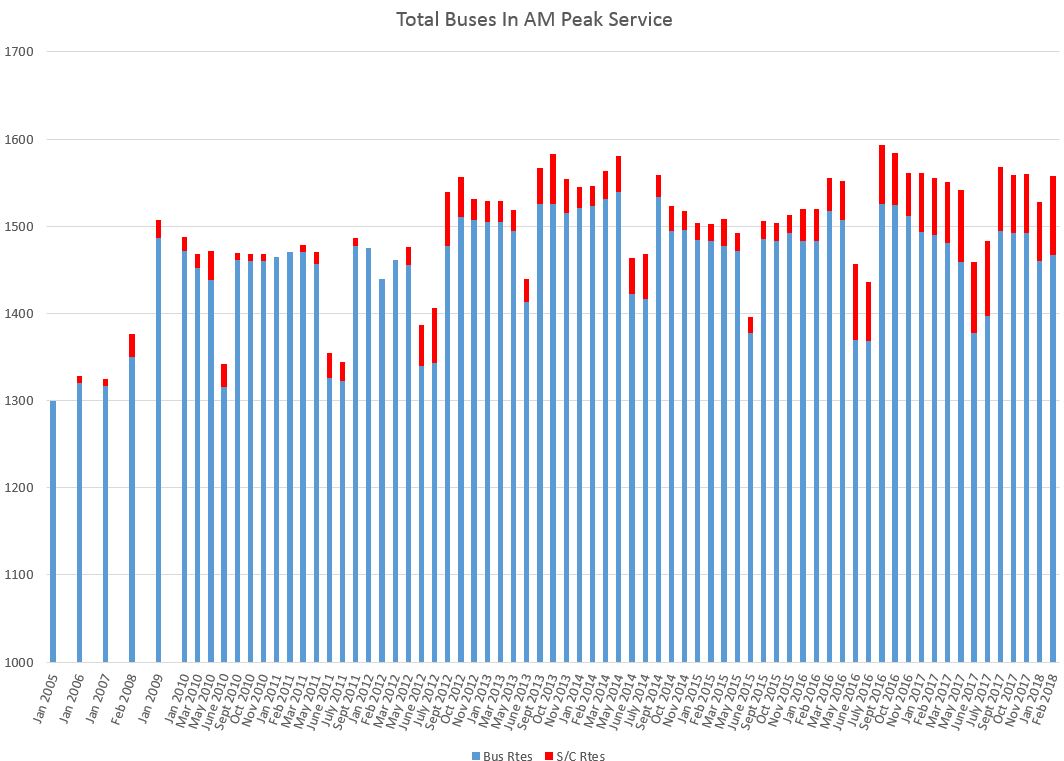
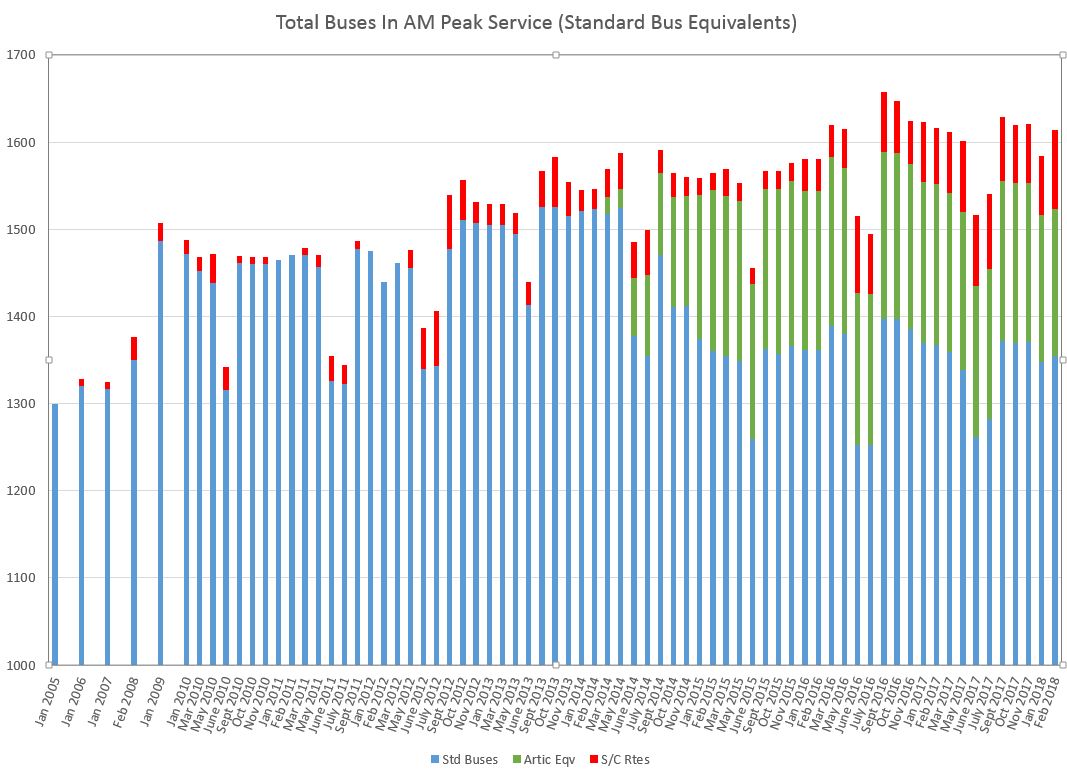
The total number of buses in service gives an indication of the evolution of service levels. The chart below shows the AM peak bus requirements since 2005 (with only the winter schedules shown for the first five years) as well as the number of buses required to fill in for construction and/or shortage of streetcars on that network. Note that the scale begins at 1,000.
The blue section below, buses that are operating on bus routes, has actually dropped since 2012. The most recent change beginning in 2017 is due to the increase in the maintenance spare pool. However, this does not tell the entire story because articulated buses with a larger capacity became part of the fleet in 2014. The second chart below shows the number of buses on a capacity basis for the AM peak, and this adds the equivalent of about 60 buses because of the larger capacity of the artics. (Typically 115-125 artics are scheduled in service for the AM peak.)
In either case, however, the apparent growth beginning in 2016 is due to buses operating on streetcar routes, not to an increase in the capacity of vehicles on the bus network itself (top of the green section in the second chart).
A further consideration when looking at data from the previous decade is that the old, high-floor buses had about 10% greater capacity than the low-floors that replaced them. There is no adjustment for this in the charts below.
From a budget perspective, the streetcar shortage provides a handy way to save on operating costs because there are “no spare buses” with which to improve peak service. If not for the bus substitutions on the streetcar routes, the TTC would have an embarrassing surplus of buses sitting in garages, and would have to seek additional funding just to put them on the street.
The vehicle counts shown above are for scheduled service, and three sets of spares sit on top of these numbers (not shown here):
- Maintenance spares in each garage (includes spares for change-offs of vehicles that fail in service),
- “Capital spares” for buses in major overhaul projects, usually at Hillcrest, and
- “Warranty spares” for new buses undergoing modifications while they are still under warranty (location depends on the nature of the work).
This brings us to the problem of garage capacity. The bus fleet plan must provide not only for scheduled service, but also for the spare vehicles at garages. This has been a problem for some time because the capacity required exceeds the practical capacity of the various sites compromising their ability to function.
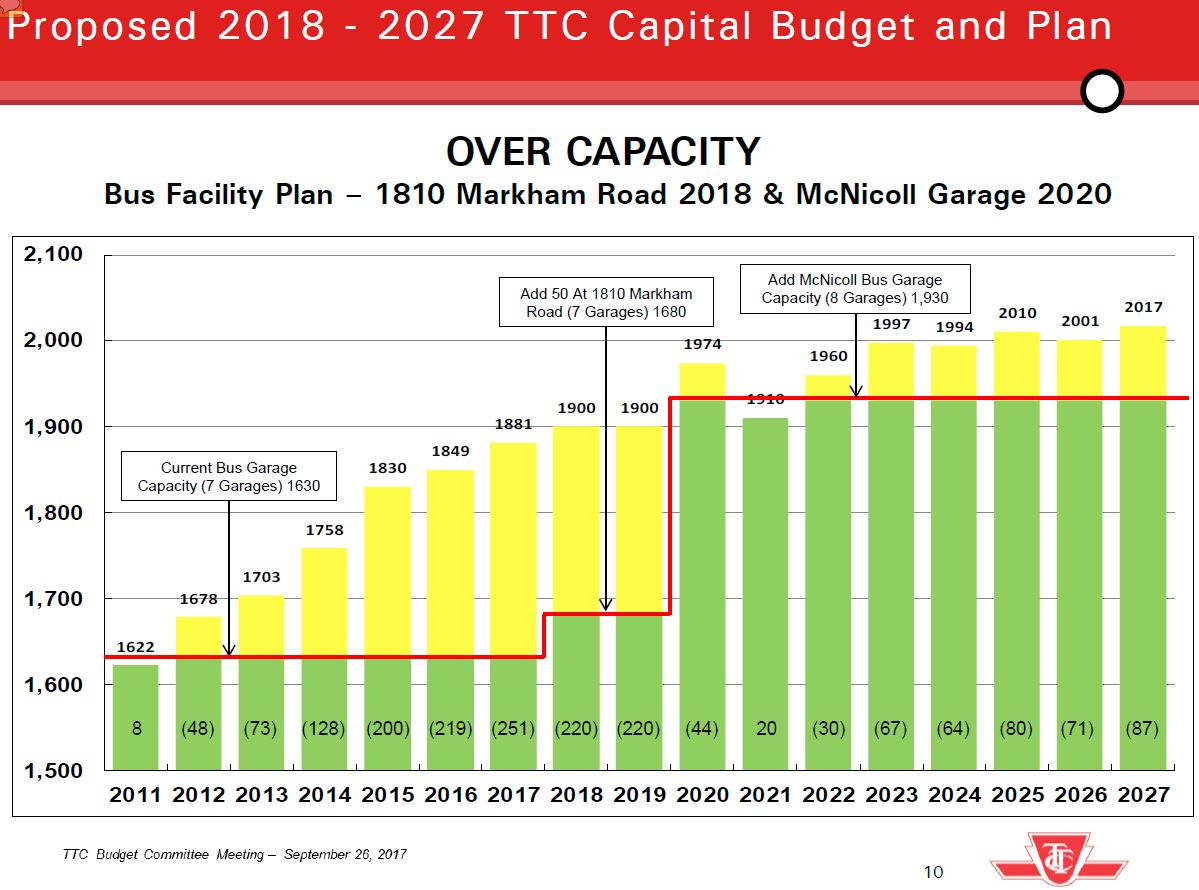
Note that the total number of buses (yellow) in garages is about 300 higher than the number required for service (shown in the earlier charts above). The next major jump in capacity comes in 2020 when McNicoll Garage opens, and there is no provision for additional peak service through 2018 and 2019.
Garage planning is complicated by the mix of vehicles in the fleet. Only certain sites can host articulated buses because of their physical layout and the availability of equipment specific to the longer buses. Artics now operate from Arrow Road, Malvern, Mount Dennis, and Wilson. If the TTC purchases a substantial number of electric buses, they will require either that an existing garage be modified or that a new purpose-built facility be created. There would be a rolling requirement to retrofit diesel-based garages for electric operation over the period of transition to a new fleet, and for older garages, this could even be an opportunity to rebuild rather than to renovate.
Because of the lead time for new facilities, the TTC and the City are locked in to the current capacity of the seven garages now in operation with an eighth to follow in 2020. Building up the fleet to add peak service will be challenging even assuming buses could be procured, or that older buses now planned for retirement could be kept active while the new orders now in place roll into Toronto.
We have burned through the surplus capacity in existing facilities, and then some, thanks to a decision to cut service standards and reduce the fleet back in 2011. The oft-cited additions to the fleet under Mayor Tory have gone largely to increase the pool of spare vehicles and to backfill for the failing streetcar fleet, not to improve service on the bus network.
As the 2018 TTC budget worked its way through various meetings, some progress was made on funding crowding relief for the bus network, but only for the most serious cases.
At the TTC itself:
Direct staff to adhere as much as is possible to the Toronto Transit Commission’s loading standard with a net zero budget impact:
- a. in the off-peak hours;
- b. in the peak hours using every available vehicle; and
To report quarterly on adherence to the loading standard through the Chief Executive Officer’s report.
The funding needs for better service were summarized in a Briefing Note to the City’s Budget Committee:
In 2018, subject to an increase in operating subsidy, the TTC can focus on addressing overcrowding in peak periods and off-peak periods where overcrowding exceeds 30% (i.e. 11+ standing customers per bus on average).
• Based on bus availability […] this change can be implemented starting in September 2018. The TTC would require approximately 24 AM / 19 PM additional buses and $1.0 million in operating costs in 2018 and $4.0 million annually thereafter ($3.5 million in peaks + $0.5 million for off-peak).
The Budget Committee approved:
An increase to the Toronto Transit Commission’s 2018 Preliminary Operating Budget of $1.0 million gross and net to bring bus overcrowding to 30% above the current overcrowding standard for non-peak hours.
An attempt by Councillor Mihevc (who also sits on the TTC Board) to fund all of the remaining shortfall was voted down. Whether an attempt is made at Council to reinstate this funding, and how successful that might be, remains to be seen.
Motion to Amend Item (Additional) moved by Councillor Joe Mihevc (Lost)
That the Budget Committee include in the recommended budget funds to support management of overcrowding on the TTC from September to December 2018, including peak and off-peak service, at a cost of $3,200,000.
This means that there is no budget provision, as things stand, for additional peak period service.
The Streetcar Network
It is no secret that the streetcar network has suffered from a car shortage thanks to Bombardier’s slow deliveries, but the problem has existed for about 20 years, ever since the 510 Spadina and 509 Harbourfront routes soaked up the last of the spare fleet. What had been adequate through the recession of the early 1990s has been inadequate to serve the streetcar network ever since riding began to grow as the economy recovered. (The TTC had also rebuilt several PCCs for the 604 Harbourfront route, as it was then called, but these were retired due to age and the general surplus of streetcars by the mid-1990s.)
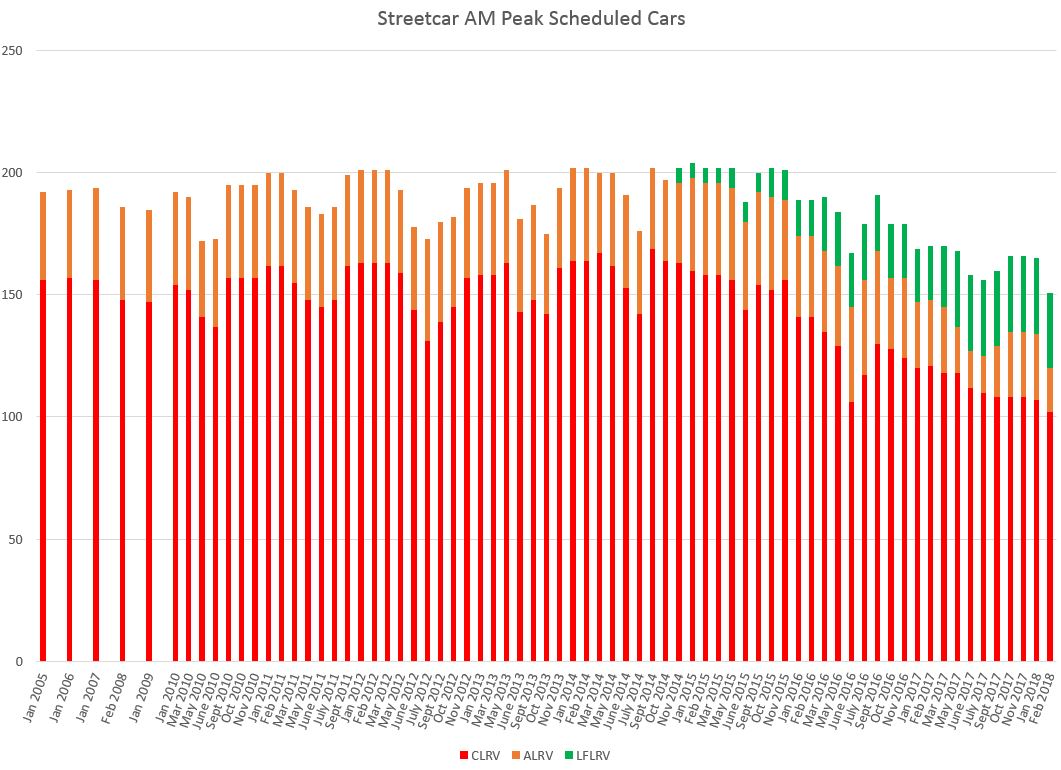
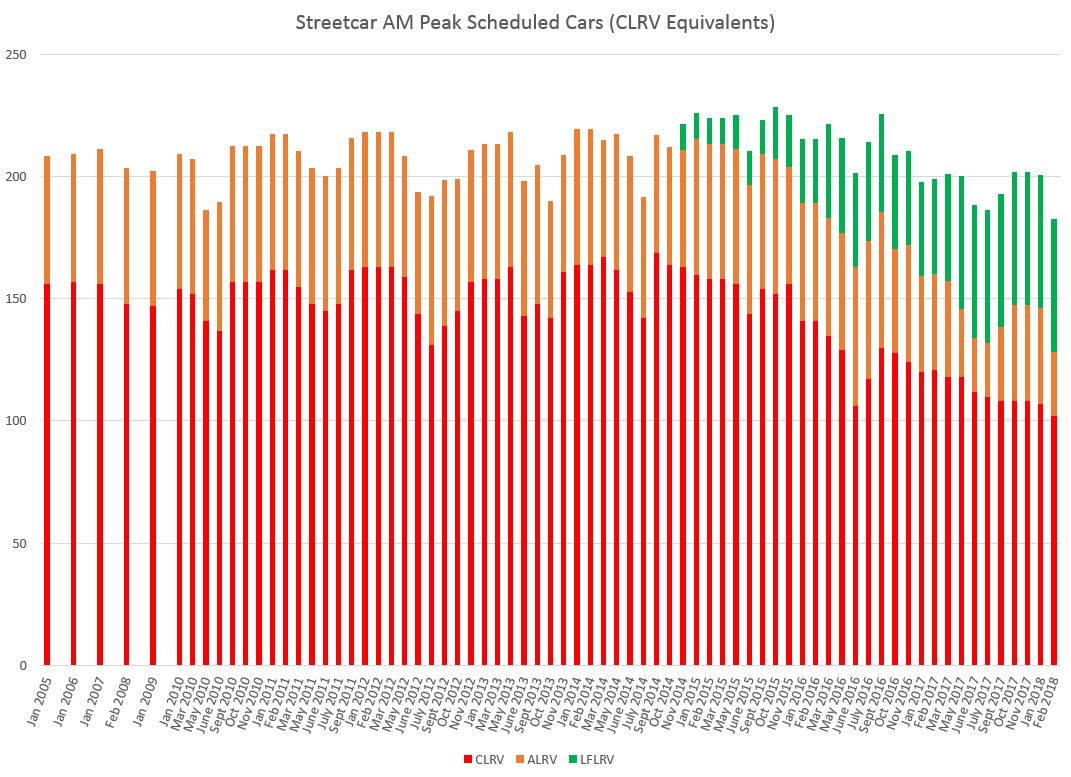
The charts below show the AM peak scheduled service subdivided by type of car from 2005 to 2018 in a format similar to the bus charts above. The first chart simply counts cars regardless of their capacity, while the second adjusts the ALRV and Flexity (LFLRV) bands proportionately to the vehicle sizes and their service design capacities compared to the standard CLRVs.
What is evident here is that the scheduled service was more or less unchanged peaking at just over 200 cars during winter schedules until late 2015 when the new Bombardier Flexitys began to arrive. From that point onward, CLRV and ALRV retirements brought down the total scheduled service, and the larger size of the Flexitys has not completely offset the loss of the older cars. This brings us to February 2018 where two major routes, Carlton and Dundas, will be converted to bus operation although this is partly offset by a return of streetcars to Bathurst and Kingston Road, as well as an increase in the number of cars on Queen.
A full set of the bus and streetcar charts for both AM and PM peaks is available as a PDF below. The data are adapted from the Scheduled Service Summaries which are available on this site back to March 2008, and earlier from hard copies in my archives. (February 2018 is estimated from announced service changes.)
The TTC has been saved from the worst effects of the streetcar shortage by various construction projects that forced bus replacement, and the network has not run with 100% streetcar service since mid-2012 (see bus charts earlier in this article). A return to full streetcar service now depends both on Bombardier’s deliveries and the continued health, such as it is, of the CLRV fleet.
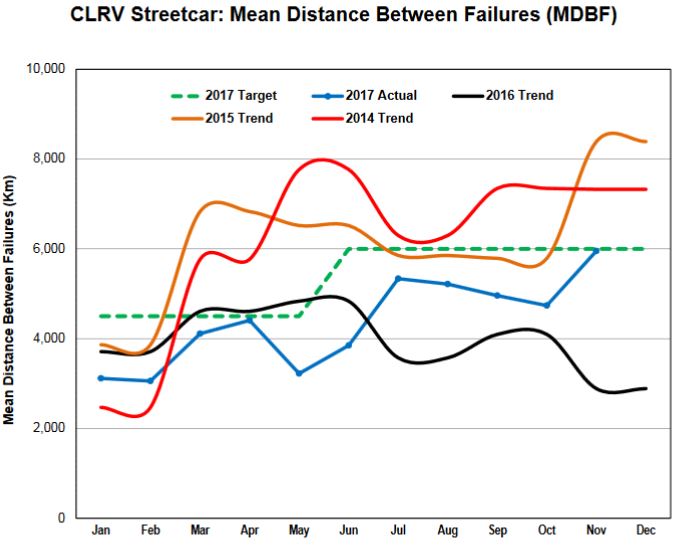
The reliability of the three streetcar fleets varies considerably. Note that in the following charts taken from the January 2018 CEO’s Report, the vertical scale is not the same for each chart.
The reliability of the CLRVs shows a downward trend year by year from 2014 (red) to 2017 (blue), although this is not clear cut. Recent maintenance work on the CLRV fleet has improved its reliability in 2017 over the low point in 2016. Also evident here is the annual dip in reliability during winter months which are not kind to these cars’ subsystems, a fundamental design problem ever since they were delivered.
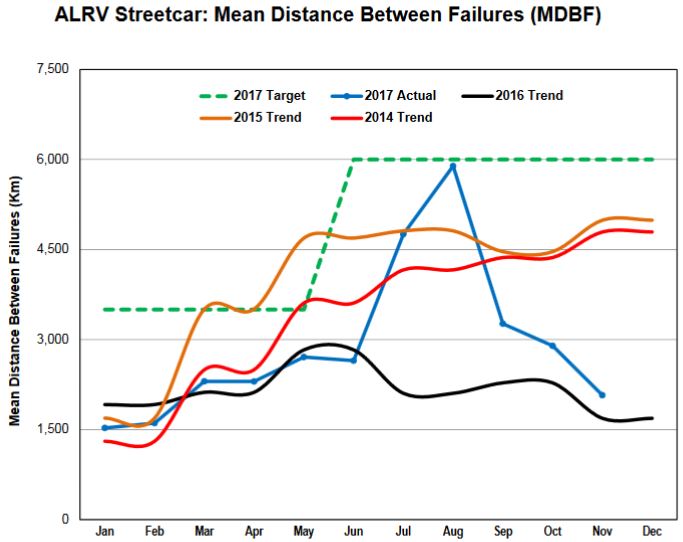
The ALRVs (articulated streetcars) show similar patterns to the CLRVs, and this fleet hit a high point in August 2017 from which it quickly fell again. The winter months of 2017/18 are not yet in these charts and the numbers will not be good based on the amount of service the TTC has managed to field. Note that the fall in reliability predated the cold weather, and so more is going on here than just a case of severe streetcar frostbite. The spike in reliability through the summer is probably due to the reduction in the number of ALRVs actually in service so that only the best cars were on the road, and once a larger portion of the fleet was back in service, reliability fell again. The change in the number of scheduled cars is visible as a narrowing of the orange band in the AM peak scheduled cars chart above during mid-2017.
This is an example of problematic performance statistics that can be affected by factors that are not immediately obvious in a chart.
What is particularly galling is the decline in the number of ALRVs in service which will be down to 18 cars (10 on Queen and 8 on King) by February. Over the past year or so, the TTC has spent about $1 million per car rebuilding 25 of the ALRVs for continued service, but this work, according to the TTC’s Brad Ross was only cosmetic and did not address problems with some of the subsystems leading to withdrawal of the ALRVs from service during December 2017’s deep freeze.
The new Flexity cars are gradually improving, although their stats have bounced around a bit during the two years for which they are published. As problems with various subsystems, notably doors, are resolved, we can only hope that the rise in late 2017 will continue, and especially that there will not be the winter dip so characteristic of the older fleet.
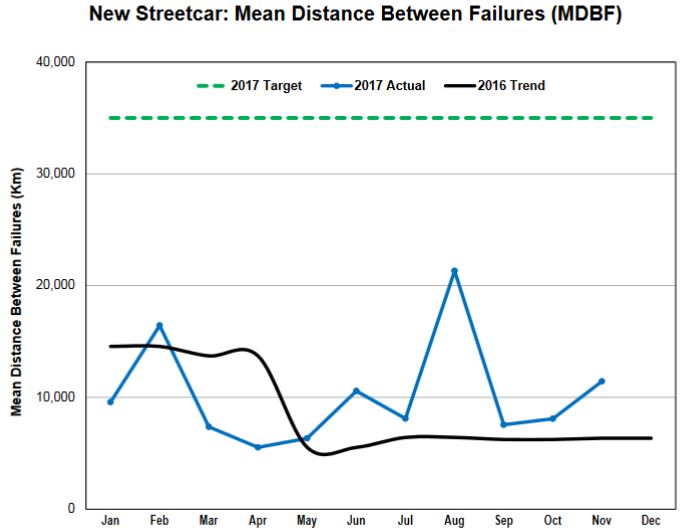
As of February 2, 2018, the highest numbered car visible through tracking data is 4463, and this is well below the mark of 4470 originally expected for year end. Bombardier and TTC have not yet issued an updated delivery schedule. A related problem is the question of whether the TTC will, as new cars become available, simply use them as replacements for existing vehicles, or if the total fleet will grow and streetcars return to routes now operated with buses. This would make more buses available for service improvements on bus routes even with a freeze in the total fleet size. This is a question for later in 2018 when there is a better sense of what Bombardier will actually achieve.
The Rapid Transit Network
As everyone saw this week, the subway network is incapable of absorbing the effect of significant delays during peak periods, especially when multiple events combine to strangle system operations and capacity. A detailed report will come to the February 2018 TTC Board meeting, and I will leave comments about causes, effects and needed changes until then. The TTC has already acknowledged that some of the mess is on their heads, “own goals” one might say.
The evolution of subway capacity problems is a combination of several events and political pressures, and it can be traced back to the recession of the early 1990’s. In the late 1980’s, the subway was bursting, especially the lower Yonge line, and provision of new capacity was a big issue. This could be done in two ways: either run trains more frequently, or build a new parallel line, the route we now call the Downtown Relief Line, but which was once known as the Queen Subway.
With the recession, TTC riding dropped like a stone, and the system lost 20% of its ridership. Suddenly, subway capacity was not an issue. Meanwhile, the idea of an extension to Richmond Hill took root, and for a time it was assumed that extra demand could be handled by the existing infrastructure subject to several upgrades:
- New cars with open gangways would increase the capacity of trains by about 10%. This spare capacity could be counted on some years back when the Yonge line was served with the older cars, but the new trains’ capacity has long been absorbed by the latent demand for service in this corridor. Quite bluntly, it is dishonest to continue talking about this as if it were future capacity waiting to be tapped, but this still shows up in some presentations.
- A new signal system would allow trains to operate much closer together with train frequencies from 105 seconds down to as low as 90 seconds.
- Trains could be extended with a seventh car to fill out space on platforms that is now a buffer for inaccuracy inherent in manual train operation and stopping, but which disappears with Automatic Train Control (ATC).
- The capacity of key stations, notably Bloor-Yonge, would have to be increased to handle the larger passenger volume a more frequent service would bring to the platforms and circulation space.
The signal system, now in operation on the Vaughan extension and planned to be extended over the entire Yonge line in stages by late 2019, will allow trains to run much closer together because the control system “knows” exactly where trains are and can adjust speeds to match the safe braking distance. This allows trains to pull closer together when there is a backlog than would be possible with the existing signals that use a much coarser resolution of train location. In particular, a train waiting to get onto the platform at Bloor Station could pull much closer behind a train in the station, and be on the platform sooner than it would be with the current system. This provides more time for passenger handling rather than waiting in the tunnel.
Current plans are to extend ATC south from the current limit between Wilson Yard and Sheppard West Station to at least Dupont by the fall of 2018. The section from Yorkdale to Dupont is already completed and was active during testing before the extension opened, but it has been turned off again to avoid switching back and forth through the complex junction at WIlson Yard which is still a work in progress. Beyond Dupont, the current schedule is to complete “around the U” to Bloor as the next step in 2019, although this cutover might be broken into segments to allow the University side to convert sooner. The full conversion north to Finch will be complete in late 2019, and based on current experience, the TTC believes that this target will be met.
The Yonge line is scheduled for a 141 second headway (2’21”) in the AM peak, or 25.5 trains/hour. At a service design capacity (see the crowding standards above) of 1,100 per train, this is equivalent to about 28,000 passengers per hour. Once ATC is in place, the TTC plans to build up service to 30 trains/hour (2’00” headway, 33,000 passengers), and later in stages to 33 trains/hour (1’49” headway, 36,300 passengers). This jump will not be done all at once to ensure that other factors do not make actual operation at those headways difficult or impossible.
The problem is that choke points can exist both at major stations due to long dwell times, and at terminals due to physical constraints on turnaround times and operational delays. Because every other train inbound to a terminal must cross the path of a waiting outbound train, and in a worst case this is done from a standing start just beyond the crossover, there is a lower bound on the cycle time for trains. There are ways to get around this, but they require reconfiguration of the terminal. An easier approach is to have a short turn before the terminal so that all trains do not run through. This reduces the timing demands at the end of the line. For example, for the proposed Richmond Hill extension, only half of the trains will run north of Finch.
Until ATC is in place over the entire line, shorter headways cannot be operated, and especially not through the already crowded Bloor Station. However, an option available to the TTC and mentioned in the subway crowding report is the reinstatement of “gap trains” that could pull out onto the line when there is a delay. For the Yonge-University line, these trains used to sit at Davisville in the AM peak to fill gaps coming south from Finch, and at the centre track between Union and St. Andrew to fill gaps in either direction northbound from the core. These trains were cut from the schedule as a cost saving measure. The bean counters (including politicians) see only empty trains that do not always run, but sit awaiting their call, while those concerned with service see gap trains as a necessary measure to minimize the effect of gaps that will occur more often than not. A near empty train pulling into Bloor Station can swallow a packed platform’s worth of passengers and avoid severe problems for following trains, not to mention for the overcrowded platform.
There are limited places where gap trains can be stored for use on the line because little additional storage was provided when various parts of the YUS were built. An often-mentioned spot is in the tail tracks beyond terminals, such as at Finch, but this brings its own problems with the existing signal system. When a tail track is occupied, trains are forced to enter the station much more slowly than normal to guard against platform overrun into the parked train. This actually reduces the capacity of the terminal and throttles service. Once ATC is in place, the control system will be in charge of train speed and will not have to be as overly conservative on entering as the current system now enforces.
A further issue in planning for the YUS is the available fleet. Peak service now requires 61 trains in the AM and 63 in the PM. (Although the headways are wider in the PM, no trains short turn and so more are required to operate full service to Vaughan.) Moving to 30 trains/hour is an increase of about 18% taking the total fleet requirement to 74, not including spares or gap trains. However, the TTC only owns 76 TR trainsets, and cannot get to 30 trains/hour with the current fleet, let alone to 33. There are no plans in the capital budget for the additional trains required to improve service.
Another change possible with ATC is that trains can run at a higher speed than with the existing signals that are designed for lower-speed operation and cannot easily adapt to the higher speeds of which the trains are actually capable. This would reduce total train requirements, but the degree of this effect is not yet part of published plans in part because the TTC has not yet addressed the need for more trains when headways are reduced with ATC. Some of the headroom for this improvement was eaten up when four trains’ worth of TRs (24 cars) were converted to six, four-car trains for use on the Sheppard line.
On the Bloor-Danforth line, there are two possible locations for gap trains: Greenwood Yard in the east and Keele Yard in the west. The TTC has a surfeit of the T1 cars that operate on BD because early fleet plans for the Vaughan extension assumed that some of the T1s would remain on the YUS. However, converting them to ATC was considered impractical and costly given that they are due to be replaced in the mid-to-late 2020s, a project that could be advanced if the Scarborough Subway Extension is to operate with ATC.
The subway crowding report proposes the re-establishment of gap trains, but this runs into issues both with budget (operators to drive them) and availability of equipment.
There are about 61 trains’ worth of T1 cars in the fleet, but only 45 are used in peak service. Allowing for spares at 20% (9 trains), this leaves 7 trains available for minor improvements, notably gap trains on BD. More frequent service is not possible given the limits of the existing signal system that will not be replaced until the mid 2020s. Those 7 trains were earmarked for the Scaborough extension, although they will not run there because of the switch to ATC. If the T1 fleet is replaced car-for-car, this will allow the SSE to open with 50% of the trains turning back at Kennedy, but with no provision for shorter headways on BD that ATC would allow.
It is ironic that original plans for ATC would have seen YUS completed by 2016/17 and a ramp up of work on BD from 2016 through the early 2020s. However, work on BD was deferred because it was felt that the through service on a Scarborough-Eglinton crosstown route would divert traffic away from the Danforth subway.
BD Automatic Train Control – ($150.0 million): Signal equipment on the BD line has reached the end of its useful life and needs to be replaced. In addition, the line is nearing the capacity that a conventional signal system will permit. Thus the initial capital plan put forward by staff was to replace the current conventional signal system with an ATC signal system following the completion of the ATC implementation on the YUS line. However, since the conception of this plan, a major change to expansion plans was announced, namely the combining of the new Eglinton LRT line with the rehabilitated/modified SRT line into one continuous line, resulting in lower ridership projections on the BD line. Thus the need for ATC on the BD line has been deferred well into the future. [Amended 2012-2016 Capital Program and 10 Year Forecast – Shortfall Reduction Plans (September 16, 2011) at p. 5]
Such are the problems with shifting plans – the assumptions made under one set of circumstances might no longer be valid, but the dependencies and effects of changing policies are poorly understood (or forgotten).
In April 2018, the TTC will also bring out a major plan for renewal of the Bloor-Danforth subway which will include:
- New signals and ATC implementation.
- A new fleet capable of ATC operation and with provision for one person train operation (or “OPTO” in TTC-ese).
- A new yard and maintenance facility west of Kipling Station on lands formerly occupied by the CPR Obico Yard (property acquisition is already in progress).
- Station renovations including accessibility and fire safety changes.
- Co-ordination with the Scarborough extension so that the entire line is ready for modern operations by opening date.
The intention is that by co-ordinating these as one set of projects, there will be both economies of scale and an avoidance of the many “oops” that bedeviled upgrades on the YUS that were planned and executed on a piecemeal basis. The various subprojects exist, for the most part, in the capital budget, but not all are funded, and they are currently timed in ways that would cause conflicts in the overall execution. Timing is an issue in capital projects because the ebb and flow of spending requirements does not always fit with available sources of funding, particularly the City of Toronto’s borrowing plans. This has been a source of project delay in the past with needed work deferred simply because there is not enough money available to pay for it.
Greenwood shops is not configured for unit trains like the TRs running on the YUS. However, assuming that shorter trains operate on the Relief Line comparable to those on the Sheppard Subway, Greenwood could be home base for the RL trains. Obviously this cannot happen until the BD operations vacate Greenwood for the new yard at Kipling.
All of this may seem arcane, but fleet planning and associated capital budgets are essential for the TTC to achieve the capacity improvements touted as possible with ATC on both routes, not to mention for implementation of any extensions.
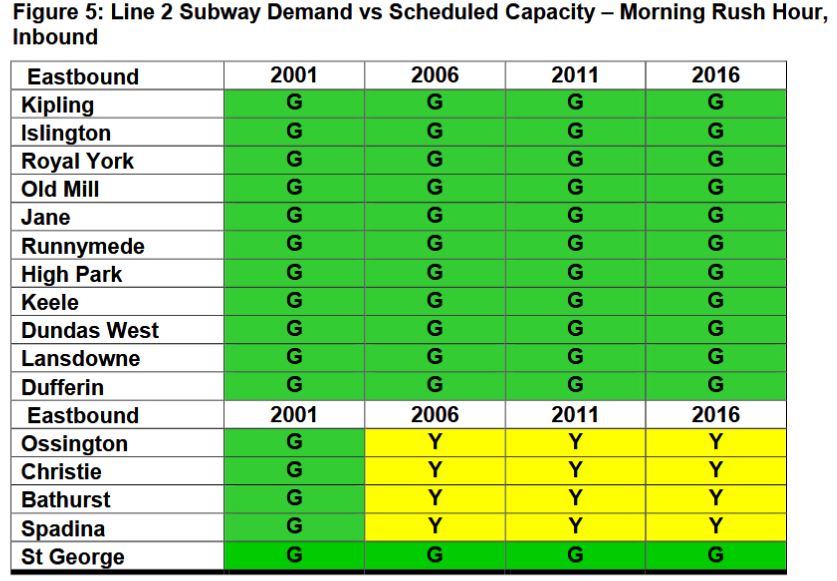
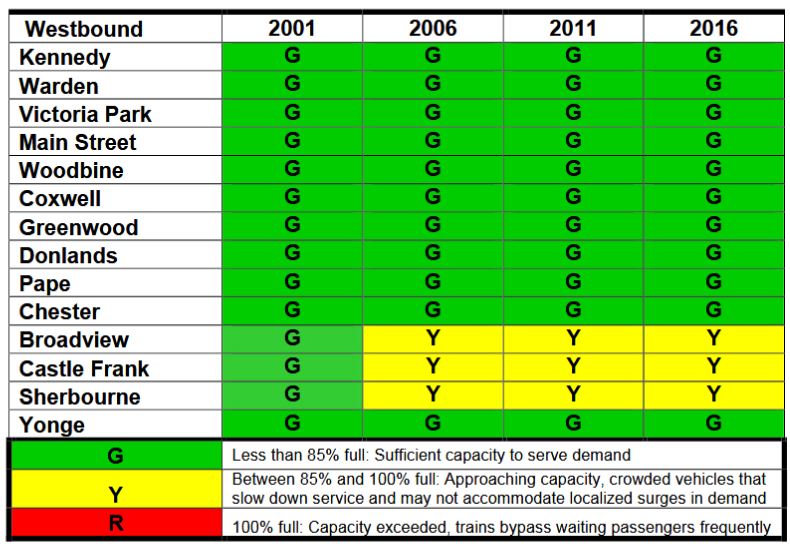
Crowding on the Subway
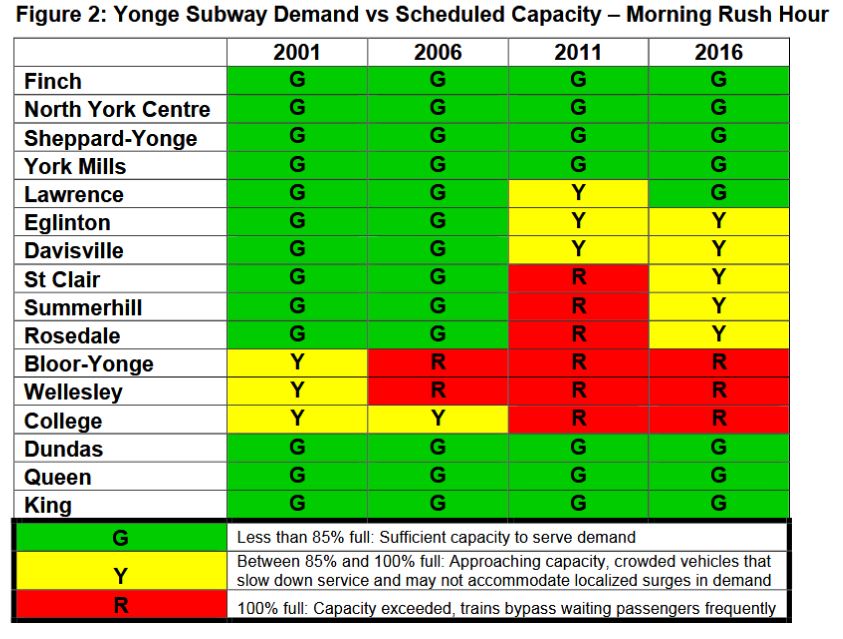
The crowding report includes diagrams showing the level of crowding for the YUS and BD lines. These do not tell the full story of what is happening. For starters, the yellow sections in the charts below show stations where trains “may not accommodate localized surges in demand”. In fact as riders well know, the problem is not with “localized” demand, but with full trains that cannot handle peak demand. This arises from a combination of inate demand such as occurs southbound from Finch and from irregular service. The smallest delay pushes almost full trains over the line, and this cascades as longer dwell times and occasional passenger emergencies thanks to overheating or panic.
What was once a “peak hour” now extends to a wider period, and the system is under stress and vulnerable to disruption for a longer time.
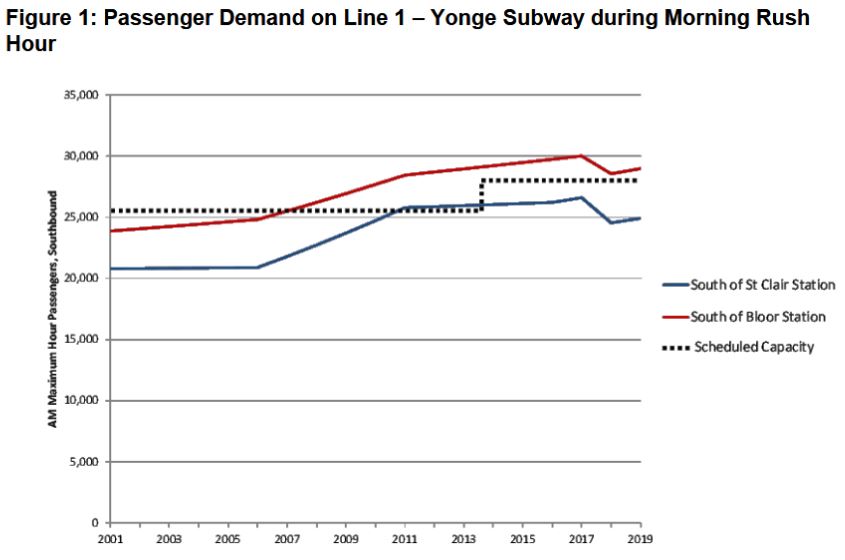
Customers have adapted to the morning rush hour crowding conditions by changing their commute times earlier or later in the morning. Whereas morning peak hour ridership on Line 1 southbound from Bloor Station has increased by about 10% since 2001, the three-hour morning peak period ridership has increased by nearly 20%. In other words, much of the growth in demand generated along the Yonge corridor has been accommodated on the shoulders of the peak hour and the “peak within the AM peak period” has spread. [Subway crowding report, p. 3]
A fundamental point about the design capacity is that one cannot operate a system at that level on a sustained basis. It is an upper bound, not a target to hit. Tell people that the Bloor and Danforth subways are not overcrowded, and they will laugh. The TTC does itself no favours with this type of presentation giving the impression that those trains you cannot get on every day are only an occasional problem.
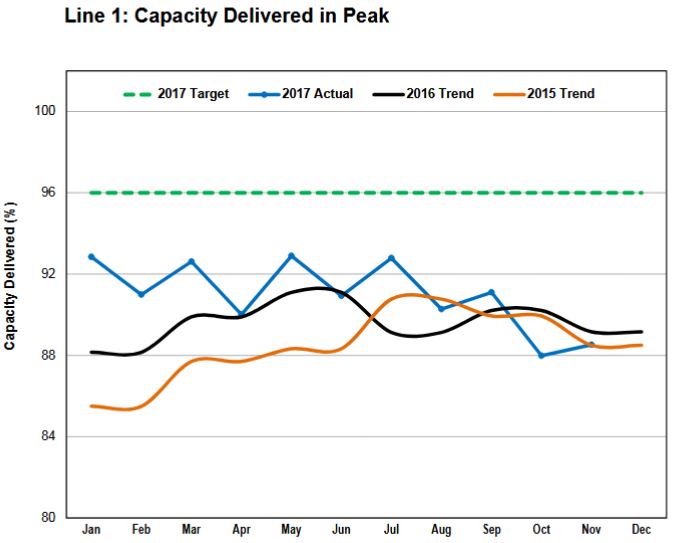
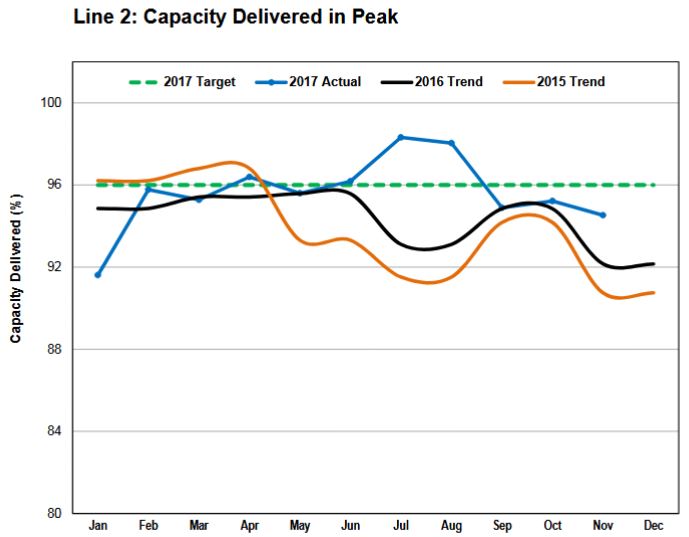
In fact the TTC never operates its service at the scheduled capacity as shown regularly in the CEO’s report.
The values shown below are averaged over the peak period and over various sampling locations. This understates the degree of the problem for the most congested locations and the most congested hour. It is of little value for 26 trains/hour to leave Finch southbound if by the time they reach Bloor, delays reduce the station throughput to a lower value.
The Yonge-University subway routinely delivers 90% or less of the scheduled capacity, and therefore conditions that appear as borderline in the tables above are actually critical. It is essential that the TTC disaggregate the data so that service levels can be matched against the claimed crowding and capacities along the routes. Far too often, the TTC uses averaged data which hides the most severe problems.
When the problem of service operating below scheduled capacity is combined with the question of “is the subway full”, the chart below verges on dishonesty. This shows the peak demand relative to scheduled service, but that level is almost never achieved and so the shortfall is much greater. The dotted line showing the YUS capacity at about 28,000 per hour should really sit at about 25,000 to reflect the 90% or less of service that actually operates. The subway has been overloaded for a decade when actual, not scheduled, capacity is used as the yardstick.
The jump in scheduled capacity in 2014 coincides with the introduction of the TR trains with about 10% greater capacity. As is quite clear here, that 10% was used up long ago and should not be spoken of as if it is a future addition to the service.
The Need for Subway Relief
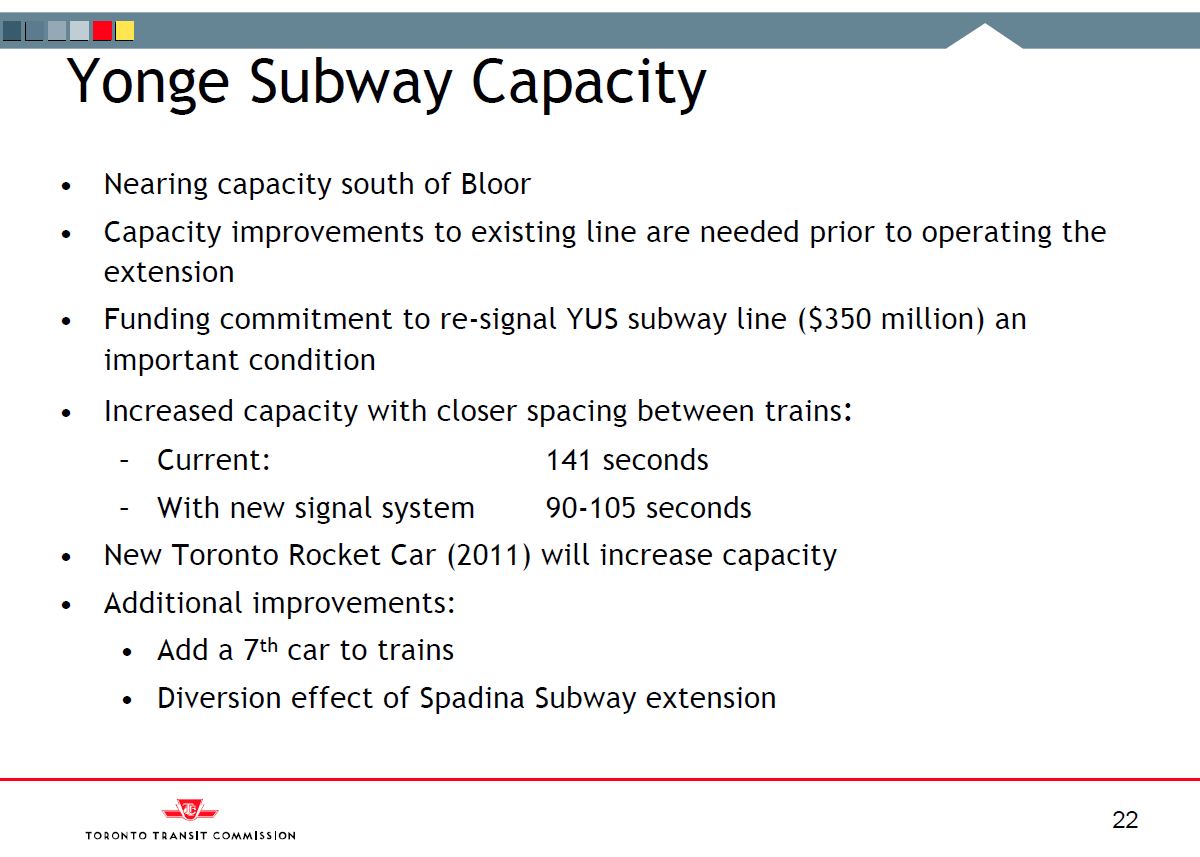
Back in December 2008, TTC staff gave a presentation on the recommended configuration of the Richmond Hill extension and the issues it raised. This presented a rather rosy picture of the ability to handle rising demand on Yonge without building the Relief Line, even though it recognized the huge benefit such a line would have in reducing demand on the heart of the subway system downtown.
In the slide below, note the claim that the new signal system could provide a 90 second headway. This has been the source of much misinformation about subway capacity. ATC can run trains quite close together, but this is intended only in backlog situations or where there is a crunch point with long dwell times. It is not achievable over the entire route, especially at terminals. A sustained 90 second headway (40 trains/hour) translates to a capacity of 44,000/hour, the sort of number that can be thrown about to claim we would never need a relief line.
However, projected demands tell a different story.
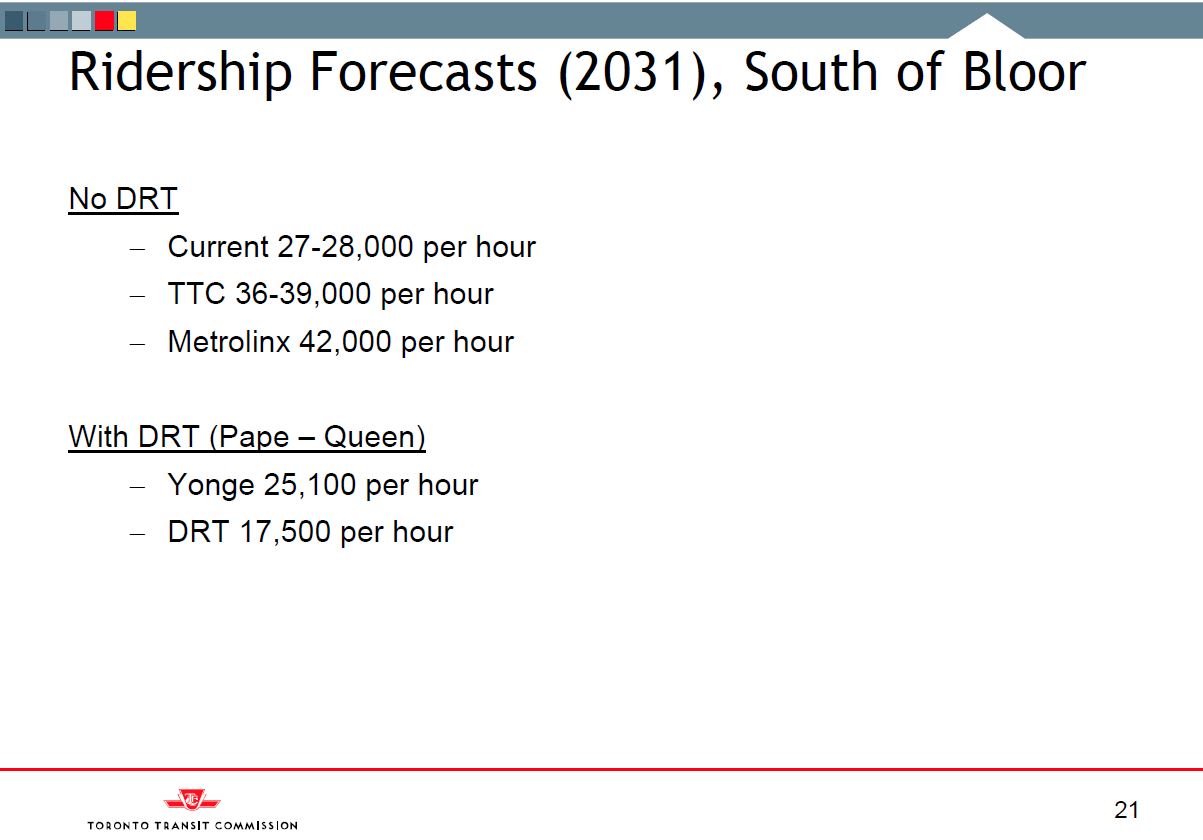
It was abundantly clear ten years ago that the DRL was required, but it languished as an unloved project while the focus looked outward to new subways for suburbia. A further problem with the projections is that they only look at the line south of Bloor when, as the TTC’s own chart shows (above) there are overcrowding problems well north of this point. That is the reason why the more recent Metrolinx Yonge corridor relief study showed a major benefit from taking the DRL all the way north to Sheppard.
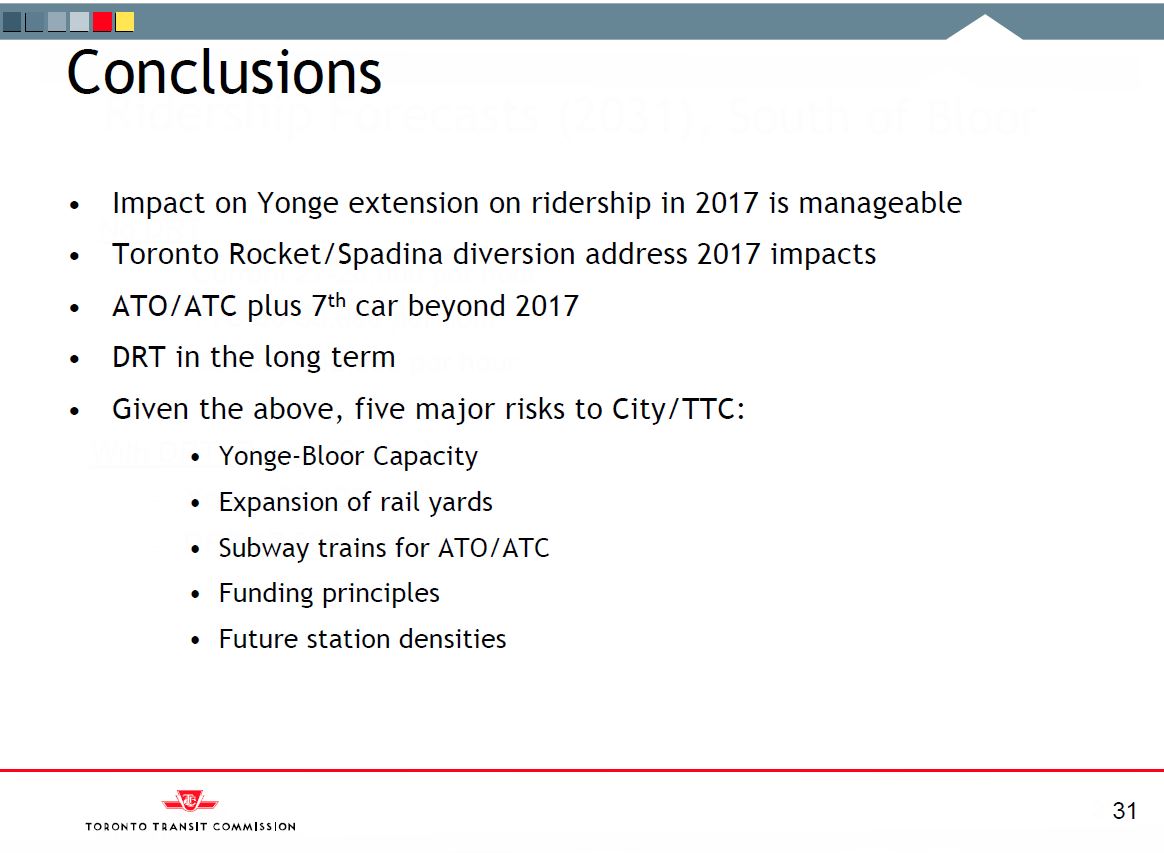
The 2008 presentation reached conclusions that are not supported by the situation as it then existed. Specifically, the claim that added ridership from the extension would be “manageable” in 2017 is complete bunk because the rate of growth in demand on the subway exceeded projections.
By March 2012, when the final Conceptual Design Report was issued, the projected demand at Richmond Hill had grown.
The projected transit ridership – developed during the TPAP – was updated during the Conceptual Design Study to reflect revised 2031 land use projections from York Region and the City of Toronto. Results suggest that more people (about a 25% increase) will board the subway at Richmond Hill Centre Station during the morning peak hour in 2031 than previously projected during the TPAP. The resultant increase reflects the implications of new secondary plans and development applications received since the completion of the TPAP in 2009. Based on current analysis, it is projected that ridership volumes in the Yonge corridor will warrant a subway within the next 10 years (i.e. before the year 2021). The minimum ridership required to warrant a subway is approximately 10,000 passengers during the peak hour. Within the next 10 years, over 12,000 peak hour passengers are expected to board or depart at RHC station alone. By 2031, ridership at RHC is expected to increase to 14,000 peak hour passengers. [page ii]
At no point did the updated report address the implications of this higher demand for the validity of earlier claims that the effects were “manageable”.
To the considerable unhappiness of York Region, the City of Toronto refused to contemplate a Richmond Hill extension until some type of relief was in place to offload demand from the subway. This is a major risk for the subway network thanks to the political influence of York Region and the cross-party hunger for its votes. Toronto could be forced to accept an extension with a half-hearted commitment to a Relief Line that might never quite materialize because of its cost.
The debate is further clouded by claims that GO’s RER plan coupled with John Tory’s SmartTrack will provide the needed relief. This ignores the relative location of RER/ST routes and their ability to drain ridership off of the subway network, even assuming GO would have the capacity to make a significant dent in subway demand.
Notable by its absence in GO’s planning is the upgrading of the Richmond Hill corridor. This is downplayed because of the cost of regrading the line through the lower Don Valley where flooding is common even though Richmond Hill GO Station would be right next door to the subway station. A related problem here is the desire by York Region travellers to get downtown for one TTC fare rather than the much higher GO fare.
The Metrolinx view of the capacity issue is summarized in the chart below.
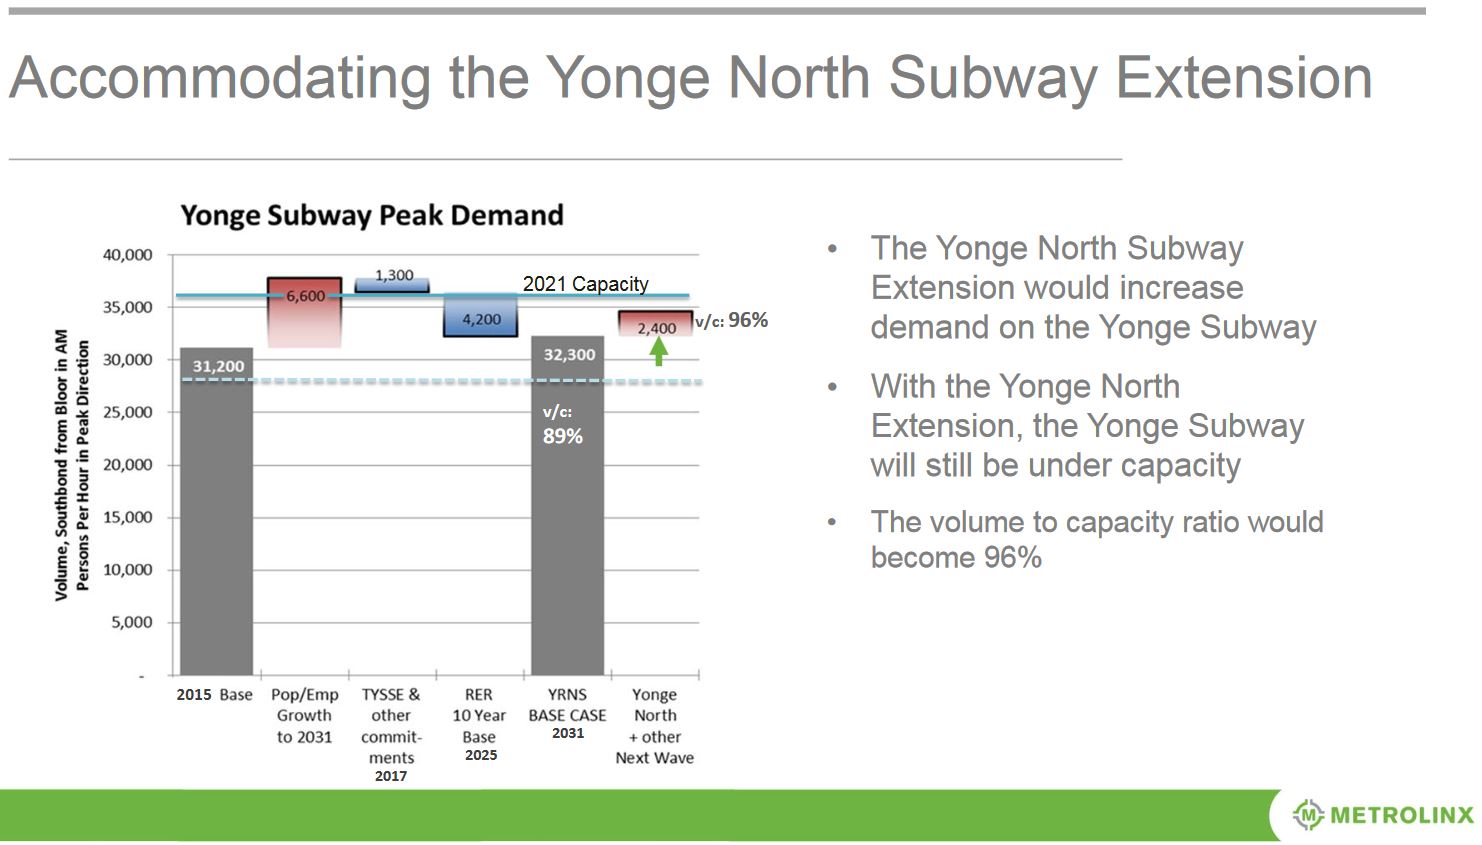
This chart develops projected demand and capacity through various steps:
- The subway’s existing capacity is taken as 28,000 (dotted line).
- The base ridership in 2015 is taken as 33,200, a value considerably higher than existing riding, but possible assuming the implementation of ATC and operation of more frequent service (the solid blue line).
- A further 6,600 riders (with unconstrained capacity) would arise from growth to 2031. This would push the subway over its capacity at 33 trains/hour.
- Although the TYSSE (Vaughan extension) will divert some riding away from the Yonge line, other planned changes such as the Eglinton Crosstown will add to demand with a net effect of another 1,300 riders in the peak hour.
- RER will divert 4,200 riders per hour away from the subway when it is fully implemented in 2025.
- The Richmond Hill extension and other related changes will add 2,400 per hour.
At this point, the subway would be almost full at 96% of theoretical capacity. However, the slightest error in any of the assumptions, not to mention the TTC’s inability to actually achieve its scheduled capacity, would put the route over the line.
Note that the additional ridership from the extension is only a fraction of the projected peak hour demand at Richmond Hill of over 14,000 according to the 2012 report. This does not line up with the premise that much growth at Richmond Hill will come from new development and suggests that the Metrolinx estimate lowballs the effect of the extension.
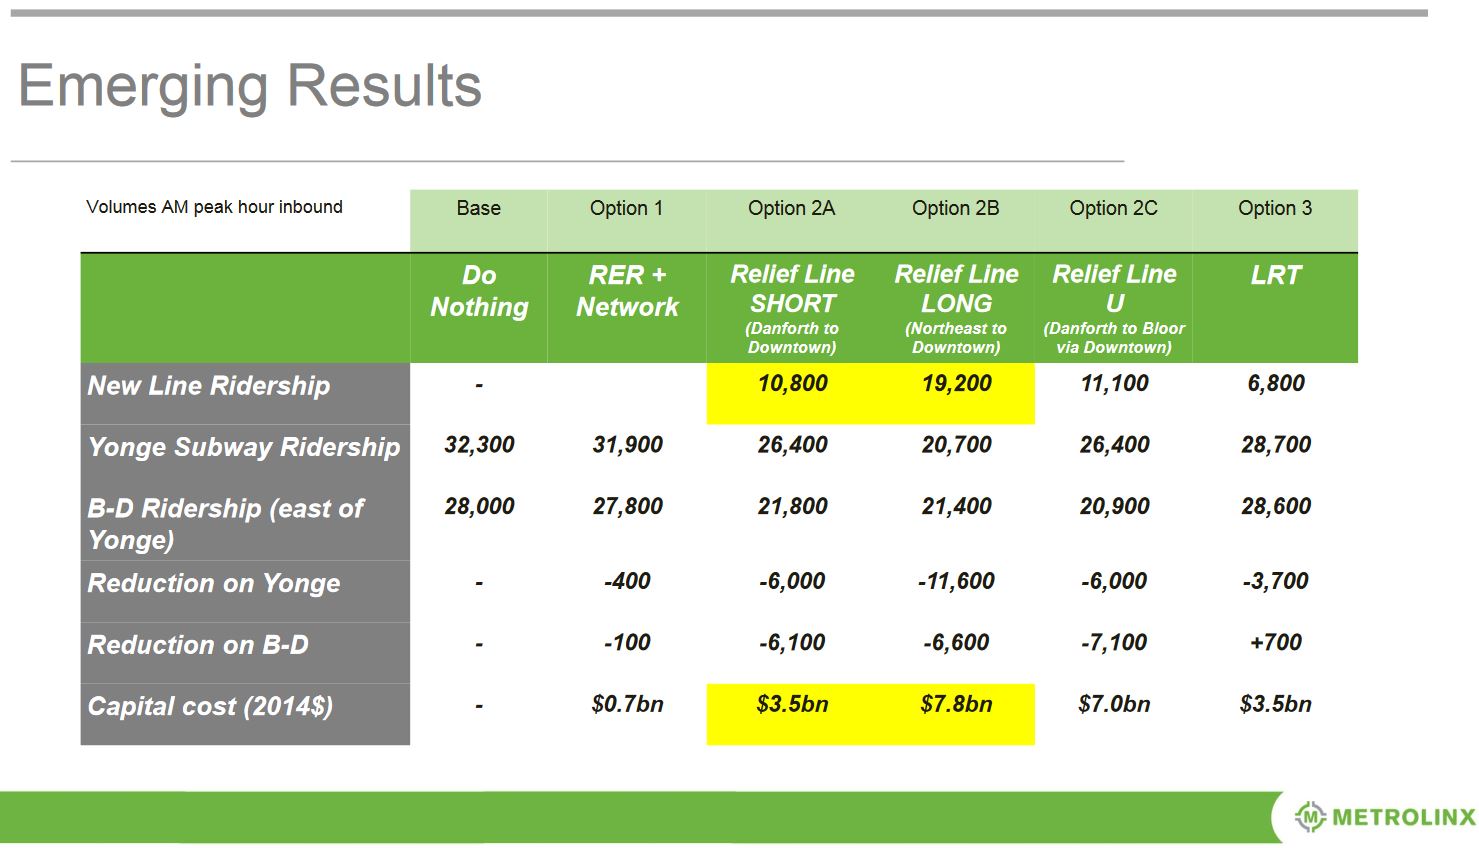
Metrolinx examined various options to relieve demand on the Yonge line, and the “Relief Line Long” running east and north to Sheppard and Don Mills would produce a huge drop in demand on the Yonge line to well below the current level. Any projections should be taken with caution, but the magnitude of change is substantial and considerable headroom would be created for growth from Richmond Hill and elsewhere. Queen’s Park’s renewed interest in the Relief Line arises directly from this projection, but whether it survives political changes over coming years could be the make-or-break issue for subway capacity.
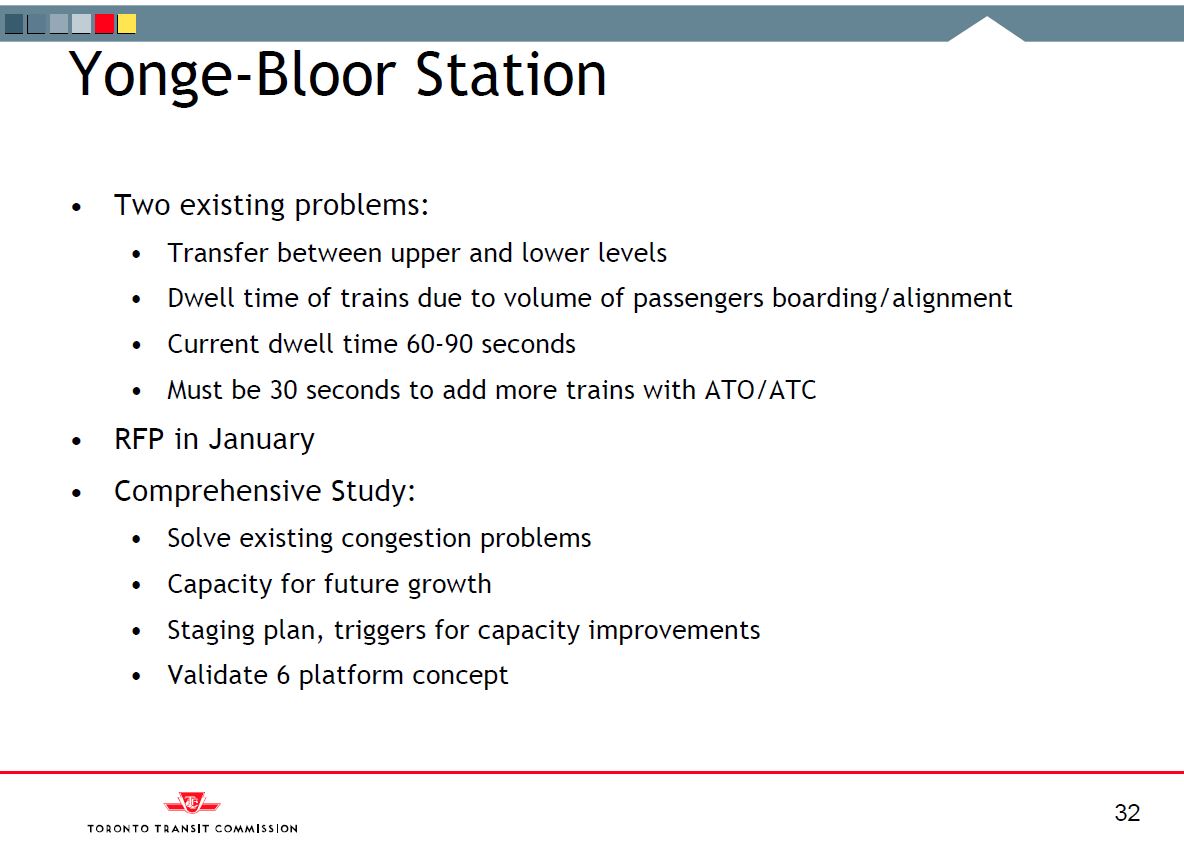
Bloor-Yonge Station
Bloor-Yonge Station routinely has crowding problems on the southbound platform in the AM peak, but this is not the only cause for concern. Circulation and stacking space for a backlog of riders during delays is limited as was seen all too clearly in the recent compound delay that totally plugged the station.
The problem also exists on the Bloor-Danforth line with its island platform that can easily fill if there is not a regular service of east-west trains to remove passengers in the PM peak. This becomes even more of an issue of more trains and more riders operate on the Yonge line because outbound riders could arrive at Bloor in the PM peak faster than they could be removed by the connecting BD service. Similar problems exist at St. George, and it is only a matter of degree because demand on the University line is not as severely over capacity as on Yonge.
A proposal to expand Bloor-Yonge capacity arises from time to time, and the pricetag on it sits at about $1 billion, a value that is almost certainly out of date. The following pages are from the December 2008 presentation about the Richmond Hill extension.
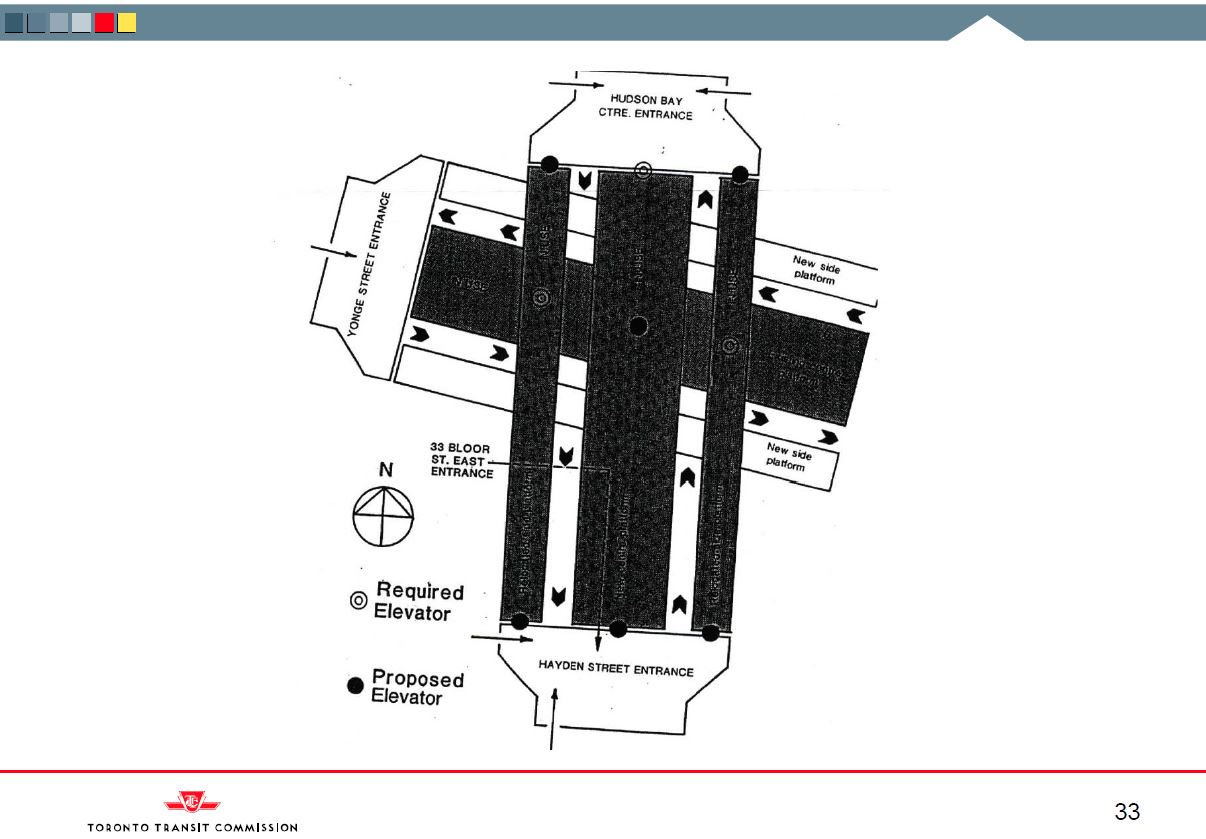
The 6 platform concept cited above requires extensive modifications to the station as shown in the diagram below. This involves moving the Yonge line’s tracks further apart so that a new centre platform can be inserted. Stations on both levels would have both a central and two side platforms. The circulation system to link all of these platforms adds to the complexity and consumes a substantial amount of platform space.
This layout has been studied before and it is extremely difficult to build. Bloor Station would have to close while the existing platforms were demolished, the tracks shifted, and new platforms constructed. It is my understanding that this scheme has been abandoned, but the assumption that “something can be done” at Bloor-Yonge remains.
Meanwhile downstairs on the BD subway, the addition of new platforms is constrained by the fact that the structure is surrounded by The Bay, its office tower and parking lot all of which were built after the Bloor subway opened. New platforms at that level would reduce crowding on the Yonge Station central platform, but would do nothing to aid with crowding upstairs in Bloor Station.
Even with all of the problems, the study downplayed the need for a Relief Line presenting it as a “last resort”.
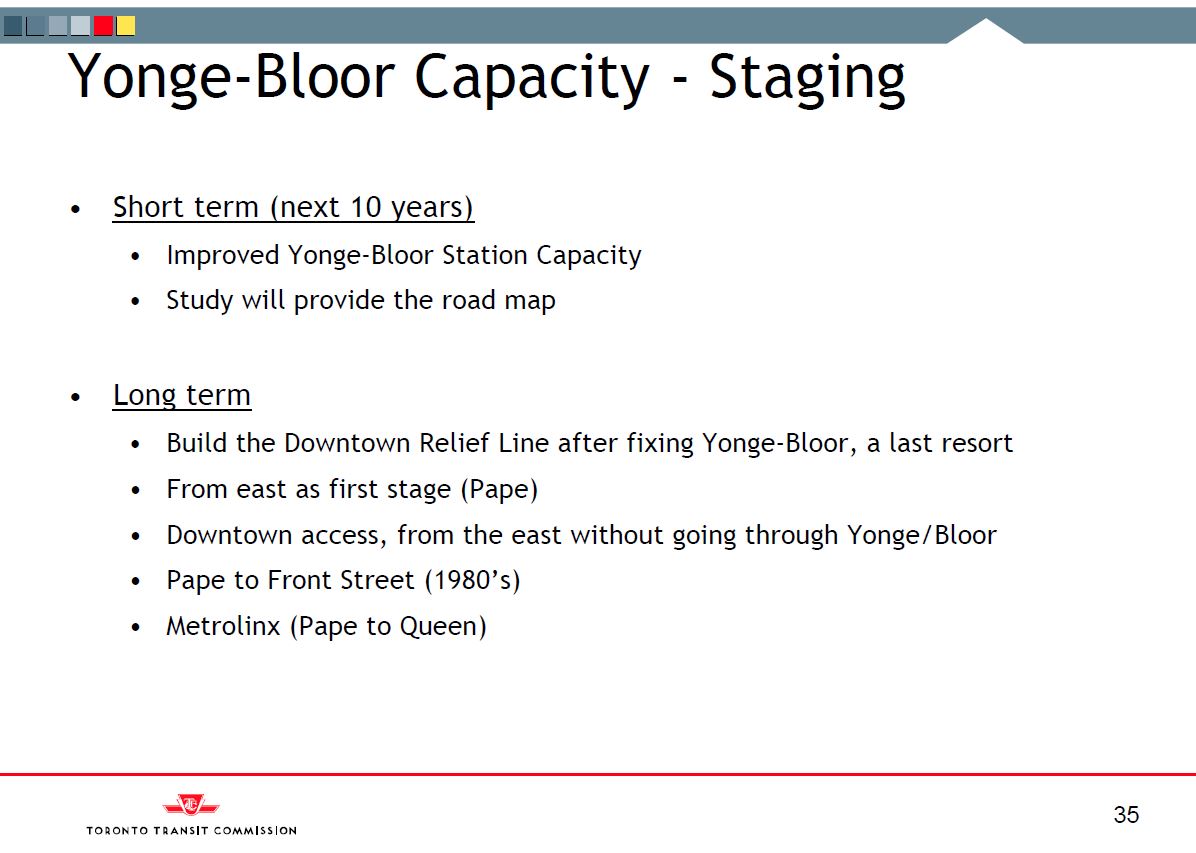
This is how we come to be in this mess with inadequate subway capacity that faces Toronto today – years of saying “relief is nice, but first let us try to fit more people on the existing line”.
The words “incompetent” and “dishonest” spring to mind, but this is what passes for planning when the imperative is to build where politicians want new transit, not where it is actually needed.

The TTC’s visual examples of off-peak overcrowding are interesting in how they contrast to your statement regarding the Councillor’s speech that it “misses the point that riders choose whether to use or to avoid transit based in part on convenience and comfort.”
Do the service standards really work on a default assumption that no one would choose to stand until every single seat is full? That is not how it works in reality for several reasons. A big one is the inability to navigate through other people to get to seats because others riders are manoeuvring to be ready to exit at one of the next few stops. We’ve all seen streetcars and buses that are “full,” yet still have empty seats. I see this even on the new Flexity cars with people bunched up at the rear door because they are going to get off at a busy stop like Yonge and are blocking people from entering, even though there are visibly empty seats.on board.
On the comfort side there is also an issue with an assumption every seat can be used. We’ve just gone through a period of winter where the back area of a bus or streetcar is often not completely full because everyone has on bulky winter garments and a space for four people is really only a space for three. Don’t get me started on the those who do not take off their giant backpacks, oblivious to the fact they block people from moving around.
LikeLike
Toronto definitely needs a relief line. What continues to be a topic on my mind is whether the current proposal, Pape to Osgoode, is the right one.
In particular, contrary to the current proposal, would Torontonians have preferred a dedicated relief line and, separately, a dedicated Queen Street line if it had been presented to them in this way?
As it stands now, Sumach Station seems awkwardly positioned for local residents. It is built on the far edge of the new River City community. It is built on the far edge of the new Pan Am community. And it is nowhere near the popular Distillery District, unless the advertised connections to the 504 and 514 are utilized.
East Harbour Station seems fantastical in its illustration and improbable as a realistic outcome. Most of the little that we do know about it is actually how the GO Transit station might look, if various parties decide to spend so extravagantly on roofing. Not nearly as much has been revealed about the quality of on-site connections to TTC subway and streetcar services.
Additionally, the development of East Harbour Station means that no station can be built at Queen and Broadview. As a result, an obvious, local connection between the 504 and the Relief Line, east of the Don River, cannot exist.
Instead, what has been suggested is that the 504 will be replaced at Broadview Station by a new “Broadview” car that will be routed to East Harbour. All of which begs the following unanswered questions: What will the 504 connect to in the east end? Where will it terminate?
As a final example, the proposed Relief Line seems to preclude future subway expansion from ever occurring east of Queen and Carlaw. It follows that it also precludes the construction of a second, more easterly connection to Line 2, if ever warranted. Coxwell trunk sewer and Lake Iroquois shoreline notwithstanding.
One might conclude, regardless of how many billions of dollars we spend, that the devil always remains in the details.
Do we dare undertake an informed consideration of the details?
LikeLike